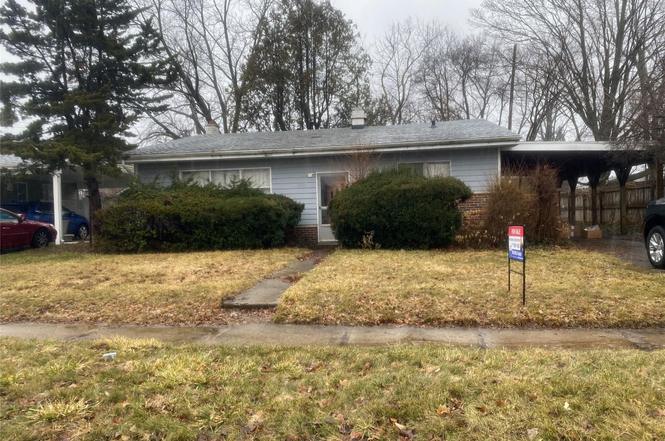
5008 Southgate Ave · Lansing, MI
Flood risk 1/10 · Minimal
- FEMA flood zone
- X (unshaded)
- Chance of flooding over 30 yrs
- 0.0%
- Est. flood insurance / yr
- $507 – $1,088
Fire risk 1/10 · Minimal
- Est. fire insurance / yr
- $784 – $1,456
Heat risk 2/10 · Minimal
- Hot days now (above 97°F)
- 7 days/yr
- Hot days in 30 yrs
- 16 days/yr
Wind risk 2/10 · Minimal
- Chance of severe wind over 30 yrs
- —
Air-quality risk 2/10 · Minimal
- Unhealthy air days now
- 1 days/yr
- Unhealthy air days in 30 yrs
- 2 days/yr
Risk factors via First Street. Map © Google.
Why this score? — see what drove the C+ grade
The composite is a weighted blend of 9 inputs, each scored 0–100. Each bar is that input's sub-score; the figure is the points it added to the 100-point composite (weight × sub-score).
- Cash flow +20.8/30.0
- ARV discount +15.0/15.0
- DSCR +6.6/10.0
- 1% rule +6.5/10.0
- Livability +4.0/5.0
- Rent growth +3.7/5.0
- Condition / age +2.5/5.0
- Schools +1.9/10.0
- Appreciation +0.0/10.0
$97,500
🖨 Deal sheet 📄 Offer letter ✓ Due diligence
Listing remarks MLS
Attention Investors- This home is a 3 bedroom 1 bathroom bi level in South Lansing. This home is a diamond in the rough. This home appears to be in good condition under all the stuff. The home has a double carport. The family room area has a wood burning stove. Agents please see waiver for entry.
Key facts
- Double carport
- Wood burning stove
- 7,405 sq ft lot
Tags
Neighborhood map
What this means for you Summary
Snapshot
- This is a 3-bed/1.5-bath single-family listed at $98k.
Deal economics
- At list price, monthly cash flow is $133 ($2k/yr) — positive.
- The deal already cash-flows at list — no discount required.
- Meets the 1% rule at list price ($1k rent vs $98k).
- Recommended offer: $96k (1.5% below list) — sets the bar for market timing.
- Cap rate 7.9% vs local median 6.0% in Lansing — top-decile yield for the area; either an underpriced asset or a hidden risk that comps aren't pricing in. Stress-test before assuming the spread holds.
Location & tenants
- Location reads 79/100 on livability (#94 in MI, #2,182 nationally) — a middle-class / working-renter tenant base. Strengths: amenities A+, commute A+, cost of living A+; Watch: employment D, schools F, crime F.
- Lansing Public School District (urban): math 14% / reading 23% proficiency, ranked #650 of 760 in MI (top 86%) — low school quality limits family demand, transient renter base, plan for 1-2y turnover; 68% free/reduced lunch — lower-income household profile, screen leases tightly.
- Market conditions: Rents rising fast (+4.7%/yr); 177 active listings in the ZIP; 17 comparable units currently listed for rent nearby; rentals at typical pace (median 21d on market — plan ~3-4 weeks tenant-placement turnaround); 350 units permitted in Ingham County in 2024 (186 in 5+ unit buildings).
Forward outlook
- Local home prices are declining (-3.0%/yr); year-one equity from $674 of loan paydown is wiped out by about $3k of value loss. Plan a longer hold.
- Ingham County population projected at +11% by 2050 — modest demand growth; plan on rents tracking national, not racing it.
Negotiation context
- It's been on market 17 days — a 2% lower offer ($96k) is reasonable based on typical stale-listing flexibility.
- 2 sale attempts with the ask held roughly flat each time — persistent listings suggest the price (not the market) is what's stuck; bring a comps-based counter.
Risks & watch-outs
- Watch-outs: built in 1957 — expect roof / HVAC / electrical / plumbing capex.
Questions for the listing agent
- Built in 1957 — when were the roof, HVAC, electrical panel, plumbing, and water heater last replaced?
- Is there a deadline driving the sale (1031 exchange, divorce, estate, relocation)? That informs how much negotiation room exists.
- Schools are F-rated, which usually means shorter tenancies and higher turnover. Who's the typical renter profile here, and what's been the actual vacancy rate?
- Crime grade is F in this area — have there been break-ins, vandalism, or insurance claims at this property in the last 3 years? What carrier currently insures it and at what premium?
- What's the average days-on-market for RENTAL listings here right now (not sales)? A rising rental-DOM trend means longer vacancies and softer asking-rent achievability than the comps imply.
- What's the recent tenant-quality profile in this submarket — average credit score on applications, eviction rate, late-payment / NSF rate, and stable-employment percentage? A property-management company in the area should have these aggregated.
- How much new for-sale + rental construction is in the pipeline within 1–3 miles? Heavy new supply typically softens prices + rents 12–24 months out; constrained supply supports both.
Investment metrics
- 1% rule
- 1.15% ✓
- Cap rate
- 7.93%
- Cash-on-cash
- 5.84%
- DSCR
- 1.26
- GRM
- 7.2
CMA / ARV
- ARV (on-the-fly)
- $153,000
- Comps found
- 12
Show comp detail 12 sales within ~0.75 mi
| Address | Dist | Beds/Ba | Sqft | Sold | Price | $/sf | Match |
|---|---|---|---|---|---|---|---|
| 1101 Barr Ave | 0.33mi | 3/2.0 | 1,176 (-4%) | 7mo | $184,900 | $157 | 70 |
| 220 E Potter Ave | 0.49mi | 3/1.5 | 1,248 (+2%) | 5mo | $155,000 | $124 | 70 |
| 5019 Devonshire Ave | 0.39mi | 3/1.0 | 1,360 (+11%) | 0mo | $200,000 | $147 | 61 |
| 221 W Everettdale Ave | 0.69mi | 3/2.0 | 1,203 (-2%) | 3mo | $113,920 | $95 | 61 |
| 3907 Glenwood Ave | 0.68mi | 4/1.5 (+1) | 1,200 (-2%) | 2mo | $150,000 | $125 | 58 |
| 111 E Potter Ave | 0.60mi | 4/1.0 (+1) | 1,274 (+4%) | 1mo | $105,000 | $82 | 58 |
| 4815 S Pennsylvania Ave | 0.28mi | 2/2.0 (-1) | 1,070 (-13%) | 3mo | $139,400 | $130 | 56 |
| 4218 Donald St | 0.63mi | 2/1.0 (-1) | 1,206 (-2%) | 7mo | $139,900 | $116 | 56 |
| 4608 Alpha St | 0.39mi | 3/1.0 | 1,058 (-14%) | 3mo | $149,900 | $142 | 55 |
| 4317 S Cedar St | 0.49mi | 2/1.0 (-1) | 1,301 (+6%) | 6mo | $59,000 | $45 | 54 |
| 5751 Joshua St | 0.68mi | 3/1.5 | 1,124 (-8%) | 6mo | $195,000 | $173 | 50 |
| 4613 Stafford Ave | 0.61mi | 2/1.0 (-1) | 1,378 (+13%) | 5mo | $155,000 | $112 | 39 |
Match score weights: distance 35% · size 25% · config 20% · recency 20%. Top-matched comps best support the ARV.
Projected returns pro-forma
-3.0% appreciation · 4.71% rent growth · sell at horizon
- IRR
- -5.1%
- Equity multiple
- 0.81×
- Total profit
- $-5,301
- Equity at exit
- $14,538
- IRR
- 6.7%
- Equity multiple
- 1.55×
- Total profit
- $14,901
- Equity at exit
- $8,430
Cash invested: $27,300 (down + closing). Projections, not guarantees.
Landlord ↔ Tenant lean methodology
- Overall (STATE)
- 62 Landlord-Friendly
- State Michigan
- 62 Landlord-Friendly · EVEN
- County
- — inherits STATE
- City
- — inherits STATE
ZIP-level market 48910
- Rents YoY
- 4.7%
- Active inventory
- 177
- Price-to-rent
- 7.2×
Monthly cashflow live
- Estimated rent
- $1,122 high interval (Pro) →
- Mortgage (P&I)
- −$511
- Tax from tax record
- −$202 /mo · $2,422/yr
- Insurance
- −$41
- HOA
- −$0
- Vacancy / Maint / Mgmt
- −$236
- Net cashflow
- $133
Break-even live
UW: 25.0% down · 7.5% · 30yr · 1.5% tax · 5.0% vac · 8.0% maint · 8.0% mgmt
Financing live
Cash to close
- Down payment
- $24,375
- Closing costs
- $2,925
- Reserves months
- —
- Total cash needed
- —
Loan-product check · same deal, 3 products live
Conventional
25% down · 7.5% · 30yr
- Down + closing
- —
- Monthly P&I
- —
- Monthly cashflow
- —
- DSCR
- —
- Eligible?
- —
Personal DTI + credit; lowest rate.
DSCR
20% down · 8.5% · 30yr
- Down + closing
- —
- Monthly P&I
- —
- Monthly cashflow
- —
- DSCR
- —
- Eligible?
- —
No personal income docs; deal must DSCR.
Hard money
10% down · 12.0% · 12mo
- Down + closing
- —
- Monthly P&I
- —
- Monthly cashflow
- —
- DSCR
- —
- Eligible?
- —
Short-term bridge; refi at stabilization.
Rent comps 17 comps
| Address | Beds | Baths | Sqft | Rent | $/sqft | DOM | Units | Dist |
|---|---|---|---|---|---|---|---|---|
| 645 E Jolly Rd Lansing, MI | 1.0–2.0 | 1.0 | 775 | $825 | $1.06 | 43d | 1 | 0.04mi |
| 910 E Jolly Rd #2 Lansing, MI | 1.0–2.0 | 1.0 | 625 | $895 | $1.43 | 21d | 2 | 0.20mi |
| 5521 Joshua St Unit ST-102 Lansing, MI | 2.0 | 1.0 | 812 | $975 | $1.20 | 43d | 1 | 0.43mi |
| 5540 Kaynorth Rd Unit 4 Lansing, MI | 2.0 | 1.0 | 745 | $925 | $1.24 | 43d | 1 | 0.44mi |
| 814 Louisa St Lansing, MI | 2.0 | 1.0 | 850 | $950 | $1.12 | 13d | 2 | 0.57mi |
| 3518 Davidson Dr Lansing, MI | 2.0 | 2.0 | 850 | $1,115 | $1.31 | 43d | 3 | 1.05mi |
| 6129 Beechfield Dr Lansing, MI | 1.0–2.0 | 1.0 | 894 | $1,100 | $1.23 | 13d | 1 | 1.17mi |
| 911 W Cavanaugh Rd Lansing, MI | 1.0–2.0 | 1.0 | 775 | $1,000 | $1.29 | 21d | 1 | 1.24mi |
| 2301 E Jolly Rd Lansing, MI | 1.0–2.0 | 1.0–1.5 | 1045 | $1,440 | $1.38 | 13d | 10 | 1.27mi |
| 2305 E Jolly Rd Unit 2319-04 Lansing, MI | 2.0 | 1.5 | 1300 | $1,420 | $1.09 | 43d | 1 | 1.30mi |
| 2305 E Jolly Rd Unit 2309-07 Lansing, MI | 2.0 | 1.5 | 1300 | $1,440 | $1.11 | 21d | 1 | 1.30mi |
| 2305 E Jolly Rd Unit 2401-21 Lansing, MI | 2.0 | 1.5 | 830 | $1,315 | $1.58 | 13d | 1 | 1.30mi |
| 2305 E Jolly Rd Unit 2319-14 Lansing, MI | 2.0 | 1.5 | 1300 | $1,345 | $1.03 | 21d | 1 | 1.30mi |
| 1115 Dorchester Cir Lansing, MI | 2.0 | 1.0 | 850 | $855 | $1.01 | 13d | 5 | 1.30mi |
| 1001 W Cavanaugh Rd Lansing, MI | 1.0–2.0 | 1.0 | 775 | $850 | $1.10 | 13d | 4 | 1.31mi |
| 315 E Edgewood Blvd Lansing, MI | 2.0 | 1.0 | 615 | $1,245 | $2.02 | 13d | 14 | 1.33mi |
| 401 E Willard Ave Unit 19 Lansing, MI | 2.0 | 1.0 | 775 | $1,000 | $1.29 | 43d | 1 | 1.48mi |
Listing history 5 events
-
2026-04-14soldstatus $86,000
-
2026-03-23status Pending 297-char remark
Show marketing remark (297 chars)
Attention Investors- This home is a 3 bedroom 1 bathroom bi level in South Lansing. This home is a diamond in the rough. This home appears to be in good condition under all the stuff. The home has a double carport. The family room area has a wood burning stove. Agents please see waiver for entry.
-
2026-03-23status Pending
Show marketing remark (297 chars)
Attention Investors- This home is a 3 bedroom 1 bathroom bi level in South Lansing. This home is a diamond in the rough. This home appears to be in good condition under all the stuff. The home has a double carport. The family room area has a wood burning stove. Agents please see waiver for entry.
-
2026-03-02$97,500 Active 297-char remark
Show marketing remark (297 chars)
Attention Investors- This home is a 3 bedroom 1 bathroom bi level in South Lansing. This home is a diamond in the rough. This home appears to be in good condition under all the stuff. The home has a double carport. The family room area has a wood burning stove. Agents please see waiver for entry.
-
2026-03-02$97,500 Active
Show marketing remark (297 chars)
Attention Investors- This home is a 3 bedroom 1 bathroom bi level in South Lansing. This home is a diamond in the rough. This home appears to be in good condition under all the stuff. The home has a double carport. The family room area has a wood burning stove. Agents please see waiver for entry.
ⓘ Source: listings_history table (triggers on properties + properties_extension) + one-shot
backfill from property_details.listing_events for pre-trigger history.
Tax reassessment forecast MI · Partial reset (capped growth)
- Current annual tax
- $2,422 · $202/mo
- Projected year-2 tax
- $2,422 · $202/mo
- Expected delta
- $0/yr ($0/mo · 0.0%)
ⓘ Screening estimate from a state-policy table — verify with the county assessor before closing.
Climate risk First Street
- Flood 1/10 Low FEMA zone X (unshaded) · 0% chance over 30 yrs
- Wildfire 1/10 Low
- Heat 2/10 Low 7 d/yr ≥97°F today · 16 d/yr by 30 yrs out
- Wind 2/10 Low
- Air quality 2/10 Low 1 unhealthy d/yr today · 2 by 30 yrs out
Nearby sold comps map
Loading sold comps map…
Walkable amenities ~0.75 mi
Loading nearby amenities…
Taxation est. · year 1
- Rental income
- $13,469
- − Mortgage interest
- −$5,462
- − Property taxes
- −$2,422
- − Insurance
- −$488
- − Repairs & maintenance
- −$1,077
- − Management
- −$1,077
- − Depreciation
- −$2,836
- Taxable income
- $107
- Est. tax owed @ 24.0%
- −$26
- After-tax cash flow
- $1,570/yr
For passive investors: Depreciation is non-cash, so a rental often shows a tax loss while cash-flowing — sheltering income. Rental losses are passive: they offset passive income freely, and up to $25,000/yr can offset ordinary (W-2) income if you actively participate and your MAGI is under $100k (phasing out to $0 by $150k); unused losses carry forward. On sale, claimed depreciation is recaptured at up to 25%, and gains may owe capital-gains tax (a 1031 exchange can defer both). Figures are a year-1 estimate at your 24.0% rate — not tax advice; consult a CPA.
Schools (NCES district)
- District
- Lansing Public School District
- NCES district ID
- 2621150
- Math proficiency
- 14% ▲ 1.00%
- Reading proficiency
- 23% ▲ 3.00%
- Median HH income
- $37,453
- Composite
- 18.76/100
- National rank
- #14002
- State rank
- #650 of 760 in MI
Livability — Lansing
- Score
- 79/100
- State rank
- #94
- US rank
- #2182
Category grades
Schools grade is shown separately in the Schools card above.
Census & demographics
- Census place
- Lansing, MI
- County
- Ingham County · 237,052 people
- City population
- 161,269
- Metro
- Lansing-East Lansing, MI
- Population (ZIP)
- 32,800
- Household income
- $54,712
- Rent vs Own
- Severe rent burden
- 1305.0
Population outlook (Ingham County) Hauer SSP2
- Today (2025)
- 300,362 people
- By 2030
- 307,808 · +2.5%
- By 2040
- 320,492 · +6.7%
- By 2050
- 333,223 · +10.9%
- By 2075
- 373,693 · +24.4%
- By 2100
- 392,021 · +30.5%
Race, ethnicity, and origin ACS 2023
- Neighborhood character
- Diverse neighborhood (Simpson 0.62)
- Race & ethnicity
- White 58% Black 16% Hispanic / Latino 12% Two or more races 12% Asian 4% Native American 1%
- Hispanic origin (detail)
- Mexican 9% Cuban 2%
- Common ancestry
- Romanian 5% Lithuanian 3% Slovak 2%
- Foreign-born
- 9% · Canada, China, Vietnam
- Languages at home
- 87% English-only · Spanish 6% Chinese 1% Other Indo-European 1%
Political lean MEDSL · Ingham
- 2024 margin
- Strong D (+29.7) · D 63.9% · R 34.2% · Other 2.0%
- 2008→2024 swing
- -3.6pp toward R · 2008: 33.3pp · 2024: 29.7pp
- All cycles
- 2024: D+29.7 2020: D+32.2 2016: D+27.6 2012: D+27.9 2008: D+33.3
Not yet ingested
- Civics
- —
Market trends
- HPI YoY
- ▼ -211.82%
- Current HPI
- 196.8087
- Rent YoY
- ▲ 4.71%
- Metro
- Lansing-East Lansing, MI
- State GDP YoY
- ▲ 1.37%
- F500 in state
- 28
Industry mix (Fortune 500 HQ in MI)
| Industry | F500 HQs | Revenue |
|---|---|---|
| Automotive Parts | 3 | $48B |
|
||
| Automotive | 2 | $372B |
|
||
| Chemicals | 1 | $45B |
|
||
| Automotive Retail | 1 | $29B |
|
||
| Healthcare / Medical Devices | 1 | $23B |
|
||
| Automotive Technology | 1 | $20B |
|
||
Price history
-11.8% since first listed5 events — show timeline
- 2026-04-14 Sold (Public Records) $86,000 Public Records
- 2026-03-23 Pending — MiRealSource-MiMLS
- 2026-03-23 Pending — REALCOMP
- 2026-03-02 Listed $97,500 REALCOMP
- 2026-03-02 Listed $97,500 MiRealSource-MiMLS
Property tax history
+3.9%/yrLatest (2025): $2,422 · +3.0% YoY. Source: county tax records.
Cash-flow waterfall
monthlySold comps — $/sqft
last 12 mo · ≤1 miLoading sold comps…