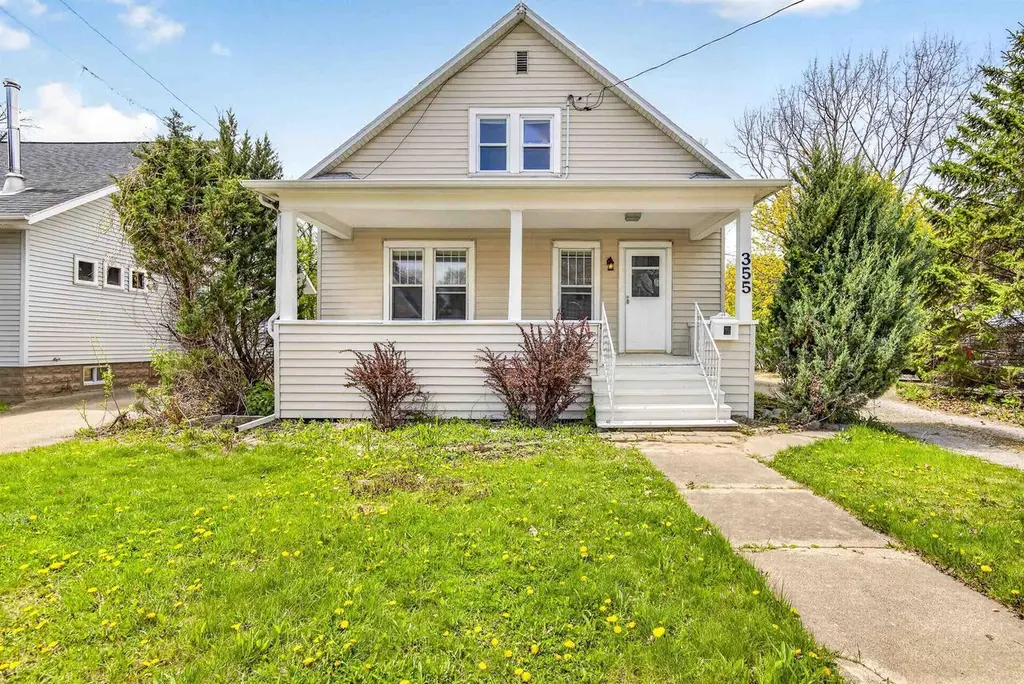
355 Oak St · Menasha, WI
Flood risk 1/10 · Minimal
- FEMA flood zone
- X (unshaded)
- Chance of flooding over 30 yrs
- 0.0%
- Est. flood insurance / yr
- $473 – $860
Fire risk 1/10 · Minimal
- Est. fire insurance / yr
- $636 – $1,182
Heat risk 2/10 · Minimal
- Hot days now (above 97°F)
- 7 days/yr
- Hot days in 30 yrs
- 13 days/yr
Wind risk 2/10 · Minimal
- Chance of severe wind over 30 yrs
- —
Air-quality risk 2/10 · Minimal
- Unhealthy air days now
- 1 days/yr
- Unhealthy air days in 30 yrs
- 2 days/yr
Risk factors via First Street. Map © Google.
Why this score? — see what drove the D+ grade
The composite is a weighted blend of 9 inputs, each scored 0–100. Each bar is that input's sub-score; the figure is the points it added to the 100-point composite (weight × sub-score).
- ARV discount +10.5/15.0
- Appreciation +10.0/10.0
- Cash flow +7.9/30.0
- Livability +4.0/5.0
- Rent growth +3.7/5.0
- Condition / age +2.5/5.0
- Schools +2.3/10.0
- 1% rule +2.2/10.0
- DSCR +2.0/10.0
$255,000
🖨 Deal sheet 📄 Offer letter ✓ Due diligence
Listing remarks MLS
What a Cute House! There is charm everywhere in this 4-5 bedroom home located on Doty Island. Updates include: furnace, water heater, back covered porch, refinished hardwood floors on the main floor. 1 car garage (wood shake). Some newer windows upstairs.
Key facts
- Natural light
- Efficient kitchen
- Covered rear deck
Tags
Property features AI
Exterior
- Parking: Detached 1-car garage; One garage parking space
- Utilities: Municipal water; Municipal sewer; Natural gas; Electric service
- Home design: 1.5-story single-family home; Construction completed; Residential zoning; Lot size about 0.19 acres
- Construction: Full basement (block foundation)
- Exterior features: Deck; Vinyl exterior; Sidewalks
Interior
- Kitchen: Kitchen on main level, about 13 x 10; Refrigerator; Range/oven
- Bedrooms: Master bedroom on main level, about 13 x 12; Second bedroom on upper level, about 13 x 11; Third bedroom on upper level, about 12 x 10; Fourth bedroom on upper level, about 15 x 8; Fifth bedroom on upper level, about 11 x 8
- Flooring: Wood floors
- Bathrooms: Two full bathrooms; At least one tub
- Heating & cooling: Forced air heating; Central air; Natural gas heating
- Interior features: Cable/satellite available; High-speed internet; Wood floors; Full block basement
- Laundry & utility: Washer; Dryer
Neighborhood map
What this means for you Summary
Snapshot
- This is a 5-bed/2.0-bath single-family listed at $255k.
Deal economics
- At list price, monthly cash flow is $-273 ($-3k/yr) — negative.
- To cash-flow at today's rent, offer at most $207k (18.9% below list).
- To meet the 1% rule (rent ≥ 1% of price), the offer needs to be $184k (27.7% below list).
- Recommended offer: $184k (27.7% below list) — sets the bar for 1% rule.
- Cap rate 5.0% vs local median 2.5% in Menasha — top-decile yield for the area; either an underpriced asset or a hidden risk that comps aren't pricing in. Stress-test before assuming the spread holds.
Location & tenants
- Location reads 80/100 on livability (#59 in WI, #1,628 nationally) — a professional / high-income tenant draw. Strengths: commute A+, cost of living A+, housing A+; Watch: employment C-, amenities D.
- Menasha Joint School District (suburban): math 30% / reading 24% proficiency, ranked #300 of 342 in WI (top 88%) — low school quality limits family demand, transient renter base, plan for 1-2y turnover.
- Zoned schools: Butte Des Morts Elementary (math 37% / reading 17%, grade F, #746 of 1,041 statewide, top 75%, 336 students, 67% FRL); Menasha High (math 14% / reading 17%, grade F, #413 of 483 statewide, top 85%, 966 students, 50% FRL).
- Market conditions: Rents rising fast (+4.6%/yr); 69 active listings in the ZIP; 652 units permitted in Winnebago County in 2024 (333 in 5+ unit buildings).
- This rent runs 32% of the median local income ($69k/yr) — at the standard rent-burdened threshold; future hikes will face affordability resistance.
Forward outlook
- In year one you build about $27k of equity ($2k loan paydown + $26k appreciation (10.0% local appreciation)).
- Winnebago County population projected at +3% by 2050 — modest demand growth; plan on rents tracking national, not racing it.
- By year 2, paydown + projected appreciation supports a ~$44k cash-out refi (75% LTV) — recoverable capital for the next deal without selling this one.
Negotiation context
- It's been on market 38 days — a 3% lower offer ($247k) is reasonable based on typical stale-listing flexibility.
- 2 sale attempts since 6y ago with the ask held roughly flat each time — persistent listings suggest the price (not the market) is what's stuck; bring a comps-based counter.
- Current owner paid $152k; list at $255k implies a 68% gain — meaningful room to come down on a strong offer.
Risks & watch-outs
- Watch-outs: built in 1930 — expect roof / HVAC / electrical / plumbing capex.
Questions for the listing agent
- What do current leases actually rent for vs. the listed asking? Can we see a recent rent roll and the last 12 months of T-12 income?
- It's been on market 38 days. Have you received any prior offers? Is the seller open to a 28% concession, seller financing, or rate buy-down credit?
- Built in 1930 — when were the roof, HVAC, electrical panel, plumbing, and water heater last replaced?
- Is there a deadline driving the sale (1031 exchange, divorce, estate, relocation)? That informs how much negotiation room exists.
- Schools are D-rated, which usually means shorter tenancies and higher turnover. Who's the typical renter profile here, and what's been the actual vacancy rate?
- The area grade is low — what's the realistic commute time and amenity access for the typical tenant pool here? Any planned neighborhood developments (good or bad) we should know about?
- What's the average days-on-market for RENTAL listings here right now (not sales)? A rising rental-DOM trend means longer vacancies and softer asking-rent achievability than the comps imply.
- What's the recent tenant-quality profile in this submarket — average credit score on applications, eviction rate, late-payment / NSF rate, and stable-employment percentage? A property-management company in the area should have these aggregated.
- How much new for-sale + rental construction is in the pipeline within 1–3 miles? Heavy new supply typically softens prices + rents 12–24 months out; constrained supply supports both.
Investment metrics
- 1% rule
- 0.72% ✗
- Cap rate
- 5.01%
- Cash-on-cash
- -4.59%
- DSCR
- 0.80
- GRM
- 11.5
CMA / ARV
- ARV (on-the-fly)
- $272,896
- Comps found
- 11
Show comp detail 11 sales within ~0.75 mi
| Address | Dist | Beds/Ba | Sqft | Sold | Price | $/sf | Match |
|---|---|---|---|---|---|---|---|
| 311 Elm St | 0.20mi | 4/1.0 (-1) | 1,622 (-2%) | 2mo | $315,000 | $194 | 76 |
| 403 Naymut St | 0.09mi | 4/2.0 (-1) | 1,602 (-4%) | 20mo | $215,000 | $134 | 68 |
| 369 Lopas St | 0.50mi | 4/2.0 (-1) | 1,646 (-1%) | 7mo | $289,900 | $176 | 64 |
| 428 10th St | 0.21mi | 4/2.0 (-1) | 1,720 (+3%) | 21mo | $330,000 | $192 | 62 |
| 505 E Forest Ave | 0.43mi | 4/1.0 (-1) | 1,600 (-4%) | 8mo | $236,500 | $148 | 58 |
| 201 5th St | 0.54mi | 4/1.5 (-1) | 1,770 (+6%) | 3mo | $309,900 | $175 | 55 |
| 721 2nd St | 0.67mi | 4/1.5 (-1) | 1,622 (-2%) | 4mo | $248,000 | $153 | 54 |
| 409 2nd St | 0.58mi | 4/1.5 (-1) | 1,500 (-10%) | 6mo | $245,500 | $164 | 45 |
| 113 High St | 0.60mi | 4/3.0 (-1) | 1,556 (-6%) | 11mo | $199,900 | $128 | 43 |
| 211 1st St | 0.69mi | 4/2.0 (-1) | 1,680 (+1%) | 23mo | $200,000 | $119 | 42 |
| 709 1st St | 0.60mi | 4/2.0 (-1) | 1,435 (-14%) | 20mo | $240,000 | $167 | 28 |
Match score weights: distance 35% · size 25% · config 20% · recency 20%. Top-matched comps best support the ARV.
Projected returns pro-forma
10.0% appreciation · 4.62% rent growth · sell at horizon
- IRR
- 21.5%
- Equity multiple
- 2.74×
- Total profit
- $124,555
- Equity at exit
- $229,724
- IRR
- 19.7%
- Equity multiple
- 6.42×
- Total profit
- $387,096
- Equity at exit
- $495,409
Cash invested: $71,400 (down + closing). Projections, not guarantees.
Landlord ↔ Tenant lean methodology
- Overall (STATE)
- 73 Landlord-Friendly
- State Wisconsin
- 73 Landlord-Friendly · R+2
- County
- — inherits STATE
- City
- — inherits STATE
ZIP-level market 54952
- Home prices YoY
- 7.2%
- Rents YoY
- 4.6%
- Active inventory
- 69
- Price-to-rent
- 11.5×
Monthly cashflow live
- Estimated rent
- $1,843 medium interval (Pro) →
- Mortgage (P&I)
- −$1,337
- Tax from tax record
- −$285 /mo · $3,425/yr
- Insurance
- −$106
- HOA
- −$0
- Vacancy / Maint / Mgmt
- −$387
- Net cashflow
- $-273
Break-even live
UW: 25.0% down · 7.5% · 30yr · 1.5% tax · 5.0% vac · 8.0% maint · 8.0% mgmt
Financing live
Cash to close
- Down payment
- $63,750
- Closing costs
- $7,650
- Reserves months
- —
- Total cash needed
- —
Loan-product check · same deal, 3 products live
Conventional
25% down · 7.5% · 30yr
- Down + closing
- —
- Monthly P&I
- —
- Monthly cashflow
- —
- DSCR
- —
- Eligible?
- —
Personal DTI + credit; lowest rate.
DSCR
20% down · 8.5% · 30yr
- Down + closing
- —
- Monthly P&I
- —
- Monthly cashflow
- —
- DSCR
- —
- Eligible?
- —
No personal income docs; deal must DSCR.
Hard money
10% down · 12.0% · 12mo
- Down + closing
- —
- Monthly P&I
- —
- Monthly cashflow
- —
- DSCR
- —
- Eligible?
- —
Short-term bridge; refi at stabilization.
Listing history 20 events
-
2026-06-19days on market $255,000 Active 38 DOM
-
2026-06-18days on market $255,000 Active 37 DOM
-
2026-06-17days on market $255,000 Active 36 DOM
-
2026-06-16days on market $255,000 Active 35 DOM
-
2026-06-15days on market $255,000 Active 34 DOM
-
2026-06-14days on market $255,000 Active 32 DOM
-
2026-06-13pricedays on market $255,000 Active 31 DOM
-
2026-06-10days on market $260,000 Active 29 DOM
-
2026-06-09days on market $260,000 Active 28 DOM
-
2026-06-08days on market $260,000 Active 27 DOM
-
2026-06-07days on market $260,000 Active 26 DOM
-
2026-06-02days on market $260,000 Active 21 DOM
-
2026-06-01days on market $260,000 Active 20 DOM
-
2026-05-31days on market $260,000 Active 19 DOM
-
2026-05-30days on market $260,000 Active 18 DOM
-
2026-05-12$265,000 Active
-
2020-07-27soldstatus $152,000
-
2020-07-22soldstatus $152,000 Sold 257-char remark
Show marketing remark (257 chars)
What a Cute House! There is charm everywhere in this 4-5 bedroom home located on Doty Island. Updates include: furnace, water heater, back covered porch, refinished hardwood floors on the main floor. 1 car garage (wood shake). Some newer windows upstairs.
-
2020-06-07price $149,900 257-char remark
Show marketing remark (257 chars)
What a Cute House! There is charm everywhere in this 4-5 bedroom home located on Doty Island. Updates include: furnace, water heater, back covered porch, refinished hardwood floors on the main floor. 1 car garage (wood shake). Some newer windows upstairs.
-
2020-06-05$154,900 Active 257-char remark
Show marketing remark (257 chars)
What a Cute House! There is charm everywhere in this 4-5 bedroom home located on Doty Island. Updates include: furnace, water heater, back covered porch, refinished hardwood floors on the main floor. 1 car garage (wood shake). Some newer windows upstairs.
ⓘ Source: listings_history table (triggers on properties + properties_extension) + one-shot
backfill from property_details.listing_events for pre-trigger history.
Tax reassessment forecast WI · Partial reset (capped growth)
- Current annual tax
- $3,425 · $285/mo
- Projected year-2 tax
- $4,071 · $339/mo
- Expected delta
- +$646/yr (+$54/mo · 18.9%)
ⓘ Screening estimate from a state-policy table — verify with the county assessor before closing.
Climate risk First Street
- Flood 1/10 Low FEMA zone X (unshaded) · 0% chance over 30 yrs
- Wildfire 1/10 Low
- Heat 2/10 Low 7 d/yr ≥97°F today · 13 d/yr by 30 yrs out
- Wind 2/10 Low
- Air quality 2/10 Low 1 unhealthy d/yr today · 2 by 30 yrs out
Nearby sold comps map
Loading sold comps map…
Walkable amenities ~0.75 mi
Loading nearby amenities…
Taxation est. · year 1
- Rental income
- $22,116
- − Mortgage interest
- −$14,284
- − Property taxes
- −$3,425
- − Insurance
- −$1,275
- − Repairs & maintenance
- −$1,769
- − Management
- −$1,769
- − Depreciation
- −$7,418
- Taxable loss
- −$7,825
- Est. tax savings @ 24.0%
- +$1,878
- After-tax cash flow
- $-1,397/yr
For passive investors: Depreciation is non-cash, so a rental often shows a tax loss while cash-flowing — sheltering income. Rental losses are passive: they offset passive income freely, and up to $25,000/yr can offset ordinary (W-2) income if you actively participate and your MAGI is under $100k (phasing out to $0 by $150k); unused losses carry forward. On sale, claimed depreciation is recaptured at up to 25%, and gains may owe capital-gains tax (a 1031 exchange can defer both). Figures are a year-1 estimate at your 24.0% rate — not tax advice; consult a CPA.
Schools (NCES district)
- District
- Menasha Joint School District
- NCES district ID
- 5509030
- Math proficiency
- 30% ▼ -10.00%
- Reading proficiency
- 24% ▼ -7.00%
- Median HH income
- $44,188
- Composite
- 23.19/100
- National rank
- #7945
- State rank
- #300 of 342 in WI
Livability — Menasha
- Score
- 80/100
- State rank
- #59
- US rank
- #1628
Category grades
Schools grade is shown separately in the Schools card above.
Census & demographics
- Census place
- Menasha, WI
- County
- Winnebago County · 155,689 people
- Metro
- Oshkosh-Neenah, WI
- Population (ZIP)
- 27,312
- Household income
- $69,196
- Rent vs Own
- Severe rent burden
- 636.0
Population outlook (Winnebago County) Hauer SSP2
- Today (2025)
- 175,480 people
- By 2030
- 177,928 · +1.4%
- By 2040
- 180,873 · +3.1%
- By 2050
- 181,302 · +3.3%
- By 2075
- 184,071 · +4.9%
- By 2100
- 175,932 · +0.3%
Race, ethnicity, and origin ACS 2023
- Neighborhood character
- Predominantly White (81%)
- Race & ethnicity
- White 81% Hispanic / Latino 11% Two or more races 8% Asian 2%
- Hispanic origin (detail)
- Mexican 8% Puerto Rican 3%
- Common ancestry
- Romanian 6% Iranian 4% Portuguese 4%
- Foreign-born
- 5% · Canada, China
- Languages at home
- 91% English-only · Spanish 6% Other Asian/Pacific 1%
Political lean MEDSL · Winnebago
- 2024 margin
- Toss-up / Even · D 46.9% · R 51.7% · Other 1.4%
- 2008→2024 swing
- -16.4pp toward R · 2008: 11.7pp · 2024: -4.8pp
- All cycles
- 2024: R+4.8 2020: R+4.0 2016: R+7.4 2012: D+3.8 2008: D+11.7
Not yet ingested
- Civics
- —
Market trends
- HPI YoY
- ▲ 30.18%
- Current HPI
- 446.39
- Rent YoY
- ▲ 4.62%
- Metro
- Oshkosh-Neenah, WI
- State GDP YoY
- ▲ 2.10%
- F500 in state
- 20
Industry mix (Fortune 500 HQ in WI)
| Industry | F500 HQs | Revenue |
|---|---|---|
| Industrial Machinery | 4 | $23B |
|
||
| Industrial Technology | 2 | $36B |
|
||
| Insurance | 1 | $36B |
|
||
| Professional Services | 1 | $19B |
|
||
| Utilities | 1 | $9B |
|
||
| Consumer Goods | 1 | $3B |
|
||
Price history
+71.1% since first listed5 events — show timeline
- 2026-05-12 Listed $265,000 RANW
- 2020-07-27 Sold (Public Records) $152,000 Public Records
- 2020-07-22 Sold (MLS) $152,000 RANW
- 2020-06-07 Price Changed $149,900 RANW
- 2020-06-05 Listed $154,900 RANW
Property tax history
+2.4%/yrLatest (2021): $3,425 · +20.2% YoY. Source: county tax records.
Cash-flow waterfall
monthlySold comps — $/sqft
last 12 mo · ≤1 miLoading sold comps…