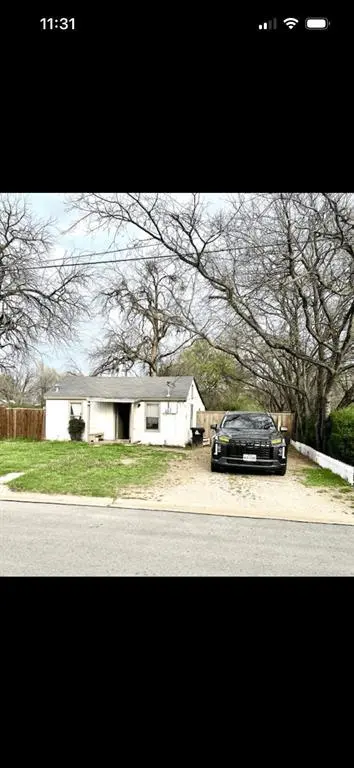
605 S Bradshaw St · Denton, TX
Flood risk 8/10 · Major
- FEMA flood zone
- X (unshaded)
- Chance of flooding over 30 yrs
- 0.99%
- Est. flood insurance / yr
- $507 – $1,088
Fire risk 1/10 · Minimal
- Est. fire insurance / yr
- $1,222 – $2,270
Heat risk 7/10 · Major
- Hot days now (above 110°F)
- 7 days/yr
- Hot days in 30 yrs
- 21 days/yr
Wind risk 4/10 · Minor
- Chance of severe wind over 30 yrs
- 24.0%
Air-quality risk 4/10 · Minor
- Unhealthy air days now
- 4 days/yr
- Unhealthy air days in 30 yrs
- 5 days/yr
Risk factors via First Street. Map © Google.
Why this score? — see what drove the B- grade
The composite is a weighted blend of 9 inputs, each scored 0–100. Each bar is that input's sub-score; the figure is the points it added to the 100-point composite (weight × sub-score).
- Cash flow +25.6/30.0
- ARV discount +15.0/15.0
- DSCR +8.5/10.0
- 1% rule +6.4/10.0
- Livability +4.4/5.0
- Schools +3.5/10.0
- Condition / age +2.5/5.0
- Rent growth +1.7/5.0
- Appreciation +0.0/10.0
$99,000
🖨 Deal sheet (PDF) 📄 Offer letter ✓ Due diligence
Listing remarks
BEST DEAL IN DENTON!!! This cute fixer upper in Denton TX will not last at this price! To be sold as is, and seller to do no repairs. Priced to move! Bring your contractor. BUYER TO VERIFY ALL MEASUREMENTS, ALL SCHOOLS, AND ALL UTILITIES. SELLER IS RELATED TO THE LISTING BROKER
Key facts
- 9,148 sq ft lot
- Built 1947
- Listed 50 days
Property features AI
Finance
- Other: Property type: Residential — Single Family Residence; Parcel number: R33234
- Financial info: Listing terms: Cash or Conventional; Loan type: Treat as clear; No second mortgage indicated
- HOA & community: No association
Exterior
- Parking: Driveway parking
- Utilities: Electricity available; Municipal utility district: No
- Home design: Single-family residence; One story; Residential property, not attached
- Construction: Frame construction; Built in 1947; Preowned
- Exterior features: Lot approximately 0.21 acres (dimensions 63 x 132); Subdivision: H Sisco; Directions: From Sycamore go South on Bradshaw to 605 Bradshaw OR from Wilson St go North on Bradshaw to 605 Bradshaw
Interior
- Kitchen: Gas oven
- Bedrooms: 1 bedroom (Primary bedroom on the main level)
- Bathrooms: 1 full bathroom
- Heating & cooling: Electric cooling; Natural gas heating
- Interior features: High-speed internet available; Three total rooms
Neighborhood map
What this means for you Summary
Snapshot
- This is a 1-bed/1.0-bath single-family listed at $99k.
Deal economics
- At list price, monthly cash flow is $167 ($2k/yr) — positive.
- The deal already cash-flows at list — no discount required.
- Meets the 1% rule at list price ($1k rent vs $99k).
- Recommended offer: $96k (3.0% below list) — sets the bar for market timing.
- Cap rate 9.1% vs local median 3.4% in Denton — top-decile yield for the area; either an underpriced asset or a hidden risk that comps aren't pricing in. Stress-test before assuming the spread holds.
Location & tenants
- Location reads 88/100 on livability (#2 in TX, #210 nationally) — a professional / high-income tenant draw. Strengths: amenities A+, commute A+, housing A+.
- Denton ISD (urban): math 36% / reading 43% proficiency, ranked #383 of 826 in TX (top 46%) — families likely to look elsewhere, expect single-tenant / working-renter base with shorter leases.
- Zoned schools: Rivera El (math 28% / reading 35%, grade F, #2,396 of 4,322 statewide, top 56%, 642 students, 89% FRL) — zoned schools average 89% FRL vs 38% district-wide (51 pts higher); higher-poverty schools than district average — tighter screening recommended.
- Market conditions: Rents falling (-3.4%/yr); 172 active listings in the ZIP; 40 comparable units currently listed for rent nearby; rentals at typical pace (median 21d on market — plan ~3-4 weeks tenant-placement turnaround); 10,531 units permitted in Denton County in 2024 (2,713 in 5+ unit buildings).
Forward outlook
- Local home prices are declining (-3.0%/yr); year-one equity from $684 of loan paydown is wiped out by about $3k of value loss. Plan a longer hold.
- Denton County population projected at +66% by 2050 — long-run rental-demand tailwind backs the buy-and-hold thesis.
Negotiation context
- It's been on market 50 days — a 3% lower offer ($96k) is reasonable based on typical stale-listing flexibility.
Risks & watch-outs
- Watch-outs: flood insurance adds $66/mo; built in 1947 — expect roof / HVAC / electrical / plumbing capex.
- Climate carrying-cost: severe flood risk; extreme-heat days projected 7→21/yr by 2055 (HVAC capex compounding) — expect insurance premiums to compound above CPI over the hold.
Questions for the listing agent
- It's been on market 50 days. Have you received any prior offers? Is the seller open to a 3% concession, seller financing, or rate buy-down credit?
- Built in 1947 — when were the roof, HVAC, electrical panel, plumbing, and water heater last replaced?
- What's the actual annual flood-insurance premium (NFIP or private), and is the property in a SFHA with mandatory coverage?
- Is there a deadline driving the sale (1031 exchange, divorce, estate, relocation)? That informs how much negotiation room exists.
- Schools are B-rated — typically a magnet for longer-tenancy family renters. What's the average tenant stay here, and is there a school-zone premium baked into asking?
- What's the average days-on-market for RENTAL listings here right now (not sales)? A rising rental-DOM trend means longer vacancies and softer asking-rent achievability than the comps imply.
- What's the recent tenant-quality profile in this submarket — average credit score on applications, eviction rate, late-payment / NSF rate, and stable-employment percentage? A property-management company in the area should have these aggregated.
- How much new for-sale + rental construction is in the pipeline within 1–3 miles? Heavy new supply typically softens prices + rents 12–24 months out; constrained supply supports both.
Investment metrics
- 1% rule
- 1.14% ✓
- Cap rate
- 9.12%
- Cash-on-cash
- 10.11%
- DSCR
- 1.45
- GRM
- 7.3
CMA / ARV
- ARV (median comp)
- $189,346
- List price
- $99,000
- Delta
- -47.71%
- Verdict
- UNDERPRICED
- Comps
- 18 within 1.0 mi
Show comp detail 3 sales within ~0.75 mi
| Address | Dist | Beds/Ba | Sqft | Sold | Price | $/sf | Match |
|---|---|---|---|---|---|---|---|
| 927 E Prairie St | 0.08mi | 2/1.0 (+1) | 768 (+14%) | 13mo | $199,000 | $259 | 56 |
| 325 N Wood St | 0.57mi | 1/1.0 | 600 (-11%) | 1mo | $99,900 | $167 | 55 |
| 510 N Bradshaw St | 0.62mi | 2/1.0 (+1) | 640 (-5%) | 7mo | $137,900 | $215 | 52 |
Match score weights: distance 35% · size 25% · config 20% · recency 20%. Top-matched comps best support the ARV.
Projected returns pro-forma
-3.0% appreciation · 0.0% rent growth · sell at horizon
- IRR
- -8.8%
- Equity multiple
- 0.69×
- Total profit
- $-8,667
- Equity at exit
- $14,761
- IRR
- -4.1%
- Equity multiple
- 0.77×
- Total profit
- $-6,472
- Equity at exit
- $8,560
Cash invested: $27,720 (down + closing). Projections, not guarantees.
Landlord ↔ Tenant lean methodology
- Overall (STATE)
- 87 Strongly Landlord-Friendly
- State Texas
- 87 Strongly Landlord-Friendly · R+5
- County
- — inherits STATE
- City
- — inherits STATE
ZIP-level market 76205
- Home prices YoY
- -25.8%
- Rents YoY
- -3.4%
- Active inventory
- 172
- Price-to-rent
- 7.3×
Monthly cashflow live
- Estimated rent
- $1,131 high interval (Pro) →
- Mortgage (P&I)
- −$519
- Tax from tax record
- −$99 /mo · $1,193/yr
- Insurance
- −$41
- Flood insurance flood zone
- −$66 /mo · $798/yr
- HOA
- −$0
- Vacancy / Maint / Mgmt
- −$237
- Net cashflow
- $167
Break-even live
Sensitivity live
| Price | -10% $223 | -5% $195 | +0% $167 | +5% $139 | +10% $111 |
|---|---|---|---|---|---|
| Rent | -10% $78 | -5% $122 | +0% $167 | +5% $212 | +10% $257 |
| Rate | -1.0pp $217 | -0.5pp $192 | base $167 | +0.5pp $142 | +1.0pp $115 |
UW: 25.0% down · 7.5% · 30yr · 1.5% tax · 5.0% vac · 8.0% maint · 8.0% mgmt
Financing live
Cash to close
- Down payment
- $24,750
- Closing costs
- $2,970
- Reserves months
- —
- Total cash needed
- —
Loan-product check · same deal, 3 products live
Conventional
25% down · 7.5% · 30yr
- Down + closing
- —
- Monthly P&I
- —
- Monthly cashflow
- —
- DSCR
- —
- Eligible?
- —
Personal DTI + credit; lowest rate.
DSCR
20% down · 8.5% · 30yr
- Down + closing
- —
- Monthly P&I
- —
- Monthly cashflow
- —
- DSCR
- —
- Eligible?
- —
No personal income docs; deal must DSCR.
Hard money
10% down · 12.0% · 12mo
- Down + closing
- —
- Monthly P&I
- —
- Monthly cashflow
- —
- DSCR
- —
- Eligible?
- —
Short-term bridge; refi at stabilization.
Rent comps 40 comps
| Address | Beds | Baths | Sqft | Rent | $/sqft | DOM | Units | Dist |
|---|---|---|---|---|---|---|---|---|
| 315 S Bradshaw St Denton, TX | 1.0 | 1.0 | 695 | $1,350 | $1.94 | 45d | 1 | 0.19mi |
| 650 E Sycamore St Denton, TX | 3.0 | 1.0–2.5 | 1193 | $2,354 | $1.97 | 12d | 41 | 0.28mi |
| 1029 E Hickory St Unit D Denton, TX | 2.0 | 1.0 | 665 | $1,025 | $1.54 | 21d | 1 | 0.39mi |
| 315 S Locust St Denton, TX | 3.0 | 1.0–2.0 | 847 | $1,267 | $1.49 | 2d | 32 | 0.67mi |
| 2001 Duchess Dr Denton, TX | 1.0–4.0 | 1.0–2.0 | 1040 | $593 | $0.57 | 0d | 12 | 0.71mi |
| 1610 E McKinney St Denton, TX | 2.0 | 1.0–2.0 | 650 | $849 | $1.31 | 0d | 37 | 0.74mi |
| 500 N Bell Ave #202 Denton, TX | 2.0 | 2.0 | 739 | $1,150 | $1.56 | 45d | 1 | 0.78mi |
| 109 E Oak St Denton, TX | 1.0 | 1.0 | 700 | $1,725 | $2.46 | 26d | 1 | 0.79mi |
| 1030 Dallas Dr Denton, TX | 1.0–2.0 | 1.0–2.0 | 773 | $841 | $1.09 | 0d | 35 | 0.81mi |
| 818 Rose St Unit B Denton, TX | 1.0 | 1.0 | 600 | $1,275 | $2.12 | 45d | 1 | 0.87mi |
| 400 Audra Ln Denton, TX | 1.0–2.0 | 1.0–2.0 | 750 | $899 | $1.20 | 0d | 44 | 0.87mi |
| 919 S Carroll Blvd Unit 200 Denton, TX | 2.0 | 1.0 | 750 | $1,295 | $1.73 | 45d | 1 | 0.90mi |
| 1300 Dallas Dr Denton, TX | 1.0–2.0 | 1.0–2.0 | 800 | $824 | $1.03 | 0d | 47 | 0.93mi |
| 1408 Teasley Ln Denton, TX | 1.0–2.0 | 1.0–2.0 | 839 | $823 | $0.98 | 0d | 51 | 0.95mi |
| 524 S Carroll Blvd Denton, TX | 1.0–2.0 | 1.0–2.0 | 722 | $950 | $1.31 | 16d | 1 | 0.95mi |
| 417 W Mulberry St Denton, TX | 1.0 | 1.0 | 690 | $980 | $1.42 | 4d | 1 | 0.96mi |
| 521 Texas St #2 Denton, TX | — | 1.0 | 450 | $1,450 | $3.22 | 45d | 1 | 0.98mi |
| 301 Withers St Denton, TX | 2.0 | 1.0 | 600 | $1,325 | $2.21 | 45d | 1 | 0.99mi |
| 630 Schmitz Ave Unit 3 Denton, TX | — | 1.0 | 510 | $795 | $1.56 | 26d | 1 | 0.99mi |
| 2420 E McKinney St Denton, TX | 1.0–4.0 | 1.0–2.0 | 1148 | $999 | $0.87 | 0d | 1 | 1.00mi |
| 515 W Mulberry St Unit 10 Denton, TX | 1.0 | 1.0 | 625 | $1,100 | $1.76 | 7d | 1 | 1.02mi |
| 1112 Frame St Denton, TX | 1.0 | 1.0 | 675 | $1,150 | $1.70 | 45d | 1 | 1.04mi |
| 603 Eagle Dr Denton, TX | 1.0 | 1.0 | 550 | $948 | $1.72 | 26d | 7 | 1.08mi |
| 1939 Colorado Blvd Denton, TX | 1.0–2.0 | 1.0–2.0 | 843 | $816 | $0.97 | 0d | 25 | 1.09mi |
| 1126 N Bell Ave Denton, TX | 1.0 | 1.0 | 700 | $1,060 | $1.51 | 45d | 1 | 1.10mi |
| 1126 N Bell Ave Unit B3 Denton, TX | 1.0 | 1.0 | 600 | $950 | $1.58 | 45d | 1 | 1.10mi |
| 712 W Sycamore St Apt 3 Denton, TX | 1.0 | 1.0 | 522 | $875 | $1.68 | 7d | 1 | 1.12mi |
| 713 W Mulberry St Unit 8 Denton, TX | 1.0 | 1.0 | 522 | $999 | $1.91 | 12d | 1 | 1.12mi |
| 425 Bernard St Denton, TX | 3.0 | 1.0–2.0 | 676 | $1,192 | $1.76 | 0d | 101 | 1.14mi |
| 715 W Hickory St Unit A3 Denton, TX | 1.0 | 1.0 | 600 | $950 | $1.58 | 14d | 1 | 1.15mi |
| 410 W Congress St Denton, TX | 1.0 | 1.0 | 480 | $995 | $2.07 | 45d | 1 | 1.16mi |
| 500 S Interstate 35 E Denton, TX | 1.0–3.0 | 1.0–2.0 | 984 | $993 | $1.01 | 0d | 37 | 1.16mi |
| 1267 Mingo Rd Denton, TX | 1.0 | 1.0 | 625 | $863 | $1.38 | 45d | 1 | 1.18mi |
| 315 Bernard St Denton, TX | — | 1.0 | 410 | $750 | $1.83 | 26d | 1 | 1.19mi |
| 1710 Sam Bass Blvd Denton, TX | 1.0–2.0 | 1.0–2.0 | 823 | $905 | $1.10 | 0d | 27 | 1.26mi |
| 930 W Prairie St Unit 4 Denton, TX | 1.0 | 1.0 | 594 | $1,075 | $1.81 | 7d | 1 | 1.27mi |
| 908 Greenlee St Denton, TX | 1.0 | 1.0 | 520 | $1,000 | $1.92 | 45d | 1 | 1.31mi |
| 924 Anna St Denton, TX | 1.0 | 1.0 | 658 | $1,149 | $1.75 | 45d | 1 | 1.32mi |
| 1227 Peak St Unit 908 Denton, TX | 1.0 | 1.0 | 520 | $1,000 | $1.92 | 45d | 1 | 1.33mi |
| 1005 W Hickory St Unit W9 Denton, TX | 1.0 | 1.0 | 450 | $950 | $2.11 | 45d | 1 | 1.33mi |
Listing history 18 events
-
2026-06-21days on market $99,000 Active 50 DOM
-
2026-06-18days on market $99,000 Active 47 DOM
-
2026-06-17days on market $99,000 Active 46 DOM
-
2026-06-16days on market $99,000 Active 45 DOM
-
2026-06-15days on market $99,000 Active 44 DOM
-
2026-06-13days on market $99,000 Active 42 DOM
-
2026-06-09days on market $99,000 Active 38 DOM
-
2026-06-08days on market $99,000 Active 37 DOM
-
2026-06-07days on market $99,000 Active 36 DOM
-
2026-06-04days on market $99,000 Active 33 DOM
-
2026-06-03days on market $99,000 Active 32 DOM
-
2026-06-02days on market $99,000 Active 31 DOM
-
2026-06-01days on market $99,000 Active 30 DOM
-
2026-05-31days on market $99,000 Active 29 DOM
-
2026-05-12price $99,000 281-char remark
-
2026-05-02$114,000 Active 281-char remark
-
2026-04-24soldstatus
-
1999-03-29soldstatus
ⓘ Source: listings_history table (triggers on properties + properties_extension) + one-shot
backfill from property_details.listing_events for pre-trigger history.
Tax reassessment forecast TX · Resets to sale price
- Current annual tax
- $1,193 · $99/mo
- Projected year-2 tax
- $1,812 · $151/mo
- Expected delta
- +$619/yr (+$52/mo · 51.9%)
ⓘ Screening estimate from a state-policy table — verify with the county assessor before closing.
Climate risk First Street
- Flood 8/10 Severe FEMA zone X (unshaded) · 99% chance over 30 yrs
- Wildfire 1/10 Low
- Heat 7/10 Severe 7 d/yr ≥110°F today · 21 d/yr by 30 yrs out
- Wind 4/10 Moderate 24% chance of damaging wind over 30 yrs
- Air quality 4/10 Moderate 4 unhealthy d/yr today · 5 by 30 yrs out
Nearby sold comps map
Loading sold comps map…
Walkable amenities ~0.75 mi
Loading nearby amenities…
Taxation est. · year 1
- Rental income
- $13,571
- − Mortgage interest
- −$5,546
- − Property taxes
- −$1,193
- − Insurance
- −$1,292
- − Repairs & maintenance
- −$1,086
- − Management
- −$1,086
- − Depreciation
- −$2,880
- Taxable income
- $489
- Est. tax owed @ 24.0%
- −$117
- After-tax cash flow
- $1,889/yr
For passive investors: Depreciation is non-cash, so a rental often shows a tax loss while cash-flowing — sheltering income. Rental losses are passive: they offset passive income freely, and up to $25,000/yr can offset ordinary (W-2) income if you actively participate and your MAGI is under $100k (phasing out to $0 by $150k); unused losses carry forward. On sale, claimed depreciation is recaptured at up to 25%, and gains may owe capital-gains tax (a 1031 exchange can defer both). Figures are a year-1 estimate at your 24.0% rate — not tax advice; consult a CPA.
Schools (NCES district)
- District
- Denton ISD
- NCES district ID
- 4816740
- Math proficiency
- 36% ▼ -18.00%
- Reading proficiency
- 43% ▼ -9.00%
- Median HH income
- $58,913
- Composite
- 34.91/100
- National rank
- #5075
- State rank
- #383 of 826 in TX
Livability — Denton
- Score
- 88/100
- State rank
- #2
- US rank
- #210
Category grades
Schools grade is shown separately in the Schools card above.
Census & demographics
- Census place
- Denton, TX
- County
- Denton County · 901,654 people
- City population
- 127,990
- Metro
- Dallas-Fort Worth-Arlington, TX
- Population (ZIP)
- 18,978
- Household income
- $68,600
- Rent vs Own
- Severe rent burden
- 1268.0
Population outlook (Denton County) Hauer SSP2
- Today (2025)
- 1,053,010 people
- By 2030
- 1,192,269 · +13.2%
- By 2040
- 1,472,920 · +39.9%
- By 2050
- 1,746,506 · +65.9%
- By 2075
- 2,358,497 · +124.0%
- By 2100
- 2,779,183 · +163.9%
Race, ethnicity, and origin ACS 2023
- Neighborhood character
- Diverse neighborhood (Simpson 0.67)
- Race & ethnicity
- White 49% Hispanic / Latino 26% Two or more races 18% Black 17% Asian 2%
- Hispanic origin (detail)
- Mexican 24%
- Common ancestry
- Italian 3% Slovak 2% Lithuanian 2%
- Foreign-born
- 17% · Canada, China
- Languages at home
- 76% English-only · Spanish 18% Arabic 3% Other Indo-European 1%
Political lean MEDSL · Denton
- 2024 margin
- R (+13.2) · D 42.7% · R 55.8% · Other 1.5%
- 2008→2024 swing
- +11.0pp toward D · 2008: -24.2pp · 2024: -13.2pp
- All cycles
- 2024: R+13.2 2020: R+8.1 2016: R+20.2 2012: R+31.7 2008: R+24.2
Not yet ingested
- Civics
- —
Market trends
- HPI YoY
- ▼ -101.13%
- Current HPI
- 290.7883
- Rent YoY
- ▼ -3.40%
- Metro
- Dallas-Fort Worth-Arlington, TX
- State GDP YoY
- ▲ 3.95%
- F500 in state
- 110
Industry mix (Fortune 500 HQ in TX)
| Industry | F500 HQs | Revenue |
|---|---|---|
| Energy | 16 | $1,198B |
|
||
| Technology | 5 | $198B |
|
||
| Engineering / Construction | 4 | $72B |
|
||
| Energy Services | 3 | $60B |
|
||
| Utilities | 3 | $41B |
|
||
| Healthcare | 2 | $330B |
|
||
Price history
-13.2% since first listed4 events — show timeline
- 2026-05-12 Price Changed $99,000 NTREIS
- 2026-05-02 Listed $114,000 NTREIS
- 2026-04-24 Sold (Public Records) — Public Records
- 1999-03-29 Sold (Public Records) — Public Records
Property tax history
+3.9%/yrLatest (2025): $1,193 · +23.6% YoY. Source: county tax records.
Cash-flow waterfall
monthlySold comps — $/sqft
last 12 mo · ≤1 miLoading sold comps…