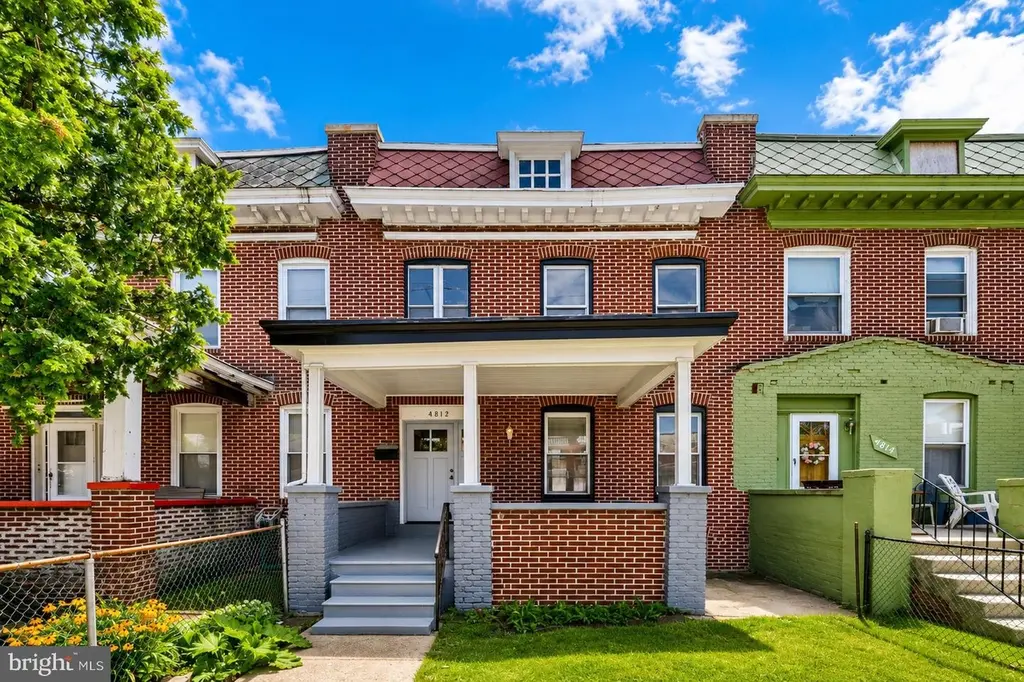
4812 Reisterstown Rd · Baltimore, MD
Flood risk 1/10 · Minimal
- FEMA flood zone
- X (unshaded)
- Chance of flooding over 30 yrs
- 0.0%
- Est. flood insurance / yr
- $473 – $860
Fire risk 1/10 · Minimal
- Est. fire insurance / yr
- $755 – $1,403
Heat risk 7/10 · Major
- Hot days now (above 104°F)
- 7 days/yr
- Hot days in 30 yrs
- 15 days/yr
Wind risk 4/10 · Minor
- Chance of severe wind over 30 yrs
- 21.0%
Air-quality risk 3/10 · Minor
- Unhealthy air days now
- 3 days/yr
- Unhealthy air days in 30 yrs
- 4 days/yr
Risk factors via First Street. Map © Google.
Why this score? — see what drove the C+ grade
The composite is a weighted blend of 9 inputs, each scored 0–100. Each bar is that input's sub-score; the figure is the points it added to the 100-point composite (weight × sub-score).
- Cash flow +23.4/30.0
- ARV discount +13.5/15.0
- DSCR +7.5/10.0
- 1% rule +6.3/10.0
- Livability +3.8/5.0
- Rent growth +3.1/5.0
- Condition / age +2.5/5.0
- Schools +1.0/10.0
- Appreciation +0.0/10.0
$185,000
🖨 Deal sheet (PDF) 📄 Offer letter ✓ Due diligence
Listing remarks MLS
Great Investment Opportunity This 4 Bedroom 1.5 Bathroom Property is Located in West Baltimore. The Property Was Recently Rented To A Section 8 Tenant For The Past 9 Years. The Property Has A Current Rental License. The Property Has Been Professionally Managed For Those 9 Years. The Basement Is Unfinished Space. Come And Improve That Space And Add Value And Income To The Property. This Property Does Not Need A Lot Of Work, Come And See For Your Self. This Would Be A Great House For Your First Time Investor.
Key facts
- Quartz countertops
- Unfinished basement
- Modern kitchen
Tags
Property features AI
Exterior
- Parking: On-street parking
- Utilities: Public water; Public sewer
- Home design: Interior townhouse/rowhouse; Fee simple ownership
- Construction: Brick construction; Other foundation type; Above-grade and below-grade other structures; Year built per assessor
- Exterior features: No tidal water
Interior
- Bedrooms: Four bedrooms on the first upper level
- Bathrooms: One full bathroom (all upper levels); One half bathroom on the main level
- Heating & cooling: Forced air heating (natural gas); Central air conditioning (electric); Natural gas hot water
- Interior features: Assessor-reported living area; Basement present (other type)
Neighborhood map
What this means for you Summary
Snapshot
- This is a 4-bed/1.5-bath townhouse listed at $185k.
Deal economics
- At list price, monthly cash flow is $342 ($4k/yr) — positive.
- The deal already cash-flows at list — no discount required.
- Meets the 1% rule at list price ($2k rent vs $185k).
- Cap rate 8.5% vs local median 6.0% in Baltimore — top-decile yield for the area; either an underpriced asset or a hidden risk that comps aren't pricing in. Stress-test before assuming the spread holds.
Location & tenants
- Location reads 76/100 on livability (#90 in MD, #3,396 nationally) — a middle-class / working-renter tenant base. Strengths: amenities A+, commute A+, housing A+; Watch: crime F.
- Baltimore City Public Schools (urban): math 7% / reading 16% proficiency, ranked #24 of 24 in MD (top 100%) — low school quality limits family demand, transient renter base, plan for 1-2y turnover; 79% free/reduced lunch — lower-income household profile, screen leases tightly.
- Zoned schools: Pimlico Elementary/Middle (math 0% / reading 11%, grade F, #759 of 860 statewide, top 88%, 741 students, 84% FRL, charter); Vanguard Collegiate Middle (math 3% / reading 15%, grade F, #212 of 225 statewide, top 95%, 343 students, 84% FRL); Baltimore Polytechnic Institute (math 71% / reading 84%, grade A-, #22 of 222 statewide, top 10%, 1,555 students, 43% FRL).
- Zoned-school proficiency averages 31% at this address vs 12% district-wide (+19 pts) — the actual schools serving this property are materially stronger than the Baltimore City Public Schools average implies; a family-tenant draw the district grade alone would hide.
- Market conditions: Rents rising (+2.4%/yr); 354 active listings in the ZIP; 18 comparable units currently listed for rent nearby; rentals at typical pace (median 26d on market — plan ~3-4 weeks tenant-placement turnaround); 44% of comp listings sitting > 30 days — soft ceiling on asking rent; 1,273 units permitted in Baltimore city in 2024 (1,104 in 5+ unit buildings).
- At $2,092/mo this rent would consume 49% of the median local household income ($52k/yr) (locally 3644% of renters already pay >50% of income on rent) — very limited rent-growth headroom before tenants either downsize or default.
Forward outlook
- Local home prices are declining (-3.0%/yr); year-one equity from $1k of loan paydown is wiped out by about $6k of value loss. Plan a longer hold.
- Baltimore County population projected to shrink 4% by 2050 — rents likely to lag national; underwrite the cash flow, not the appreciation.
Negotiation context
- Only 9 days on market — expect competitive offers; lowballing is unlikely to land.
- 9 sale attempts since 22y ago with the ask held roughly flat each time — persistent listings suggest the price (not the market) is what's stuck; bring a comps-based counter.
- Current owner paid $115k; list at $185k implies a 61% gain — meaningful room to come down on a strong offer.
Risks & watch-outs
- Watch-outs: built in 1923 — expect roof / HVAC / electrical / plumbing capex.
- Climate carrying-cost: extreme-heat days projected 7→15/yr by 2055 (HVAC capex compounding) — expect insurance premiums to compound above CPI over the hold.
Questions for the listing agent
- Built in 1923 — when were the roof, HVAC, electrical panel, plumbing, and water heater last replaced?
- Is there a deadline driving the sale (1031 exchange, divorce, estate, relocation)? That informs how much negotiation room exists.
- Schools are D-rated, which usually means shorter tenancies and higher turnover. Who's the typical renter profile here, and what's been the actual vacancy rate?
- Crime grade is F in this area — have there been break-ins, vandalism, or insurance claims at this property in the last 3 years? What carrier currently insures it and at what premium?
- What's the average days-on-market for RENTAL listings here right now (not sales)? A rising rental-DOM trend means longer vacancies and softer asking-rent achievability than the comps imply.
- What's the recent tenant-quality profile in this submarket — average credit score on applications, eviction rate, late-payment / NSF rate, and stable-employment percentage? A property-management company in the area should have these aggregated.
- How much new for-sale + rental construction is in the pipeline within 1–3 miles? Heavy new supply typically softens prices + rents 12–24 months out; constrained supply supports both.
Investment metrics
- 1% rule
- 1.13% ✓
- Cap rate
- 8.51%
- Cash-on-cash
- 7.93%
- DSCR
- 1.35
- GRM
- 7.4
CMA / ARV
- ARV (on-the-fly)
- $213,600
- Comps found
- 12
Show comp detail 12 sales within ~0.75 mi
| Address | Dist | Beds/Ba | Sqft | Sold | Price | $/sf | Match |
|---|---|---|---|---|---|---|---|
| 3716 Beehler Ave | 0.08mi | 4/4.0 | 1,445 (+2%) | 3mo | $265,000 | $183 | 82 |
| 3223 Spaulding Ave | 0.39mi | 4/2.0 | 1,500 (+5%) | 0mo | $219,900 | $147 | 70 |
| 4912 Palmer Ave | 0.47mi | 3/2.0 (-1) | 1,400 (-2%) | 1mo | $60,000 | $43 | 68 |
| 4911 Queensberry Ave | 0.58mi | 4/1.5 | 1,390 (-2%) | 2mo | $155,000 | $112 | 67 |
| 4027 Annellen Rd | 0.73mi | 4/2.0 | 1,452 (+2%) | 3mo | $220,900 | $152 | 58 |
| 2523 Boarman Ave | 0.69mi | 3/1.0 (-1) | 1,450 (+2%) | 3mo | $82,500 | $57 | 55 |
| 4903 Chalgrove Ave | 0.62mi | 3/2.0 (-1) | 1,536 (+8%) | 2mo | $187,000 | $122 | 50 |
| 3951 Boarman Ave | 0.61mi | 4/2.5 | 1,588 (+12%) | 2mo | $249,000 | $157 | 47 |
| 3911 Bareva Rd | 0.60mi | 4/2.0 | 1,620 (+14%) | 0mo | $112,100 | $69 | 47 |
| 5424 Jonquil Ave | 0.71mi | 4/3.5 | 1,332 (-6%) | 2mo | $200,000 | $150 | 47 |
| 4041 W Cold Spring Ln | 0.70mi | 3/2.5 (-1) | 1,310 (-8%) | 1mo | $239,900 | $183 | 45 |
| 3916 Hayward Ave | 0.55mi | 3/2.5 (-1) | 1,248 (-12%) | 3mo | $237,375 | $190 | 42 |
Match score weights: distance 35% · size 25% · config 20% · recency 20%. Top-matched comps best support the ARV.
Projected returns pro-forma
-3.0% appreciation · 2.41% rent growth · sell at horizon
- IRR
- -4.9%
- Equity multiple
- 0.82×
- Total profit
- $-9,351
- Equity at exit
- $27,584
- IRR
- 4.1%
- Equity multiple
- 1.29×
- Total profit
- $15,143
- Equity at exit
- $15,995
Cash invested: $51,800 (down + closing). Projections, not guarantees.
Landlord ↔ Tenant lean methodology
- Overall (CITY)
- 12 Strongly Tenant-Friendly
- State Maryland
- 27 Tenant-Leaning · D+14
- County
- — inherits STATE
- City Baltimore
- 12 Strongly Tenant-Friendly · D+58
ZIP-level market 21215
- Rents YoY
- 2.4%
- Active inventory
- 354
- Price-to-rent
- 7.4×
Monthly cashflow live
- Estimated rent
- $2,092 high interval (Pro) →
- Mortgage (P&I)
- −$970
- Tax from tax record
- −$263 /mo · $3,154/yr
- Insurance
- −$77
- HOA
- −$0
- Vacancy / Maint / Mgmt
- −$439
- Net cashflow
- $342
Break-even live
Sensitivity live
| Price | -10% $447 | -5% $395 | +0% $342 | +5% $290 | +10% $238 |
|---|---|---|---|---|---|
| Rent | -10% $177 | -5% $260 | +0% $342 | +5% $425 | +10% $508 |
| Rate | -1.0pp $436 | -0.5pp $389 | base $342 | +0.5pp $295 | +1.0pp $246 |
UW: 25.0% down · 7.5% · 30yr · 1.5% tax · 5.0% vac · 8.0% maint · 8.0% mgmt
Financing live
Cash to close
- Down payment
- $46,250
- Closing costs
- $5,550
- Reserves months
- —
- Total cash needed
- —
Loan-product check · same deal, 3 products live
Conventional
25% down · 7.5% · 30yr
- Down + closing
- —
- Monthly P&I
- —
- Monthly cashflow
- —
- DSCR
- —
- Eligible?
- —
Personal DTI + credit; lowest rate.
DSCR
20% down · 8.5% · 30yr
- Down + closing
- —
- Monthly P&I
- —
- Monthly cashflow
- —
- DSCR
- —
- Eligible?
- —
No personal income docs; deal must DSCR.
Hard money
10% down · 12.0% · 12mo
- Down + closing
- —
- Monthly P&I
- —
- Monthly cashflow
- —
- DSCR
- —
- Eligible?
- —
Short-term bridge; refi at stabilization.
Rent comps 18 comps
| Address | Beds | Baths | Sqft | Rent | $/sqft | DOM | Units | Dist |
|---|---|---|---|---|---|---|---|---|
| 3784 Columbus Dr Baltimore, MD | 4.0 | 2.0 | 1250 | $2,200 | $1.76 | 26d | 1 | 0.22mi |
| 4230 Towanda Ave Baltimore, MD | 3.0 | 2.0 | 1400 | $1,800 | $1.29 | 20d | 1 | 0.59mi |
| 5306 Ethelbert Ave Baltimore, MD | 5.0 | 2.5 | 1510 | $3,000 | $1.99 | 6d | 1 | 0.64mi |
| 5301 Maple Ave Baltimore, MD | 3.0 | 1.0 | 960 | $1,700 | $1.77 | 45d | 1 | 0.66mi |
| 2915 Oakford Ave Baltimore, MD | 3.0 | 2.0 | 1102 | $1,600 | $1.45 | 20d | 1 | 0.67mi |
| 4037 Cedardale Rd Baltimore, MD | 5.0 | 3.0 | 1500 | $2,800 | $1.87 | 17d | 1 | 0.68mi |
| 5115 Pembridge Ave Baltimore, MD | 3.0 | 2.0 | 1088 | $2,150 | $1.98 | 45d | 1 | 0.69mi |
| 2527 W Cold Spring Ln Baltimore, MD | 3.0 | 2.0 | 1152 | $1,695 | $1.47 | 0d | 1 | 0.70mi |
| 2619 Loyola Northway Baltimore, MD | 3.0 | 2.0 | 1400 | $1,995 | $1.43 | 26d | 1 | 0.75mi |
| 2454 W Cold Spring Ln Baltimore, MD | 3.0 | 1.0 | 1200 | $1,650 | $1.38 | 26d | 1 | 0.81mi |
| 2415 Loyola Southway Baltimore, MD | 3.0 | 1.5 | 1200 | $2,033 | $1.69 | 45d | 1 | 0.97mi |
| 2530 Edgecombe Cir N Baltimore, MD | 2.0–3.0 | 1.0 | 920 | $1,325 | $1.44 | 4d | 4 | 0.98mi |
| 3912 Mortimer Ave Baltimore, MD | 3.0 | 2.0 | 1204 | $2,723 | $2.26 | 45d | 1 | 1.00mi |
| 3204 Sequoia Ave Baltimore, MD | 4.0 | 2.5 | 1791 | $2,600 | $1.45 | 45d | 1 | 1.03mi |
| 3822 Pall Mall Rd Baltimore, MD | 3.0 | 1.5 | 1320 | $1,875 | $1.42 | 45d | 1 | 1.07mi |
| 3727 Milford Ave Gwynn Oak, MD | 3.0 | 1.0 | 900 | $1,450 | $1.61 | 45d | 1 | 1.25mi |
| 3601 Howard Park Ave Unit 2 Baltimore, MD | 3.0 | 1.0 | 1000 | $1,650 | $1.65 | 45d | 1 | 1.33mi |
| 2001 W Cold Spring Ln Baltimore, MD | 1.0–3.0 | 1.0–2.0 | 1133 | $3,300 | $2.91 | 0d | 27 | 1.42mi |
Listing history 7 events
-
2026-06-21days on market $185,000 Active 9 DOM
-
2026-06-18days on market $185,000 Active 6 DOM
-
2026-06-17days on market $185,000 Active 5 DOM
-
2026-06-16days on market $185,000 Active 4 DOM
-
2026-06-15days on market $185,000 Active 3 DOM
-
2026-06-13remarks 693-char remark
-
2026-06-13$185,000 Active 1 DOM
ⓘ Source: listings_history table (triggers on properties + properties_extension) + one-shot
backfill from property_details.listing_events for pre-trigger history.
Tax reassessment forecast MD · Partial reset (capped growth)
- Current annual tax
- $3,154 · $263/mo
- Projected year-2 tax
- $3,154 · $263/mo
- Expected delta
- $0/yr ($0/mo · 0.0%)
ⓘ Screening estimate from a state-policy table — verify with the county assessor before closing.
Climate risk First Street
- Flood 1/10 Low FEMA zone X (unshaded) · 0% chance over 30 yrs
- Wildfire 1/10 Low
- Heat 7/10 Severe 7 d/yr ≥104°F today · 15 d/yr by 30 yrs out
- Wind 4/10 Moderate 21% chance of damaging wind over 30 yrs
- Air quality 3/10 Moderate 3 unhealthy d/yr today · 4 by 30 yrs out
Nearby sold comps map
Loading sold comps map…
Walkable amenities ~0.75 mi
Loading nearby amenities…
Taxation est. · year 1
- Rental income
- $25,102
- − Mortgage interest
- −$10,363
- − Property taxes
- −$3,154
- − Insurance
- −$925
- − Repairs & maintenance
- −$2,008
- − Management
- −$2,008
- − Depreciation
- −$5,382
- Taxable income
- $1,262
- Est. tax owed @ 24.0%
- −$303
- After-tax cash flow
- $3,807/yr
For passive investors: Depreciation is non-cash, so a rental often shows a tax loss while cash-flowing — sheltering income. Rental losses are passive: they offset passive income freely, and up to $25,000/yr can offset ordinary (W-2) income if you actively participate and your MAGI is under $100k (phasing out to $0 by $150k); unused losses carry forward. On sale, claimed depreciation is recaptured at up to 25%, and gains may owe capital-gains tax (a 1031 exchange can defer both). Figures are a year-1 estimate at your 24.0% rate — not tax advice; consult a CPA.
Schools (NCES district)
- District
- Baltimore City Public Schools
- NCES district ID
- 2400090
- Math proficiency
- 7% ▼ -9.00%
- Reading proficiency
- 16% ▼ -5.00%
- Median HH income
- $42,108
- Composite
- 10.08/100
- National rank
- #9805
- State rank
- #24 of 24 in MD
Livability — Baltimore
- Score
- 76/100
- State rank
- #90
- US rank
- #3396
Category grades
Schools grade is shown separately in the Schools card above.
Census & demographics
- Census place
- Baltimore, MD
- County
- Baltimore City · 558,601 people
- City population
- 588,727
- Metro
- Baltimore-Columbia-Towson, MD
- Population (ZIP)
- 52,229
- Household income
- $51,587
- Rent vs Own
- Severe rent burden
- 3644.0
Population outlook (Baltimore County) Hauer SSP2
- Today (2025)
- 624,249 people
- By 2030
- 621,541 · -0.4%
- By 2040
- 609,756 · -2.3%
- By 2050
- 597,249 · -4.3%
- By 2075
- 552,236 · -11.5%
- By 2100
- 513,934 · -17.7%
Race, ethnicity, and origin ACS 2023
- Neighborhood character
- Predominantly Black (73%)
- Race & ethnicity
- Black 73% White 17% Hispanic / Latino 5% Two or more races 4% Asian 1%
- Common ancestry
- Scotch-Irish 2% Romanian 2% Italian 1%
- Foreign-born
- 9% · Canada, South Korea
- Languages at home
- 91% English-only · Spanish 4% French/Haitian/Cajun 1% Other Indo-European 1%
Political lean MEDSL · Baltimore
- 2024 margin
- Solid D (+73.0) · D 85.2% · R 12.2% · Other 2.6%
- 2008→2024 swing
- -2.5pp toward R · 2008: 75.5pp · 2024: 73.0pp
- All cycles
- 2024: D+73.0 2020: D+76.6 2016: D+74.6 2012: D+76.4 2008: D+75.5
Not yet ingested
- Civics
- —
Market trends
- HPI YoY
- ▼ -318.58%
- Current HPI
- 291.4926
- Rent YoY
- ▲ 2.41%
- Metro
- Baltimore-Columbia-Towson, MD
- State GDP YoY
- ▲ 2.97%
- F500 in state
- 12
Industry mix (Fortune 500 HQ in MD)
| Industry | F500 HQs | Revenue |
|---|---|---|
| Aerospace / Defense | 1 | $71B |
|
||
| Utilities | 1 | $25B |
|
||
| Hotels | 1 | $24B |
|
||
| Consumer Goods | 1 | $7B |
|
||
| Real Estate | 1 | $6B |
|
||
| Chemicals | 1 | $2B |
|
||
Price history
+270.0% since first listed29 events — show timeline
- 2026-06-12 Listed $185,000 BRIGHT MLS
- 2025-04-23 Sold (Public Records) $115,000 Public Records
- 2025-01-31 Sold (MLS) $115,000 BRIGHT MLS
- 2025-01-15 Pending — BRIGHT MLS
- 2024-12-27 Listed $115,000 BRIGHT MLS
- 2018-10-11 Pending — BRIGHT MLS
- 2018-10-11 Listing Removed — BRIGHT MLS
- 2018-09-24 Listed $80,000 BRIGHT MLS
- 2016-02-01 Sold (Public Records) $28,000 Public Records
- 2016-01-12 Delisted — MRIS
- 2015-12-31 Sold (MLS) $28,000 BRIGHT MLS
- 2015-12-31 Sold (MLS) $28,000 MRIS
- 2015-12-03 Pending — MRIS
- 2015-11-30 Listing Removed — BRIGHT MLS
- 2015-05-21 Relisted — MRIS
- 2015-01-26 Price Changed $43,000 MRIS
- 2014-11-21 Pending — MRIS
- 2014-11-13 Listed $25,000 MRIS
- 2014-11-13 Listed $43,000 BRIGHT MLS
- 2007-12-31 Sold (MLS) $39,900 MRIS
- 2007-11-29 Delisted — MRIS
- 2007-10-23 Listed $39,900 MRIS
- 2005-11-28 Sold (Public Records) $72,500 Public Records
- 2005-09-23 Delisted — MRIS
- 2005-04-22 Listed — MRIS
- 2004-05-16 Sold (MLS) $27,000 MRIS
- 2004-04-13 Delisted — MRIS
- 2004-03-27 Listed $24,900 MRIS
- 2000-10-05 Sold (Public Records) $50,000 Public Records
Property tax history
+4.7%/yrLatest (2025): $3,154 · +5.6% YoY. Source: county tax records.
Cash-flow waterfall
monthlySold comps — $/sqft
last 12 mo · ≤1 miLoading sold comps…