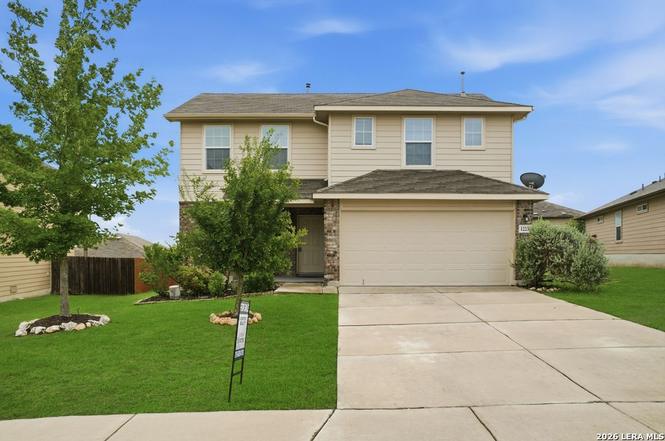
12236 Bening Vly · Schertz, TX
Flood risk 1/10 · Minimal
- FEMA flood zone
- X (unshaded)
- Chance of flooding over 30 yrs
- 0.0%
- Est. flood insurance / yr
- $507 – $1,088
Fire risk 5/10 · Moderate
- Est. fire insurance / yr
- $1,222 – $2,270
Heat risk 8/10 · Major
- Hot days now (above 108°F)
- 7 days/yr
- Hot days in 30 yrs
- 21 days/yr
Wind risk 8/10 · Major
- Chance of severe wind over 30 yrs
- 80.0%
Air-quality risk 1/10 · Minimal
- Unhealthy air days now
- 0 days/yr
- Unhealthy air days in 30 yrs
- 0 days/yr
Risk factors via First Street. Map © Google.
Why this score? — see what drove the D+ grade
The composite is a weighted blend of 9 inputs, each scored 0–100. Each bar is that input's sub-score; the figure is the points it added to the 100-point composite (weight × sub-score).
- ARV discount +15.0/15.0
- Cash flow +12.2/30.0
- Schools +4.4/10.0
- Livability +3.7/5.0
- DSCR +3.6/10.0
- 1% rule +3.3/10.0
- Condition / age +2.5/5.0
- Rent growth +1.8/5.0
- Appreciation +0.0/10.0
$282,000
🖨 Deal sheet 📄 Offer letter ✓ Due diligence
Listing remarks
This beautifully maintained house features * * four bedrooms * * and * * two and a half baths * * , complemented by an * * open floor plan * * that is ideal for entertaining. The entire first floor is carpet-free, enhancing both style and ease of maintenance. The * * master suite is conveniently located on the main floor * * , while the additional bedrooms are situated upstairs, providing added privacy. Enjoy outdoor living with a charming * * covered patio * * , perfect for relaxation or hosting gatherings. The property is conveniently located for quick access to major roads, highways, shopping, and dining. Additionally, the * * seller is willing to contribute to some cl
Key facts
- Open floor plan
- Covered patio
- 7,666 sq ft lot
Tags
Property features AI
Finance
- Other: Subdivision: Rhine Valley
- HOA & community: Mandatory HOA; Quarterly HOA fee; HOA transfer fee applies; Neighborhood amenities include park/playground and jogging trails
Exterior
- Parking: 2-car garage
- Utilities: Water service: SAWS; Sewer service: SAWS; Gas supplier: CPS; Electric supplier: CPS
- Home design: South-facing; Pre-owned home; Recent rehab
- Construction: Brick and siding exterior; Slab foundation; Composition roof; Built approximately 11 years ago; Built by D.R. Horton
- Exterior features: Covered patio; Patio slab; Privacy fence; Double-pane windows
Interior
- Kitchen: Eat-in kitchen; Breakfast bar; Walk-in pantry
- Bedrooms: Primary bedroom on lower level (16 x 15); Bedroom 2 (13 x 12); Bedroom 3 (12 x 12); Bedroom 4 (12 x 11)
- Flooring: Carpeting; Ceramic tile floors
- Bathrooms: 2 full bathrooms; 1 half bathroom; Primary bathroom with separate tub and shower and double vanity
- Heating & cooling: Central heating (electric); Central air conditioning
- Interior features: Ceiling fans; Open floor plan; Cable TV available; High speed internet; All window coverings remain; Walk-in closets
- Laundry & utility: Washer connection; Dryer connection; Laundry on main level
Neighborhood map
What this means for you Summary
Snapshot
- This is a 4-bed/2.5-bath single-family listed at $282k.
Deal economics
- At list price, monthly cash flow is $-54 ($-654/yr) — negative.
- To cash-flow at today's rent, offer at most $272k (3.4% below list).
- To meet the 1% rule (rent ≥ 1% of price), the offer needs to be $233k (17.4% below list).
- Recommended offer: $233k (17.4% below list) — sets the bar for 1% rule.
- Cap rate 6.1% vs local median 2.8% in Schertz — top-decile yield for the area; either an underpriced asset or a hidden risk that comps aren't pricing in. Stress-test before assuming the spread holds.
Location & tenants
- Location reads 73/100 on livability (#198 in TX) — a middle-class / working-renter tenant base. Strengths: employment A+, housing A+, crime A; Watch: health & safety D+, amenities F, commute F.
- Schertz-Cibolo-U City ISD (suburban): math 49% / reading 48% proficiency, ranked #152 of 826 in TX (top 18%) — families likely to look elsewhere, expect single-tenant / working-renter base with shorter leases.
- Zoned schools: Rose Garden El (math 32% / reading 36%, grade F, #2,149 of 4,322 statewide, top 50%, 902 students, 48% FRL); Samuel Clemens H S (math 45% / reading 60%, grade C-, #444 of 1,632 statewide, top 27%, 2,544 students, 30% FRL).
- Market conditions: Rents soft (-2.9%/yr); 495 active listings in the ZIP; 18 comparable units currently listed for rent nearby; rentals leasing fast (median 11d on market — plan ~1-2 weeks tenant-placement turnaround); solid renter incomes; 8,308 units permitted in Bexar County in 2024 (2,506 in 5+ unit buildings).
Forward outlook
- Local home prices are declining (-3.0%/yr); year-one equity from $2k of loan paydown is wiped out by about $8k of value loss. Plan a longer hold.
- Bexar County population projected at +50% by 2050 — long-run rental-demand tailwind backs the buy-and-hold thesis.
Negotiation context
- It's been on market 221 days — a 12% lower offer ($248k) is reasonable based on typical stale-listing flexibility.
- 3 sale attempts since 2y ago with the ask held roughly flat each time — persistent listings suggest the price (not the market) is what's stuck; bring a comps-based counter.
Risks & watch-outs
- Climate carrying-cost: severe wind risk, 80% chance of damaging wind over 30y; moderate wildfire risk; extreme-heat days projected 7→21/yr by 2055 (HVAC capex compounding) — expect insurance premiums to compound above CPI over the hold.
Questions for the listing agent
- What do current leases actually rent for vs. the listed asking? Can we see a recent rent roll and the last 12 months of T-12 income?
- It's been on market 221 days. Have you received any prior offers? Is the seller open to a 17% concession, seller financing, or rate buy-down credit?
- What does the HOA fee cover, when was the last increase, and are there any pending special assessments or reserve-fund shortfalls?
- Why hasn't it sold? Are there any deal-killer items the seller is aware of (foundation, flood, title, zoning, code violations)?
- Is there a deadline driving the sale (1031 exchange, divorce, estate, relocation)? That informs how much negotiation room exists.
- The area grade is low — what's the realistic commute time and amenity access for the typical tenant pool here? Any planned neighborhood developments (good or bad) we should know about?
- What's the average days-on-market for RENTAL listings here right now (not sales)? A rising rental-DOM trend means longer vacancies and softer asking-rent achievability than the comps imply.
- What's the recent tenant-quality profile in this submarket — average credit score on applications, eviction rate, late-payment / NSF rate, and stable-employment percentage? A property-management company in the area should have these aggregated.
- How much new for-sale + rental construction is in the pipeline within 1–3 miles? Heavy new supply typically softens prices + rents 12–24 months out; constrained supply supports both.
Investment metrics
- 1% rule
- 0.83% ✗
- Cap rate
- 6.06%
- Cash-on-cash
- -0.83%
- DSCR
- 0.96
- GRM
- 10.1
CMA / ARV
- ARV (on-the-fly)
- $356,949
- Comps found
- 12
Show comp detail 12 sales within ~0.75 mi
| Address | Dist | Beds/Ba | Sqft | Sold | Price | $/sf | Match |
|---|---|---|---|---|---|---|---|
| 10157 Galineer Gln | 0.35mi | 4/2.5 | 2,338 (+0%) | 2mo | $349,990 | $150 | 82 |
| 10134 Pine River Dr | 0.48mi | 4/2.5 | 2,338 (+0%) | 2mo | $339,990 | $145 | 76 |
| 10231 Pine River Dr | 0.38mi | 4/3.0 | 2,260 (-3%) | 1mo | $344,990 | $153 | 74 |
| 10269 Bartenheim Dr | 0.20mi | 4/3.0 | 2,119 (-9%) | 2mo | $324,990 | $153 | 72 |
| 10227 Pine River Dr | 0.38mi | 4/2.5 | 2,121 (-9%) | 1mo | $319,990 | $151 | 66 |
| 10106 Pine River Rd | 0.54mi | 4/3.0 | 2,165 (-7%) | 2mo | $421,990 | $195 | 60 |
| 12602 Winding Butte | 0.70mi | 4/2.0 | 2,403 (+3%) | 1mo | $419,990 | $175 | 59 |
| 10110 Pine Riv | 0.53mi | 4/3.5 | 2,522 (+8%) | 2mo | $429,990 | $170 | 56 |
| 10113 Peppercorn Pl | 0.54mi | 4/3.5 | 2,522 (+8%) | 1mo | $442,990 | $176 | 56 |
| 10226 Galineer Gln | 0.36mi | 5/3.0 (+1) | 2,609 (+12%) | 1mo | $361,990 | $139 | 56 |
| 12811 Prairie Vly | 0.36mi | 5/3.0 (+1) | 2,609 (+12%) | 2mo | $369,990 | $142 | 55 |
| 10223 Pine River Dr | 0.38mi | 5/3.0 (+1) | 2,609 (+12%) | 2mo | $363,490 | $139 | 54 |
Match score weights: distance 35% · size 25% · config 20% · recency 20%. Top-matched comps best support the ARV.
Projected returns pro-forma
-3.0% appreciation · 0.0% rent growth · sell at horizon
- IRR
- -21.0%
- Equity multiple
- 0.29×
- Total profit
- $-55,990
- Equity at exit
- $42,047
- IRR
- -23.0%
- Equity multiple
- -0.01×
- Total profit
- $-79,591
- Equity at exit
- $24,382
Cash invested: $78,960 (down + closing). Projections, not guarantees.
Landlord ↔ Tenant lean methodology
- Overall (STATE)
- 87 Strongly Landlord-Friendly
- State Texas
- 87 Strongly Landlord-Friendly · R+5
- County
- — inherits STATE
- City
- — inherits STATE
ZIP-level market 78154
- Home prices YoY
- -17.6%
- Rents YoY
- -2.9%
- Active inventory
- 495
- Price-to-rent
- 10.1×
Monthly cashflow live
- Estimated rent
- $2,329 high interval (Pro) →
- Mortgage (P&I)
- −$1,479
- Tax from tax record
- −$206 /mo · $2,469/yr
- Insurance
- −$118
- HOA
- −$92
- Vacancy / Maint / Mgmt
- −$489
- Net cashflow
- $-54
Break-even live
UW: 25.0% down · 7.5% · 30yr · 1.5% tax · 5.0% vac · 8.0% maint · 8.0% mgmt
Financing live
Cash to close
- Down payment
- $70,500
- Closing costs
- $8,460
- Reserves months
- —
- Total cash needed
- —
Loan-product check · same deal, 3 products live
Conventional
25% down · 7.5% · 30yr
- Down + closing
- —
- Monthly P&I
- —
- Monthly cashflow
- —
- DSCR
- —
- Eligible?
- —
Personal DTI + credit; lowest rate.
DSCR
20% down · 8.5% · 30yr
- Down + closing
- —
- Monthly P&I
- —
- Monthly cashflow
- —
- DSCR
- —
- Eligible?
- —
No personal income docs; deal must DSCR.
Hard money
10% down · 12.0% · 12mo
- Down + closing
- —
- Monthly P&I
- —
- Monthly cashflow
- —
- DSCR
- —
- Eligible?
- —
Short-term bridge; refi at stabilization.
Rent comps 18 comps
| Address | Beds | Baths | Sqft | Rent | $/sqft | DOM | Units | Dist |
|---|---|---|---|---|---|---|---|---|
| 12371 Erstein Vly Selma, TX | 4.0 | 2.0 | 1901 | $1,900 | $1.00 | 24d | 1 | 0.05mi |
| 12341 Erstein Vly Selma, TX | 4.0 | 2.0 | 1702 | $1,841 | $1.08 | 4d | 1 | 0.06mi |
| 10151 Bussang Rd Schertz, TX | 5.0 | 3.5 | 2812 | $2,825 | $1.00 | 20d | 1 | 0.08mi |
| 10051 Mulhouse Dr Schertz, TX | 5.0 | 2.5 | 2945 | $3,200 | $1.09 | 24d | 1 | 0.19mi |
| 9942 Sarrebourg St Schertz, TX | 4.0 | 3.0 | 1904 | $2,000 | $1.05 | 4d | 1 | 0.48mi |
| 11622 Blossom Blf Schertz, TX | 3.0 | 2.5 | 2129 | $2,200 | $1.03 | 2d | 1 | 0.73mi |
| 10226 Shadowy Dusk Schertz, TX | 4.0 | 2.5 | 2413 | $2,297 | $0.95 | 22d | 1 | 0.81mi |
| 12025 Vignette Schertz, TX | 4.0 | 3.5 | 2793 | $2,900 | $1.04 | 10d | 1 | 0.89mi |
| 3013 Muntjac Schertz, TX | 4.0 | 2.5 | 2280 | $2,100 | $0.92 | 44d | 1 | 0.97mi |
| 10419 Monicas Crk Schertz, TX | 3.0 | 2.5 | 1966 | $2,200 | $1.12 | 11d | 1 | 0.98mi |
| 3129 Turquoise Schertz, TX | 4.0 | 2.5 | 2339 | $2,097 | $0.90 | 24d | 1 | 0.99mi |
| 9104 Gila Bnd Schertz, TX | 3.0 | 2.0 | 1780 | $2,350 | $1.32 | 2d | 1 | 1.03mi |
| 9107 Curling Post Schertz, TX | 4.0 | 3.0 | 2785 | $2,900 | $1.04 | 44d | 1 | 1.07mi |
| 9337 Canopy Bnd Schertz, TX | 4.0 | 2.0 | 1880 | $2,700 | $1.44 | 2d | 1 | 1.08mi |
| 9018 Canopy Bnd Schertz, TX | 3.0 | 2.0 | 1880 | $2,600 | $1.38 | 2d | 1 | 1.11mi |
| 9010 Canopy Bnd Schertz, TX | 4.0 | 3.0 | 3180 | $3,100 | $0.97 | 2d | 1 | 1.13mi |
| 8927 Green Grant Schertz, TX | 3.0 | 2.0 | 1636 | $2,195 | $1.34 | 2d | 1 | 1.15mi |
| 11526 Hollering Pass Schertz, TX | 4.0 | 2.5 | 3014 | $3,000 | $1.00 | 10d | 1 | 1.35mi |
HOA detail
- Monthly dues
- $92 · $1,104/yr
Listing history 25 events
-
2026-06-18days on market $282,000 Active 221 DOM
-
2026-06-17days on market $282,000 Active 220 DOM
-
2026-06-16days on market $282,000 Active 219 DOM
-
2026-06-13days on market $282,000 Active 216 DOM
-
2026-06-13days on market $282,000 Active 215 DOM
-
2026-06-09days on market $282,000 Active 212 DOM
-
2026-06-08days on market $282,000 Active 211 DOM
-
2026-06-07days on market $282,000 Active 210 DOM
-
2026-06-04days on market $282,000 Active 207 DOM
-
2026-06-03days on market $282,000 Active 206 DOM
-
2026-06-02days on market $282,000 Active 205 DOM
-
2026-06-01days on market $282,000 Active 204 DOM
-
2026-05-31days on market $282,000 Active 203 DOM
-
2026-05-15price $282,000
-
2026-02-03price $287,000
-
2025-11-08$290,000 New
-
2025-10-30historical
-
2025-09-25price $325,000
-
2025-08-11$345,000 New
-
2024-11-16historical $2,050
-
2024-11-09price $2,050
-
2024-10-18price $2,100
-
2024-10-11price $2,200
-
2024-09-25$2,250
-
2022-08-07price $2,195
ⓘ Source: listings_history table (triggers on properties + properties_extension) + one-shot
backfill from property_details.listing_events for pre-trigger history.
Tax reassessment forecast TX · Resets to sale price
- Current annual tax
- $2,469 · $206/mo
- Projected year-2 tax
- $5,161 · $430/mo
- Expected delta
- +$2,692/yr (+$224/mo · 109.0%)
ⓘ Screening estimate from a state-policy table — verify with the county assessor before closing.
Climate risk First Street
- Flood 1/10 Low FEMA zone X (unshaded) · 0% chance over 30 yrs
- Wildfire 5/10 Major
- Heat 8/10 Severe 7 d/yr ≥108°F today · 21 d/yr by 30 yrs out
- Wind 8/10 Severe 80% chance of damaging wind over 30 yrs
- Air quality 1/10 Low 0 unhealthy d/yr today · 0 by 30 yrs out
Nearby sold comps map
Loading sold comps map…
Walkable amenities ~0.75 mi
Loading nearby amenities…
Taxation est. · year 1
- Rental income
- $27,943
- − Mortgage interest
- −$15,796
- − Property taxes
- −$2,469
- − Insurance
- −$1,410
- − Repairs & maintenance
- −$2,235
- − Management
- −$2,235
- − HOA
- −$1,104
- − Depreciation
- −$8,204
- Taxable loss
- −$5,511
- Est. tax savings @ 24.0%
- +$1,323
- After-tax cash flow
- $669/yr
For passive investors: Depreciation is non-cash, so a rental often shows a tax loss while cash-flowing — sheltering income. Rental losses are passive: they offset passive income freely, and up to $25,000/yr can offset ordinary (W-2) income if you actively participate and your MAGI is under $100k (phasing out to $0 by $150k); unused losses carry forward. On sale, claimed depreciation is recaptured at up to 25%, and gains may owe capital-gains tax (a 1031 exchange can defer both). Figures are a year-1 estimate at your 24.0% rate — not tax advice; consult a CPA.
Schools (NCES district)
- District
- Schertz-Cibolo-U City ISD
- NCES district ID
- 4839480
- Math proficiency
- 49% ▼ -12.00%
- Reading proficiency
- 48% ▼ -4.00%
- Median HH income
- $75,790
- Composite
- 44.02/100
- National rank
- #2886
- State rank
- #152 of 826 in TX
Livability — Schertz
- Score
- 73/100
- State rank
- #198
- US rank
- #5013
Category grades
Schools grade is shown separately in the Schools card above.
Census & demographics
- Census place
- Schertz, TX
- County
- Guadalupe County · 147,291 people
- City population
- 41,907
- Metro
- San Antonio-New Braunfels, TX
- Population (ZIP)
- 41,907
- Household income
- $100,572
- Rent vs Own
- Severe rent burden
- 776.0
Population outlook (Bexar County) Hauer SSP2
- Today (2025)
- 2,336,851 people
- By 2030
- 2,560,728 · +9.6%
- By 2040
- 3,020,569 · +29.3%
- By 2050
- 3,493,522 · +49.5%
- By 2075
- 4,668,459 · +99.8%
- By 2100
- 5,533,242 · +136.8%
Race, ethnicity, and origin ACS 2023
- Neighborhood character
- Diverse neighborhood (Simpson 0.66)
- Race & ethnicity
- White 46% Hispanic / Latino 32% Two or more races 19% Black 15% Asian 2%
- Hispanic origin (detail)
- Mexican 26%
- Common ancestry
- Italian 3% Romanian 3% Lithuanian 2%
- Foreign-born
- 6% · Canada
- Languages at home
- 82% English-only · Spanish 16% German/W. Germanic 1% Other Indo-European 1%
Political lean MEDSL · Bexar
- 2024 margin
- Lean D (+9.8) · D 54.3% · R 44.6% · Other 1.1%
- 2008→2024 swing
- +4.2pp toward D · 2008: 5.6pp · 2024: 9.8pp
- All cycles
- 2024: D+9.8 2020: D+18.2 2016: D+13.5 2012: D+4.6 2008: D+5.6
Not yet ingested
- Civics
- —
Market trends
- HPI YoY
- ▼ -47.53%
- Current HPI
- 222.8314
- Rent YoY
- ▼ -2.86%
- Metro
- San Antonio-New Braunfels, TX
- State GDP YoY
- ▲ 3.95%
- F500 in state
- 110
Industry mix (Fortune 500 HQ in TX)
| Industry | F500 HQs | Revenue |
|---|---|---|
| Energy | 16 | $1,198B |
|
||
| Technology | 5 | $198B |
|
||
| Engineering / Construction | 4 | $72B |
|
||
| Energy Services | 3 | $60B |
|
||
| Utilities | 3 | $41B |
|
||
| Healthcare | 2 | $330B |
|
||
Price history
+12747.4% since first listed12 events — show timeline
- 2026-05-15 Price Changed $282,000 LERA
- 2026-02-03 Price Changed $287,000 LERA
- 2025-11-08 Listed $290,000 LERA
- 2025-10-30 Listing Removed — LERA
- 2025-09-25 Price Changed $325,000 LERA
- 2025-08-11 Listed $345,000 LERA
- 2024-11-16 Rental Removed $2,050 APPFOLIO
- 2024-11-09 Price Changed $2,050 APPFOLIO
- 2024-10-18 Price Changed $2,100 APPFOLIO
- 2024-10-11 Price Changed $2,200 APPFOLIO
- 2024-09-25 Listed for Rent $2,250 APPFOLIO
- 2022-08-07 Price Changed $2,195 RENT.
Property tax history
+14.7%/yrLatest (2025): $2,469 · -70.7% YoY. Source: county tax records.
Cash-flow waterfall
monthlySold comps — $/sqft
last 12 mo · ≤1 miLoading sold comps…