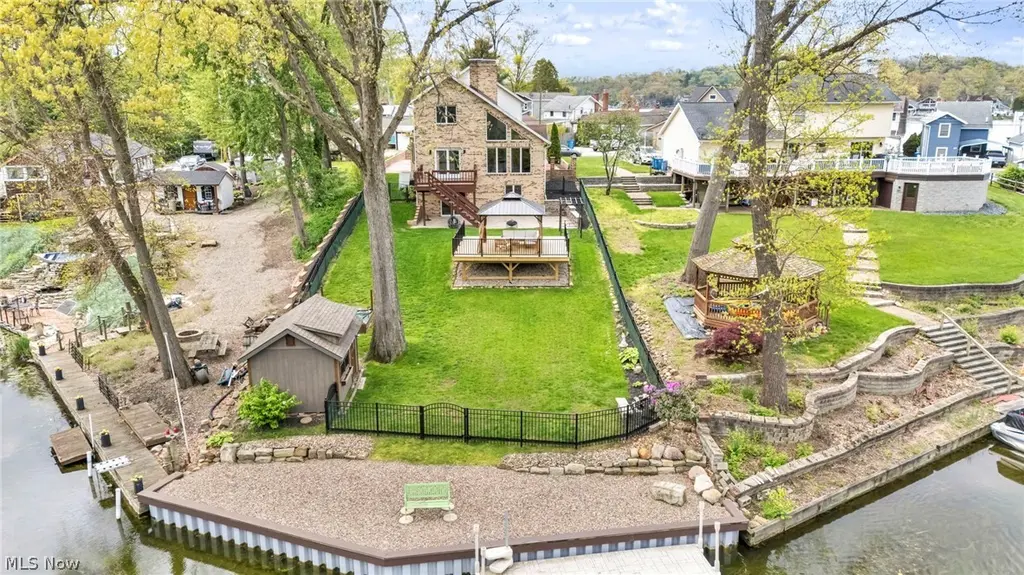
 🌊 Lakefront
117 Wymore Ave · Portage Lakes, OH
Flood risk 1/10 · Minimal
- FEMA flood zone
- X (unshaded)
- Chance of flooding over 30 yrs
- 0.0%
- Est. flood insurance / yr
- $473 – $860
Fire risk 1/10 · Minimal
- Est. fire insurance / yr
- $713 – $1,323
Heat risk 3/10 · Minor
- Hot days now (above 97°F)
- 7 days/yr
- Hot days in 30 yrs
- 17 days/yr
Wind risk 1/10 · Minimal
- Chance of severe wind over 30 yrs
- —
Air-quality risk 2/10 · Minimal
- Unhealthy air days now
- 1 days/yr
- Unhealthy air days in 30 yrs
- 2 days/yr
Risk factors via First Street. Map © Google.
Why this score? — see what drove the C+ grade
The composite is a weighted blend of 9 inputs, each scored 0–100. Each bar is that input's sub-score; the figure is the points it added to the 100-point composite (weight × sub-score).
- Cash flow +30.0/30.0
- 1% rule +10.0/10.0
- DSCR +10.0/10.0
- Schools +5.0/10.0
- Livability +3.2/5.0
- Rent growth +2.5/5.0
- Condition / age +2.5/5.0
- ARV discount +0.0/15.0
- Appreciation +0.0/10.0
$720,000
🖨 Deal sheet (PDF) 📄 Offer letter ✓ Due diligence
Listing remarks
Here's your chance to own a rare brick beauty on the main chain of Portage Lakes -- Meticulously cared for by the same owner for 27 years, pride of ownership shows. Situated on a quiet & private quiet end of East Reservoir, yet still connected to the main chain and all the action! This unique contemporary style home features 4 beds & 3.5 baths w/ big ticket updates throughout. Enter first floor living room with beautiful two story brick fireplace with stunning views of the lake. Living area connects to dining room, kitchen, family room, and half bath. Upper level has 3 bedrooms; including giant master suite with updated master bath, walk-in closet, a guest bath, 2nd floor laund
Key facts
- Updated master bath
- Walk-in closet
- Brand new carpet
Tags
Property features AI
Exterior
- Parking: Attached garage with 2 garage spaces; Driveway parking; Garage door opener
- Utilities: Public sewer; Well water
- Home design: Three stories; Brick construction; Asphalt/fiberglass shingle roof
- Construction: Brick exterior; Built (year per public records); Asphalt/fiberglass roof
- Exterior features: Lakefront / waterfront property; Boat slip and dock; Front porch; Shed(s); Full fenced yard with gate
Interior
- Kitchen: Range; Microwave; Refrigerator; Disposal; Granite counters
- Bedrooms: Multiple bedrooms on lower, second and possibly other levels (carpeted bedrooms on lower and second levels)
- Flooring: Wood flooring in living and dining rooms; Carpet in family room and multiple bedrooms; Ceramic tile in kitchen, some bathrooms and upper-level areas
- Bathrooms: Three full bathrooms; One half bathroom; Main-level bathroom included; Bathrooms with ceramic tile flooring
- Heating & cooling: Forced air heating; Central air conditioning
- Interior features: Ceiling fans; Double vanity; Granite countertops; High ceilings; Finished walk-out basement; Two fireplaces (decorative masonry; one in basement)
- Laundry & utility: Washer and dryer included; Laundry room on upper/second level; Water softener
Neighborhood map
What this means for you Summary
Snapshot
- This is a 4-bed/3.5-bath single-family listed at $720k.
Deal economics
- At list price, monthly cash flow is $4k ($45k/yr) — positive.
- The deal already cash-flows at list — no discount required.
- Meets the 1% rule at list price ($11k rent vs $720k).
- Recommended offer: $698k (3.0% below list) — sets the bar for market timing.
Location & tenants
- Location reads 64/100 on livability (#772 in OH) — a middle-class / working-renter tenant base. Strengths: cost of living A+, housing A+, crime B+; Watch: employment D+, schools D-, amenities F.
- Coventry Local (suburban): math 52% / reading 64% proficiency, ranked #315 of 656 in OH (top 48%) — acceptable for families but not a draw, mixed tenant base, ~2y average lease.
- Market conditions: 90 active listings in the ZIP; 1 comparable units currently listed for rent nearby; 1,114 units permitted in Summit County in 2024 (397 in 5+ unit buildings).
- At $11,111/mo this rent would consume 178% of the median local household income ($75k/yr) — very limited rent-growth headroom before tenants either downsize or default.
Forward outlook
- Local home prices are declining (-3.0%/yr); year-one equity from $5k of loan paydown is wiped out by about $22k of value loss. Plan a longer hold.
- Summit County population projected to shrink 6% by 2050 — rents likely to lag national; underwrite the cash flow, not the appreciation.
- At projected returns (-3.0% appreciation + 3.0% rent growth), your $202k cash investment doubles in ~6 years — after that, you're playing with house money.
Negotiation context
- It's been on market 38 days — a 3% lower offer ($698k) is reasonable based on typical stale-listing flexibility.
- 4 sale attempts since 32y ago with the ask held roughly flat each time — persistent listings suggest the price (not the market) is what's stuck; bring a comps-based counter.
- Current owner paid $275k; list at $720k implies a 162% gain — meaningful room to come down on a strong offer.
Questions for the listing agent
- It's been on market 38 days. Have you received any prior offers? Is the seller open to a 3% concession, seller financing, or rate buy-down credit?
- Is there a deadline driving the sale (1031 exchange, divorce, estate, relocation)? That informs how much negotiation room exists.
- Schools are D-rated, which usually means shorter tenancies and higher turnover. Who's the typical renter profile here, and what's been the actual vacancy rate?
- This sits on a lake — are riparian / water-frontage rights deeded with the parcel? Any dock permits, shoreline easements, or HOA water-use restrictions?
- What's the documented flood / surge / shoreline-erosion history here (FEMA AND non-FEMA — e.g., storm surge, creek backup, septic-field saturation)?
- Any water-quality or seasonal algae-bloom issues that affect tenant satisfaction or short-term-rental demand?
- What's the average days-on-market for RENTAL listings here right now (not sales)? A rising rental-DOM trend means longer vacancies and softer asking-rent achievability than the comps imply.
- What's the recent tenant-quality profile in this submarket — average credit score on applications, eviction rate, late-payment / NSF rate, and stable-employment percentage? A property-management company in the area should have these aggregated.
- How much new for-sale + rental construction is in the pipeline within 1–3 miles? Heavy new supply typically softens prices + rents 12–24 months out; constrained supply supports both.
Investment metrics
- 1% rule
- 1.54% ✓
- Cap rate
- 12.50%
- Cash-on-cash
- 22.18%
- DSCR
- 1.99
- GRM
- 5.4
CMA / ARV
- ARV (median comp)
- $596,721
- List price
- $720,000
- Delta
- 20.66%
- Verdict
- OVERPRICED
- Comps
- 20 within 1.0 mi
Show comp detail 3 sales within ~0.75 mi
| Address | Dist | Beds/Ba | Sqft | Sold | Price | $/sf | Match |
|---|---|---|---|---|---|---|---|
| 122 Wymore Ave | 0.03mi | 3/3.0 (-1) | 2,552 (+0%) | 12mo | $758,000 | $297 | 81 |
| 3350 S Main St | 0.40mi | 3/2.5 (-1) | 2,904 (+14%) | 8mo | $725,000 | $250 | 42 |
| 451 Fan Dr | 0.66mi | 3/3.5 (-1) | 2,742 (+8%) | 20mo | $810,000 | $295 | 34 |
Match score weights: distance 35% · size 25% · config 20% · recency 20%. Top-matched comps best support the ARV.
Projected returns pro-forma
-3.0% appreciation · 3.0% rent growth · sell at horizon
- IRR
- 15.0%
- Equity multiple
- 1.60×
- Total profit
- $120,900
- Equity at exit
- $107,354
- IRR
- 23.7%
- Equity multiple
- 3.04×
- Total profit
- $411,781
- Equity at exit
- $62,252
Cash invested: $201,600 (down + closing). Projections, not guarantees.
Landlord ↔ Tenant lean methodology
- Overall (STATE)
- 73 Landlord-Friendly
- State Ohio
- 73 Landlord-Friendly · R+6
- County
- — inherits STATE
- City
- — inherits STATE
ZIP-level market 44319
- Active inventory
- 90
- Price-to-rent
- 5.4×
Monthly cashflow live
- Estimated rent
- $11,111 medium interval (Pro) →
- Mortgage (P&I)
- −$3,776
- Tax from tax record
- −$975 /mo · $11,703/yr
- Insurance
- −$300
- HOA
- −$0
- Vacancy / Maint / Mgmt
- −$2,333
- Net cashflow
- $3,727
Break-even live
Sensitivity live
| Price | -10% $4,134 | -5% $3,931 | +0% $3,727 | +5% $3,523 | +10% $3,319 |
|---|---|---|---|---|---|
| Rent | -10% $2,849 | -5% $3,288 | +0% $3,727 | +5% $4,166 | +10% $4,604 |
| Rate | -1.0pp $4,089 | -0.5pp $3,910 | base $3,727 | +0.5pp $3,540 | +1.0pp $3,350 |
UW: 25.0% down · 7.5% · 30yr · 1.5% tax · 5.0% vac · 8.0% maint · 8.0% mgmt
Financing live
Cash to close
- Down payment
- $180,000
- Closing costs
- $21,600
- Reserves months
- —
- Total cash needed
- —
Loan-product check · same deal, 3 products live
Conventional
25% down · 7.5% · 30yr
- Down + closing
- —
- Monthly P&I
- —
- Monthly cashflow
- —
- DSCR
- —
- Eligible?
- —
Personal DTI + credit; lowest rate.
DSCR
20% down · 8.5% · 30yr
- Down + closing
- —
- Monthly P&I
- —
- Monthly cashflow
- —
- DSCR
- —
- Eligible?
- —
No personal income docs; deal must DSCR.
Hard money
10% down · 12.0% · 12mo
- Down + closing
- —
- Monthly P&I
- —
- Monthly cashflow
- —
- DSCR
- —
- Eligible?
- —
Short-term bridge; refi at stabilization.
Rent comps 1 comps
| Address | Beds | Baths | Sqft | Rent | $/sqft | DOM | Units | Dist |
|---|---|---|---|---|---|---|---|---|
| 3581 Mong Ave Unit 1496037P Akron, OH | 4.0 | 2.0 | 2142 | $11,111 | $5.19 | 44d | 1 | 0.71mi |
Listing history 24 events
-
2026-06-18days on market $720,000 Active 38 DOM
-
2026-06-17days on market $720,000 Active 37 DOM
-
2026-06-16days on market $720,000 Active 36 DOM
-
2026-06-15days on market $720,000 Active 35 DOM
-
2026-06-14days on market $720,000 Active 33 DOM
-
2026-06-13days on market $720,000 Active 32 DOM
-
2026-06-10days on market $720,000 Active 30 DOM
-
2026-06-09days on market $720,000 Active 29 DOM
-
2026-06-08days on market $720,000 Active 28 DOM
-
2026-06-07days on market $720,000 Active 27 DOM
-
2026-06-03pricedays on market $720,000 Active 23 DOM
-
2026-06-02days on market $749,900 Active 22 DOM
-
2026-06-01days on market $749,900 Active 21 DOM
-
2026-05-31days on market $749,900 Active 20 DOM
-
2026-05-31days on market $749,900 Active 19 DOM
-
2026-05-11$749,900 Active 1549-char remark
-
1999-07-15soldstatus $275,000
-
1996-11-17historical
-
1996-05-17$289,000
-
1996-04-01historical
-
1994-10-17$289,000
-
1994-10-14historical
-
1994-09-16$299,900
-
1990-09-05soldstatus $34,700
ⓘ Source: listings_history table (triggers on properties + properties_extension) + one-shot
backfill from property_details.listing_events for pre-trigger history.
Tax reassessment forecast OH · Partial reset (capped growth)
- Current annual tax
- $11,703 · $975/mo
- Projected year-2 tax
- $11,703 · $975/mo
- Expected delta
- $0/yr ($0/mo · 0.0%)
ⓘ Screening estimate from a state-policy table — verify with the county assessor before closing.
Climate risk First Street
- Flood 1/10 Low FEMA zone X (unshaded) · 0% chance over 30 yrs
- Wildfire 1/10 Low
- Heat 3/10 Moderate 7 d/yr ≥97°F today · 17 d/yr by 30 yrs out
- Wind 1/10 Low
- Air quality 2/10 Low 1 unhealthy d/yr today · 2 by 30 yrs out
Nearby sold comps map
Loading sold comps map…
Walkable amenities ~0.75 mi
Loading nearby amenities…
Taxation est. · year 1
- Rental income
- $133,332
- − Mortgage interest
- −$40,331
- − Property taxes
- −$11,703
- − Insurance
- −$3,600
- − Repairs & maintenance
- −$10,667
- − Management
- −$10,667
- − Depreciation
- −$20,945
- Taxable income
- $35,420
- Est. tax owed @ 24.0%
- −$8,501
- After-tax cash flow
- $36,220/yr
For passive investors: Depreciation is non-cash, so a rental often shows a tax loss while cash-flowing — sheltering income. Rental losses are passive: they offset passive income freely, and up to $25,000/yr can offset ordinary (W-2) income if you actively participate and your MAGI is under $100k (phasing out to $0 by $150k); unused losses carry forward. On sale, claimed depreciation is recaptured at up to 25%, and gains may owe capital-gains tax (a 1031 exchange can defer both). Figures are a year-1 estimate at your 24.0% rate — not tax advice; consult a CPA.
Schools (NCES district)
- District
- Coventry Local
- NCES district ID
- 3904999
- Math proficiency
- 52% ▼ -13.00%
- Reading proficiency
- 64% ▼ -2.00%
- Median HH income
- $52,981
- Composite
- 49.66/100
- National rank
- #1976
- State rank
- #315 of 656 in OH
Livability — Portage Lakes
- Score
- 64/100
- State rank
- #772
- US rank
- #14032
Category grades
Schools grade is shown separately in the Schools card above.
Census & demographics
- Census place
- Portage Lakes, OH
- County
- Summit · 539,389 people
- Metro
- Akron, OH
- Population (ZIP)
- 21,469
- Household income
- $74,781
- Rent vs Own
- Severe rent burden
- 12.4
Population outlook (Summit County) Hauer SSP2
- Today (2025)
- 546,583 people
- By 2030
- 544,028 · -0.5%
- By 2040
- 531,363 · -2.8%
- By 2050
- 514,923 · -5.8%
- By 2075
- 481,765 · -11.9%
- By 2100
- 432,265 · -20.9%
Race, ethnicity, and origin ACS 2023
- Neighborhood character
- Predominantly White (91%)
- Race & ethnicity
- White 91% Two or more races 4% Black 2% Hispanic / Latino 2% Asian 2%
- Common ancestry
- Romanian 5% Slovak 2% Serbian 1%
- Foreign-born
- 2% · China, Vietnam
- Languages at home
- 97% English-only · Other Indo-European 1% Spanish 1% Chinese 1%
Political lean MEDSL · Summit
- 2024 margin
- Lean D (+7.0) · D 53.0% · R 46.0%
- 2008→2024 swing
- -9.6pp toward R · 2008: 16.6pp · 2024: 7.0pp
- All cycles
- 2024: D+7.0 2020: D+9.6 2016: D+8.2 2012: D+14.8 2008: D+16.6
Not yet ingested
- Civics
- —
Market trends
- HPI YoY
- ▼ -236.58%
- Current HPI
- 213.2267
- Rent YoY
- —
- Metro
- —
- State GDP YoY
- ▲ 1.98%
- F500 in state
- 48
Industry mix (Fortune 500 HQ in OH)
| Industry | F500 HQs | Revenue |
|---|---|---|
| Insurance | 3 | $145B |
|
||
| Industrial Machinery | 3 | $49B |
|
||
| Financial Services | 3 | $24B |
|
||
| Consumer Goods | 2 | $93B |
|
||
| Aerospace / Defense | 2 | $47B |
|
||
| Utilities | 2 | $33B |
|
||
Price history
+1974.9% since first listed10 events — show timeline
- 2026-06-03 Price Changed $720,000 MLSNOW
- 2026-05-11 Listed $749,900 MLSNOW
- 1999-07-15 Sold (Public Records) $275,000 Public Records
- 1996-11-17 Listing Removed — MLSNOW
- 1996-05-17 Listed $289,000 MLSNOW
- 1996-04-01 Listing Removed — MLSNOW
- 1994-10-17 Listed $289,000 MLSNOW
- 1994-10-14 Listing Removed — MLSNOW
- 1994-09-16 Listed $299,900 MLSNOW
- 1990-09-05 Sold (Public Records) $34,700 Public Records
Property tax history
+3.8%/yrLatest (2025): $11,703 · +3.3% YoY. Source: county tax records.
Cash-flow waterfall
monthlySold comps — $/sqft
last 12 mo · ≤1 miLoading sold comps…