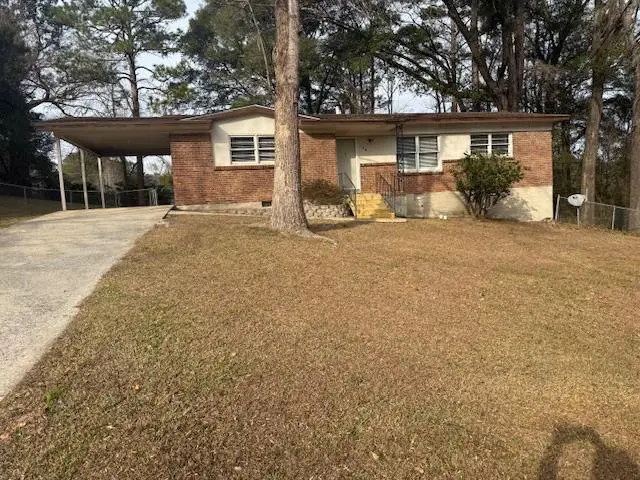
24 Andrews Ave · Daleville, AL
Flood risk 1/10 · Minimal
- FEMA flood zone
- X (unshaded)
- Chance of flooding over 30 yrs
- 0.0%
- Est. flood insurance / yr
- $507 – $1,088
Fire risk 4/10 · Minor
- Est. fire insurance / yr
- $916 – $1,700
Heat risk 8/10 · Major
- Hot days now (above 106°F)
- 7 days/yr
- Hot days in 30 yrs
- 20 days/yr
Wind risk 8/10 · Major
- Chance of severe wind over 30 yrs
- 99.0%
Air-quality risk 1/10 · Minimal
- Unhealthy air days now
- 0 days/yr
- Unhealthy air days in 30 yrs
- 0 days/yr
Risk factors via First Street. Map © Google.
Why this score? — see what drove the C+ grade
The composite is a weighted blend of 9 inputs, each scored 0–100. Each bar is that input's sub-score; the figure is the points it added to the 100-point composite (weight × sub-score).
- Cash flow +18.7/30.0
- ARV discount +11.5/15.0
- Appreciation +10.0/10.0
- DSCR +5.9/10.0
- 1% rule +4.0/10.0
- Livability +3.1/5.0
- Rent growth +2.5/5.0
- Condition / age +2.5/5.0
- Schools +2.0/10.0
$149,000
🖨 Deal sheet 📄 Offer letter ✓ Due diligence
Listing remarks MLS
Move In Ready!! This 3 bedroom, 2 bath brick home has new water heater, new interior paint and carpet. Large family room. Spacious laundry room. Large lot with fenced in back yard. Roof new in 2019. New front steps. Hot water heater and central heat are gas.
Key facts
- Large family room
- New carpet
- New water heater
Tags
Neighborhood map
What this means for you Summary
Snapshot
- This is a 3-bed/1.0-bath single-family listed at $149k.
Deal economics
- At list price, monthly cash flow is $147 ($2k/yr) — positive.
- The deal already cash-flows at list — no discount required.
- To meet the 1% rule (rent ≥ 1% of price), the offer needs to be $135k (9.6% below list).
- Recommended offer: $135k (9.6% below list) — sets the bar for 1% rule.
Location & tenants
- Location reads 61/100 on livability (#278 in AL) — a middle-class / working-renter tenant base. Strengths: cost of living A+, housing A-; Watch: health & safety D, schools F, amenities F.
- Daleville City (town): math 9% / reading 37% proficiency, ranked #97 of 129 in AL (top 75%) — low school quality limits family demand, transient renter base, plan for 1-2y turnover; 62% free/reduced lunch — lower-income household profile, screen leases tightly.
- Market conditions: 41 active listings in the ZIP; 38 units permitted in Dale County in 2024 (0 in 5+ unit buildings).
- This rent runs 34% of the median local income ($47k/yr) — at the standard rent-burdened threshold; future hikes will face affordability resistance.
Forward outlook
- In year one you build about $16k of equity ($1k loan paydown + $15k appreciation (10.0% local appreciation)).
- Dale County population projected at -20% by 2050 — secular population decline; favor cash flow + early exit over multi-decade hold.
- At projected returns (10.0% appreciation + 3.0% rent growth), your $42k cash investment doubles in ~3 years — after that, you're playing with house money.
- By year 3, paydown + projected appreciation supports a ~$40k cash-out refi (75% LTV) — recoverable capital for the next deal without selling this one.
Negotiation context
- It's been on market 100 days — a 9% lower offer ($136k) is reasonable based on typical stale-listing flexibility.
Risks & watch-outs
- Climate carrying-cost: severe wind risk, 99% chance of damaging wind over 30y; extreme-heat days projected 7→20/yr by 2055 (HVAC capex compounding) — expect insurance premiums to compound above CPI over the hold.
Questions for the listing agent
- It's been on market 100 days. Have you received any prior offers? Is the seller open to a 10% concession, seller financing, or rate buy-down credit?
- Built in 1968 — when were the roof, HVAC, electrical panel, plumbing, and water heater last replaced?
- Why hasn't it sold? Are there any deal-killer items the seller is aware of (foundation, flood, title, zoning, code violations)?
- Is there a deadline driving the sale (1031 exchange, divorce, estate, relocation)? That informs how much negotiation room exists.
- Schools are F-rated, which usually means shorter tenancies and higher turnover. Who's the typical renter profile here, and what's been the actual vacancy rate?
- What's the average days-on-market for RENTAL listings here right now (not sales)? A rising rental-DOM trend means longer vacancies and softer asking-rent achievability than the comps imply.
- What's the recent tenant-quality profile in this submarket — average credit score on applications, eviction rate, late-payment / NSF rate, and stable-employment percentage? A property-management company in the area should have these aggregated.
- How much new for-sale + rental construction is in the pipeline within 1–3 miles? Heavy new supply typically softens prices + rents 12–24 months out; constrained supply supports both.
Investment metrics
- 1% rule
- 0.90% ✗
- Cap rate
- 7.48%
- Cash-on-cash
- 4.24%
- DSCR
- 1.19
- GRM
- 9.2
CMA / ARV
- ARV (median comp)
- $163,367
- List price
- $149,000
- Delta
- -8.79%
- Verdict
- FAIR
- Comps
- 20 within 1.0 mi
Show comp detail 12 sales within ~0.75 mi
| Address | Dist | Beds/Ba | Sqft | Sold | Price | $/sf | Match |
|---|---|---|---|---|---|---|---|
| 10 Culpepper St | 0.44mi | 3/1.5 | 1,373 (-4%) | 1mo | $159,900 | $116 | 70 |
| 14 Brown Ave | 0.10mi | 3/2.0 | 1,543 (+8%) | 18mo | $205,000 | $133 | 62 |
| 3 Meadow Dr | 0.59mi | 3/2.0 | 1,473 (+4%) | 4mo | $238,000 | $162 | 60 |
| 94 Wells Ave | 0.36mi | 3/2.0 | 1,432 (+1%) | 23mo | $180,000 | $126 | 59 |
| 15 Richardson Dr | 0.19mi | 3/2.0 | 1,573 (+10%) | 22mo | $141,000 | $90 | 52 |
| 127 Fairview Ln | 0.55mi | 3/2.0 | 1,540 (+8%) | 7mo | $135,000 | $88 | 51 |
| 15 Hall St | 0.48mi | 3/2.0 | 1,609 (+13%) | 4mo | $175,000 | $109 | 48 |
| 11 Holman St | 0.55mi | 4/2.0 (+1) | 1,350 (-5%) | 14mo | $169,000 | $125 | 45 |
| 3 Springdale Cir | 0.59mi | 3/1.5 | 1,273 (-10%) | 14mo | $118,000 | $93 | 41 |
| 3 Springdale | 0.59mi | 3/1.5 | 1,273 (-10%) | 14mo | $118,000 | $93 | 41 |
| 5 Hall St | 0.55mi | 3/2.0 | 1,575 (+11%) | 15mo | $250,000 | $159 | 40 |
| 28 Woodland Ct | 0.40mi | 3/2.0 | 1,244 (-13%) | 22mo | $149,000 | $120 | 38 |
Match score weights: distance 35% · size 25% · config 20% · recency 20%. Top-matched comps best support the ARV.
Projected returns pro-forma
10.0% appreciation · 3.0% rent growth · sell at horizon
- IRR
- 27.3%
- Equity multiple
- 3.17×
- Total profit
- $90,480
- Equity at exit
- $134,231
- IRR
- 23.9%
- Equity multiple
- 7.21×
- Total profit
- $258,975
- Equity at exit
- $289,474
Cash invested: $41,720 (down + closing). Projections, not guarantees.
Landlord ↔ Tenant lean methodology
- Overall (STATE)
- 90 Strongly Landlord-Friendly
- State Alabama
- 90 Strongly Landlord-Friendly · R+15
- County
- — inherits STATE
- City
- — inherits STATE
ZIP-level market 36322
- Home prices YoY
- 31.4%
- Active inventory
- 41
- Price-to-rent
- 9.2×
Monthly cashflow live
- Estimated rent
- $1,347 medium interval (Pro) →
- Mortgage (P&I)
- −$781
- Tax from tax record
- −$74 /mo · $885/yr
- Insurance
- −$62
- HOA
- −$0
- Vacancy / Maint / Mgmt
- −$283
- Net cashflow
- $147
Break-even live
UW: 25.0% down · 7.5% · 30yr · 1.5% tax · 5.0% vac · 8.0% maint · 8.0% mgmt
Financing live
Cash to close
- Down payment
- $37,250
- Closing costs
- $4,470
- Reserves months
- —
- Total cash needed
- —
Loan-product check · same deal, 3 products live
Conventional
25% down · 7.5% · 30yr
- Down + closing
- —
- Monthly P&I
- —
- Monthly cashflow
- —
- DSCR
- —
- Eligible?
- —
Personal DTI + credit; lowest rate.
DSCR
20% down · 8.5% · 30yr
- Down + closing
- —
- Monthly P&I
- —
- Monthly cashflow
- —
- DSCR
- —
- Eligible?
- —
No personal income docs; deal must DSCR.
Hard money
10% down · 12.0% · 12mo
- Down + closing
- —
- Monthly P&I
- —
- Monthly cashflow
- —
- DSCR
- —
- Eligible?
- —
Short-term bridge; refi at stabilization.
Listing history 18 events
-
2026-06-19days on market $149,000 Active 100 DOM
-
2026-06-18days on market $149,000 Active 99 DOM
-
2026-06-17days on market $149,000 Active 98 DOM
-
2026-06-16days on market $149,000 Active 97 DOM
-
2026-06-15days on market $149,000 Active 96 DOM
-
2026-06-14days on market $149,000 Active 94 DOM
-
2026-06-12days on market $149,000 Active 93 DOM
-
2026-06-09days on market $149,000 Active 90 DOM
-
2026-06-08days on market $149,000 Active 89 DOM
-
2026-06-07days on market $149,000 Active 88 DOM
-
2026-06-05days on market $149,000 Active 85 DOM
-
2026-06-03pricedays on market $149,000 Active 84 DOM
-
2026-06-02days on market $154,000 Active 83 DOM
-
2026-06-01days on market $154,000 Active 82 DOM
-
2026-05-31days on market $154,000 Active 81 DOM
-
2026-05-30days on market $154,000 Active 80 DOM
-
2026-05-08price $154,000 259-char remark
Show marketing remark (259 chars)
Move In Ready!! This 3 bedroom, 2 bath brick home has new water heater, new interior paint and carpet. Large family room. Spacious laundry room. Large lot with fenced in back yard. Roof new in 2019. New front steps. Hot water heater and central heat are gas.
-
2026-03-11$159,000 Active 259-char remark
Show marketing remark (259 chars)
Move In Ready!! This 3 bedroom, 2 bath brick home has new water heater, new interior paint and carpet. Large family room. Spacious laundry room. Large lot with fenced in back yard. Roof new in 2019. New front steps. Hot water heater and central heat are gas.
ⓘ Source: listings_history table (triggers on properties + properties_extension) + one-shot
backfill from property_details.listing_events for pre-trigger history.
Tax reassessment forecast AL · Resets to sale price
- Current annual tax
- $885 · $74/mo
- Projected year-2 tax
- $885 · $74/mo
- Expected delta
- $0/yr ($0/mo · 0.0%)
ⓘ Screening estimate from a state-policy table — verify with the county assessor before closing.
Climate risk First Street
- Flood 1/10 Low FEMA zone X (unshaded) · 0% chance over 30 yrs
- Wildfire 4/10 Moderate
- Heat 8/10 Severe 7 d/yr ≥106°F today · 20 d/yr by 30 yrs out
- Wind 8/10 Severe 99% chance of damaging wind over 30 yrs
- Air quality 1/10 Low 0 unhealthy d/yr today · 0 by 30 yrs out
Nearby sold comps map
Loading sold comps map…
Walkable amenities ~0.75 mi
Loading nearby amenities…
Taxation est. · year 1
- Rental income
- $16,169
- − Mortgage interest
- −$8,346
- − Property taxes
- −$885
- − Insurance
- −$745
- − Repairs & maintenance
- −$1,294
- − Management
- −$1,294
- − Depreciation
- −$4,335
- Taxable loss
- −$729
- Est. tax savings @ 24.0%
- +$175
- After-tax cash flow
- $1,942/yr
For passive investors: Depreciation is non-cash, so a rental often shows a tax loss while cash-flowing — sheltering income. Rental losses are passive: they offset passive income freely, and up to $25,000/yr can offset ordinary (W-2) income if you actively participate and your MAGI is under $100k (phasing out to $0 by $150k); unused losses carry forward. On sale, claimed depreciation is recaptured at up to 25%, and gains may owe capital-gains tax (a 1031 exchange can defer both). Figures are a year-1 estimate at your 24.0% rate — not tax advice; consult a CPA.
Schools (NCES district)
- District
- Daleville City
- NCES district ID
- 0101080
- Math proficiency
- 9% ▼ -18.00%
- Reading proficiency
- 37% ▲ 1.00%
- Median HH income
- $45,865
- Composite
- 19.89/100
- National rank
- #8687
- State rank
- #97 of 129 in AL
Livability — Daleville
- Score
- 61/100
- State rank
- #278
- US rank
- #18463
Category grades
Schools grade is shown separately in the Schools card above.
Census & demographics
- Census place
- Daleville, AL
- County
- Dale County · 7,959 people
- City population
- 7,740
- Metro
- Ozark, AL
- Population (ZIP)
- 7,959
- Household income
- $47,276
- Rent vs Own
- Severe rent burden
- 115.0
Population outlook (Dale County) Hauer SSP2
- Today (2025)
- 46,805 people
- By 2030
- 45,176 · -3.5%
- By 2040
- 41,523 · -11.3%
- By 2050
- 37,575 · -19.7%
- By 2075
- 28,931 · -38.2%
- By 2100
- 22,172 · -52.6%
Race, ethnicity, and origin ACS 2023
- Neighborhood character
- Diverse neighborhood (Simpson 0.59)
- Race & ethnicity
- White 59% Black 23% Two or more races 9% Hispanic / Latino 7% Asian 2% Native American 1%
- Hispanic origin (detail)
- Mexican 4% Puerto Rican 3%
- Common ancestry
- Lithuanian 3% Italian 2% Slovak 1%
- Foreign-born
- 5% · South Korea, China, Canada
- Languages at home
- 92% English-only · Spanish 4% Other Indo-European 1% Korean 1%
Political lean MEDSL · Dale
- 2024 margin
- Solid R (+52.3) · D 23.5% · R 75.8%
- 2008→2024 swing
- -7.7pp toward R · 2008: -44.6pp · 2024: -52.3pp
- All cycles
- 2024: R+52.3 2020: R+46.3 2016: R+50.4 2012: R+42.2 2008: R+44.6
Not yet ingested
- Civics
- —
Market trends
- HPI YoY
- ▲ 49.15%
- Current HPI
- 205.6
- Rent YoY
- —
- Metro
- Ozark, AL
- State GDP YoY
- ▲ 2.94%
- F500 in state
- 4
Industry mix (Fortune 500 HQ in AL)
| Industry | F500 HQs | Revenue |
|---|---|---|
| Financial Services | 1 | $8B |
|
||
| Healthcare | 1 | $5B |
|
||
Price history
-3.1% since first listed2 events — show timeline
- 2026-05-08 Price Changed $154,000 SAMLS
- 2026-03-11 Listed $159,000 SAMLS
Property tax history
+9.8%/yrLatest (2025): $885 · +6.7% YoY. Source: county tax records.
Cash-flow waterfall
monthlySold comps — $/sqft
last 12 mo · ≤1 miLoading sold comps…