 🏷️ Likely Rental
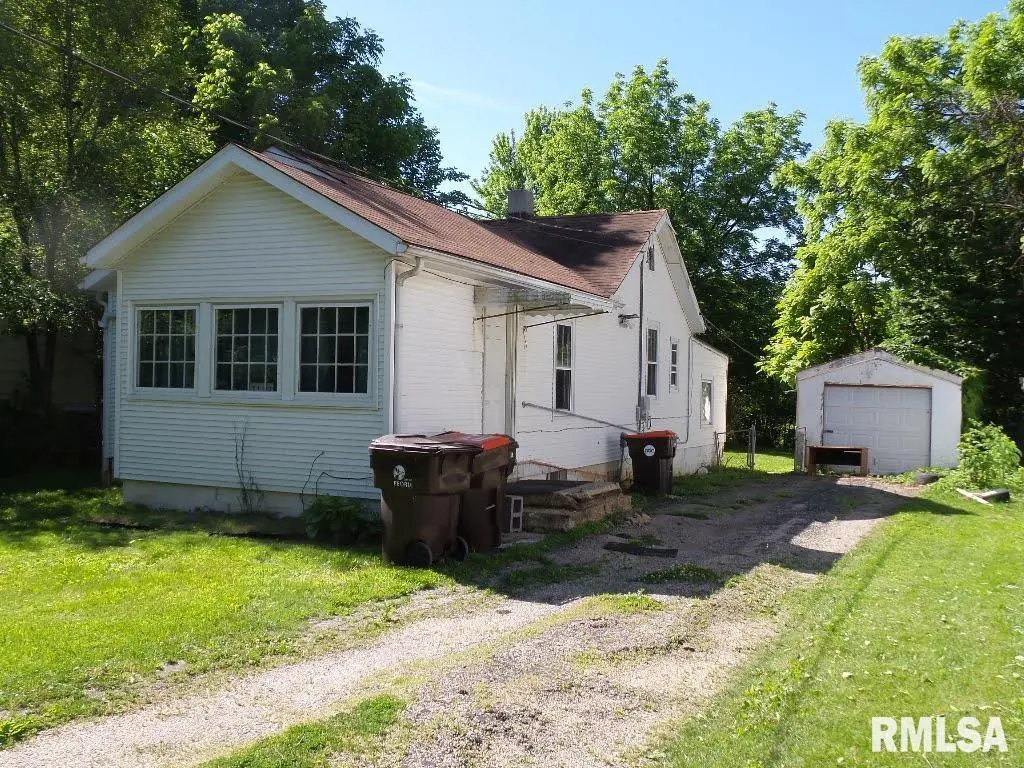
3112 Greenwood Pl · Peoria, IL
Flood risk 1/10 · Minimal
- FEMA flood zone
- X
- Chance of flooding over 30 yrs
- 0.0%
- Est. flood insurance / yr
- $473 – $860
Fire risk 1/10 · Minimal
- Est. fire insurance / yr
- $804 – $1,492
Heat risk 3/10 · Minor
- Hot days now (above 104°F)
- 7 days/yr
- Hot days in 30 yrs
- 16 days/yr
Wind risk 2/10 · Minimal
- Chance of severe wind over 30 yrs
- 1.0%
Air-quality risk 3/10 · Minor
- Unhealthy air days now
- 1 days/yr
- Unhealthy air days in 30 yrs
- 3 days/yr
Risk factors via First Street. Map © Google.
Why this score? — see what drove the B grade
The composite is a weighted blend of 9 inputs, each scored 0–100. Each bar is that input's sub-score; the figure is the points it added to the 100-point composite (weight × sub-score).
- Cash flow +30.0/30.0
- ARV discount +15.0/15.0
- 1% rule +10.0/10.0
- DSCR +10.0/10.0
- Livability +3.7/5.0
- Rent growth +2.5/5.0
- Condition / age +2.5/5.0
- Schools +1.1/10.0
- Appreciation +0.0/10.0
$65,000
🖨 Deal sheet 📄 Offer letter ✓ Due diligence
Listing remarks MLS
INVESTORS TAKE NOTE! QUICK CASH FLOW OPPORTUNITY! CURRENTLY RENTED FOR $650 PER MONTH! CENTRALLY LOCATED IN PEORIA NEAR SHOPPING, DINING & ENTERTAINMENT! TENANT PAYS RENT PLUS ALL UTILITIES! TAKE THE TOUR TODAY!
Key facts
- Newer hvac systems
- Large yard
- Full basement
Tags
Property features AI
Finance
- Other: Subdivision: Golden Acres; Zoned residential; Additional lot dimensions: 50 x 120 + 50 x 120
- HOA & community: No association fees
Exterior
- Parking: Detached 1-car garage
- Utilities: Public water; Public sewer
- Home design: Single-family residence; Built in 1940
- Construction: Shingle roof; Not new construction
- Exterior features: Level lot; Extra lot; Paved road access; Shingle roof
Interior
- Kitchen: Dishwasher
- Bedrooms: 2 bedrooms (both on main level)
- Flooring: Hardwood in living, dining, and kitchen areas; Laminate in bedrooms
- Bathrooms: 1 full bathroom
- Heating & cooling: Central air conditioning; Forced air heating; Gas water heater
- Interior features: Cable available; High-speed internet
Neighborhood map
What this means for you Summary
Snapshot
- This is a 2-bed/1.0-bath single-family listed at $65k.
Deal economics
- At list price, monthly cash flow is $364 ($4k/yr) — positive.
- The deal already cash-flows at list — no discount required.
- Meets the 1% rule at list price ($1k rent vs $65k).
- Recommended offer: $64k (1.5% below list) — sets the bar for market timing.
- Cap rate 13.0% vs local median 5.6% in Peoria — top-decile yield for the area; either an underpriced asset or a hidden risk that comps aren't pricing in. Stress-test before assuming the spread holds.
Location & tenants
- Location reads 73/100 on livability (#270 in IL) — a middle-class / working-renter tenant base. Strengths: commute A+, cost of living A+, housing A+; Watch: employment D+, crime F.
- Peoria SD 150 (urban): math 11% / reading 14% proficiency, ranked #554 of 620 in IL (top 89%) — low school quality limits family demand, transient renter base, plan for 1-2y turnover; 70% free/reduced lunch — lower-income household profile, screen leases tightly.
- Zoned schools: Richwoods High School (math 30% / reading 35%, grade F, #152 of 693 statewide, top 22%, 1,580 students, 0% FRL) — zoned schools average 0% FRL vs 70% district-wide (70 pts lower); this property's tenant base skews higher-income than the district average.
- Zoned-school proficiency averages 32% at this address vs 12% district-wide (+20 pts) — the actual schools serving this property are materially stronger than the Peoria SD 150 average implies; a family-tenant draw the district grade alone would hide.
- Market conditions: 127 active listings in the ZIP; 3 comparable units currently listed for rent nearby; rentals leasing fast (median 14d on market — plan ~1-2 weeks tenant-placement turnaround); solid renter incomes; 73 units permitted in Peoria County in 2024 (0 in 5+ unit buildings).
Forward outlook
- Local home prices are declining (-3.0%/yr); year-one equity from $449 of loan paydown is wiped out by about $2k of value loss. Plan a longer hold.
- Peoria County population projected at -11% by 2050 — secular population decline; favor cash flow + early exit over multi-decade hold.
- At projected returns (-3.0% appreciation + 3.0% rent growth), your $18k cash investment doubles in ~6 years — after that, you're playing with house money.
Negotiation context
- It's been on market 23 days — a 2% lower offer ($64k) is reasonable based on typical stale-listing flexibility.
- 3 sale attempts since 15y ago with the ask held roughly flat each time — persistent listings suggest the price (not the market) is what's stuck; bring a comps-based counter.
- Current owner paid $55k; 18% above their basis — modest negotiation headroom, anchor on the comps not their cost.
Risks & watch-outs
- Watch-outs: property tax is 3.5% of price; built in 1940 — expect roof / HVAC / electrical / plumbing capex.
Questions for the listing agent
- Built in 1940 — when were the roof, HVAC, electrical panel, plumbing, and water heater last replaced?
- Property tax is high relative to price — has the assessment been appealed recently, and will the sale trigger a re-assessment?
- Is there a deadline driving the sale (1031 exchange, divorce, estate, relocation)? That informs how much negotiation room exists.
- Schools are F-rated, which usually means shorter tenancies and higher turnover. Who's the typical renter profile here, and what's been the actual vacancy rate?
- Crime grade is F in this area — have there been break-ins, vandalism, or insurance claims at this property in the last 3 years? What carrier currently insures it and at what premium?
- What's the average days-on-market for RENTAL listings here right now (not sales)? A rising rental-DOM trend means longer vacancies and softer asking-rent achievability than the comps imply.
- What's the recent tenant-quality profile in this submarket — average credit score on applications, eviction rate, late-payment / NSF rate, and stable-employment percentage? A property-management company in the area should have these aggregated.
- How much new for-sale + rental construction is in the pipeline within 1–3 miles? Heavy new supply typically softens prices + rents 12–24 months out; constrained supply supports both.
Investment metrics
- 1% rule
- 1.79% ✓
- Cap rate
- 13.02%
- Cash-on-cash
- 24.02%
- DSCR
- 2.07
- GRM
- 4.7
CMA / ARV
- ARV (on-the-fly)
- $106,428
- Comps found
- 6
Show comp detail 6 sales within ~0.75 mi
| Address | Dist | Beds/Ba | Sqft | Sold | Price | $/sf | Match |
|---|---|---|---|---|---|---|---|
| 2627 W Eugenie Ave | 0.37mi | 2/1.0 | 761 (+5%) | 6mo | $115,000 | $151 | 69 |
| 4425 N Carola Ct | 0.47mi | 2/1.0 | 768 (+6%) | 9mo | $95,000 | $124 | 60 |
| 5110 N Hamilton Rd | 0.70mi | 2/1.0 | 720 (-1%) | 9mo | $84,000 | $117 | 59 |
| 3526 W Sylvan Ln | 0.41mi | 1/1.0 (-1) | 696 (-4%) | 24mo | $36,828 | $53 | 50 |
| 5225 N Hamilton Rd | 0.75mi | 2/1.0 | 768 (+6%) | 8mo | $120,000 | $156 | 48 |
| 2731 W Overhill Rd | 0.69mi | 2/1.0 | 780 (+8%) | 14mo | $115,000 | $147 | 43 |
Match score weights: distance 35% · size 25% · config 20% · recency 20%. Top-matched comps best support the ARV.
Projected returns pro-forma
-3.0% appreciation · 3.0% rent growth · sell at horizon
- IRR
- 17.3%
- Equity multiple
- 1.70×
- Total profit
- $12,752
- Equity at exit
- $9,692
- IRR
- 25.9%
- Equity multiple
- 3.27×
- Total profit
- $41,319
- Equity at exit
- $5,620
Cash invested: $18,200 (down + closing). Projections, not guarantees.
Landlord ↔ Tenant lean methodology
- Overall (STATE)
- 43 Moderately Tenant-Leaning
- State Illinois
- 43 Moderately Tenant-Leaning · D+7
- County
- — inherits STATE
- City
- — inherits STATE
ZIP-level market 61615
- Home prices YoY
- -32.2%
- Active inventory
- 127
- Price-to-rent
- 4.7×
Monthly cashflow live
- Estimated rent
- $1,165 medium interval (Pro) →
- Mortgage (P&I)
- −$341
- Tax from tax record
- −$188 /mo · $2,253/yr
- Insurance
- −$27
- HOA
- −$0
- Vacancy / Maint / Mgmt
- −$245
- Net cashflow
- $364
Break-even live
UW: 25.0% down · 7.5% · 30yr · 1.5% tax · 5.0% vac · 8.0% maint · 8.0% mgmt
Financing live
Cash to close
- Down payment
- $16,250
- Closing costs
- $1,950
- Reserves months
- —
- Total cash needed
- —
Loan-product check · same deal, 3 products live
Conventional
25% down · 7.5% · 30yr
- Down + closing
- —
- Monthly P&I
- —
- Monthly cashflow
- —
- DSCR
- —
- Eligible?
- —
Personal DTI + credit; lowest rate.
DSCR
20% down · 8.5% · 30yr
- Down + closing
- —
- Monthly P&I
- —
- Monthly cashflow
- —
- DSCR
- —
- Eligible?
- —
No personal income docs; deal must DSCR.
Hard money
10% down · 12.0% · 12mo
- Down + closing
- —
- Monthly P&I
- —
- Monthly cashflow
- —
- DSCR
- —
- Eligible?
- —
Short-term bridge; refi at stabilization.
Rent comps 3 comps
| Address | Beds | Baths | Sqft | Rent | $/sqft | DOM | Units | Dist |
|---|---|---|---|---|---|---|---|---|
| 2805 W Larchmont Ln Peoria, IL | 1.0–2.0 | 1.0 | 695 | $1,060 | $1.53 | 13d | 3 | 0.63mi |
| 2979 W Cannes Dr Peoria, IL | 1.0–2.0 | 1.0–1.5 | 800 | $1,150 | $1.44 | 13d | 1 | 0.86mi |
| 4010 N Brandywine Dr Peoria, IL | 1.0–2.0 | 1.0–2.0 | 797 | $1,082 | $1.36 | 13d | 17 | 1.33mi |
Listing history 26 events
-
2026-06-19days on market $65,000 Active 23 DOM
-
2026-06-18days on market $65,000 Active 22 DOM
-
2026-06-17days on market $65,000 Active 21 DOM
-
2026-06-16days on market $65,000 Active 20 DOM
-
2026-06-15days on market $65,000 Active 19 DOM
-
2026-06-14days on market $65,000 Active 17 DOM
-
2026-06-13days on market $65,000 Active 16 DOM
-
2026-06-10days on market $65,000 Active 14 DOM
-
2026-06-09days on market $65,000 Active 13 DOM
-
2026-06-08days on market $65,000 Active 12 DOM
-
2026-06-07days on market $65,000 Active 11 DOM
-
2026-06-03days on market $65,000 Active 7 DOM
-
2026-06-02days on market $65,000 Active 6 DOM
-
2026-06-01days on market $65,000 Active 5 DOM
-
2026-05-31days on market $65,000 Active 4 DOM
-
2026-05-30days on market $65,000 Active 3 DOM
-
2026-05-27$65,000 Active
-
2022-06-09soldstatus $54,900
-
2022-06-03soldstatus $54,900 Closed 215-char remark
Show marketing remark (215 chars)
INVESTORS TAKE NOTE! QUICK CASH FLOW OPPORTUNITY! CURRENTLY RENTED FOR $650 PER MONTH! CENTRALLY LOCATED IN PEORIA NEAR SHOPPING, DINING & ENTERTAINMENT! TENANT PAYS RENT PLUS ALL UTILITIES! TAKE THE TOUR TODAY!
-
2022-05-08status Pending 215-char remark
Show marketing remark (215 chars)
INVESTORS TAKE NOTE! QUICK CASH FLOW OPPORTUNITY! CURRENTLY RENTED FOR $650 PER MONTH! CENTRALLY LOCATED IN PEORIA NEAR SHOPPING, DINING & ENTERTAINMENT! TENANT PAYS RENT PLUS ALL UTILITIES! TAKE THE TOUR TODAY!
-
2022-04-29$54,900 Active 215-char remark
Show marketing remark (215 chars)
INVESTORS TAKE NOTE! QUICK CASH FLOW OPPORTUNITY! CURRENTLY RENTED FOR $650 PER MONTH! CENTRALLY LOCATED IN PEORIA NEAR SHOPPING, DINING & ENTERTAINMENT! TENANT PAYS RENT PLUS ALL UTILITIES! TAKE THE TOUR TODAY!
-
2021-08-06historical
-
2021-08-06historical
-
2011-08-16soldstatus $30,000
-
2011-08-15soldstatus $30,000
-
2011-05-04$37,000
ⓘ Source: listings_history table (triggers on properties + properties_extension) + one-shot
backfill from property_details.listing_events for pre-trigger history.
Tax reassessment forecast IL · Partial reset (capped growth)
- Current annual tax
- $2,253 · $188/mo
- Projected year-2 tax
- $2,253 · $188/mo
- Expected delta
- $0/yr ($0/mo · 0.0%)
ⓘ Screening estimate from a state-policy table — verify with the county assessor before closing.
Climate risk First Street
- Flood 1/10 Low FEMA zone X · 0% chance over 30 yrs
- Wildfire 1/10 Low
- Heat 3/10 Moderate 7 d/yr ≥104°F today · 16 d/yr by 30 yrs out
- Wind 2/10 Low 100% chance of damaging wind over 30 yrs
- Air quality 3/10 Moderate 1 unhealthy d/yr today · 3 by 30 yrs out
Nearby sold comps map
Loading sold comps map…
Walkable amenities ~0.75 mi
Loading nearby amenities…
Taxation est. · year 1
- Rental income
- $13,975
- − Mortgage interest
- −$3,641
- − Property taxes
- −$2,253
- − Insurance
- −$325
- − Repairs & maintenance
- −$1,118
- − Management
- −$1,118
- − Depreciation
- −$1,891
- Taxable income
- $3,629
- Est. tax owed @ 24.0%
- −$871
- After-tax cash flow
- $3,501/yr
For passive investors: Depreciation is non-cash, so a rental often shows a tax loss while cash-flowing — sheltering income. Rental losses are passive: they offset passive income freely, and up to $25,000/yr can offset ordinary (W-2) income if you actively participate and your MAGI is under $100k (phasing out to $0 by $150k); unused losses carry forward. On sale, claimed depreciation is recaptured at up to 25%, and gains may owe capital-gains tax (a 1031 exchange can defer both). Figures are a year-1 estimate at your 24.0% rate — not tax advice; consult a CPA.
Schools (NCES district)
- District
- Peoria SD 150
- NCES district ID
- 1731230
- Math proficiency
- 11% ▼ -5.00%
- Reading proficiency
- 14% ▼ -4.00%
- Median HH income
- $41,951
- Composite
- 10.92/100
- National rank
- #9751
- State rank
- #554 of 620 in IL
Livability — Peoria
- Score
- 73/100
- State rank
- #270
- US rank
- #5096
Category grades
Schools grade is shown separately in the Schools card above.
Census & demographics
- Census place
- Peoria, IL
- County
- Peoria County · 120,495 people
- City population
- 114,670
- Metro
- Peoria, IL
- Population (ZIP)
- 23,523
- Household income
- $79,817
- Rent vs Own
- Severe rent burden
- 833.0
Population outlook (Peoria County) Hauer SSP2
- Today (2025)
- 183,007 people
- By 2030
- 179,643 · -1.8%
- By 2040
- 171,782 · -6.1%
- By 2050
- 163,508 · -10.7%
- By 2075
- 140,178 · -23.4%
- By 2100
- 114,493 · -37.4%
Race, ethnicity, and origin ACS 2023
- Neighborhood character
- Predominantly White (72%)
- Race & ethnicity
- White 72% Asian 10% Black 8% Hispanic / Latino 7% Two or more races 5%
- Hispanic origin (detail)
- Mexican 5%
- Common ancestry
- Italian 3% Romanian 3% Lithuanian 2%
- Foreign-born
- 13% · China, Canada, Jamaica
- Languages at home
- 83% English-only · Other Indo-European 4% Spanish 4% Chinese 3%
Political lean MEDSL · Peoria
- 2024 margin
- Toss-up / Even · D 51.5% · R 46.9% · Other 1.6%
- 2008→2024 swing
- -9.2pp toward R · 2008: 13.9pp · 2024: 4.7pp
- All cycles
- 2024: D+4.7 2020: D+6.3 2016: D+2.8 2012: D+4.4 2008: D+13.9
Not yet ingested
- Civics
- —
Market trends
- HPI YoY
- ▼ -79.30%
- Current HPI
- 166.9745
- Rent YoY
- —
- Metro
- Peoria, IL
- State GDP YoY
- ▲ 1.59%
- F500 in state
- 60
Industry mix (Fortune 500 HQ in IL)
| Industry | F500 HQs | Revenue |
|---|---|---|
| Insurance | 4 | $201B |
|
||
| Consumer Goods | 4 | $87B |
|
||
| Industrial Machinery | 3 | $64B |
|
||
| Healthcare | 2 | $55B |
|
||
| Retail / Pharmacy | 1 | $148B |
|
||
| Agriculture / Food | 1 | $86B |
|
||
Price history
+75.7% since first listed10 events — show timeline
- 2026-05-27 Listed $65,000 RMLSA as Distributed by MLS Grid
- 2022-06-09 Sold (Public Records) $54,900 Public Records
- 2022-06-03 Sold (MLS) $54,900 RMLSA as Distributed by MLS Grid
- 2022-05-08 Pending — RMLSA as Distributed by MLS Grid
- 2022-04-29 Listed $54,900 RMLSA as Distributed by MLS Grid
- 2021-08-06 Listing Removed — RMLSA as Distributed by MLS Grid
- 2021-08-06 Listing Removed — RMLSA as Distributed by MLS Grid
- 2011-08-16 Sold (Public Records) $30,000 Public Records
- 2011-08-15 Sold (MLS) $30,000 RMLSA as Distributed by MLS Grid
- 2011-05-04 Listed $37,000 RMLSA as Distributed by MLS Grid
Property tax history
+1.9%/yrLatest (2024): $2,253 · +4.8% YoY. Source: county tax records.
Cash-flow waterfall
monthlySold comps — $/sqft
last 12 mo · ≤1 miLoading sold comps…