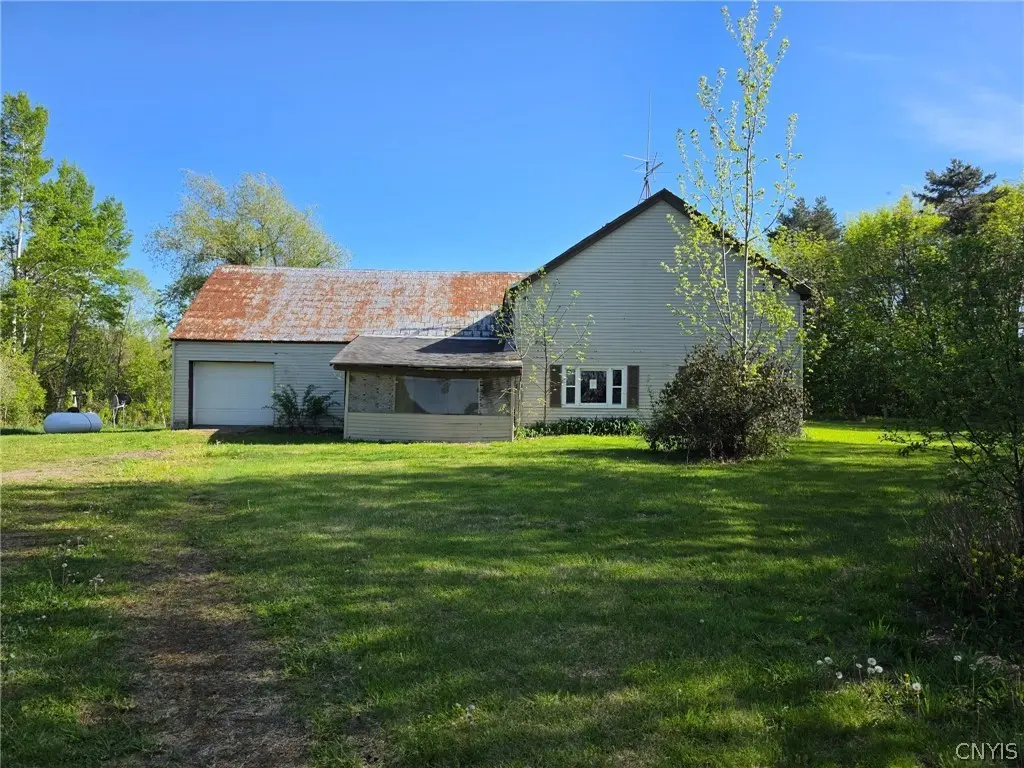
2392 State Highway 11b · Parishville, NY
Flood risk 1/10 · Minimal
- FEMA flood zone
- X
- Chance of flooding over 30 yrs
- 0.0%
- Est. flood insurance / yr
- $507 – $1,088
Fire risk 3/10 · Minor
- Est. fire insurance / yr
- $691 – $1,283
Heat risk 1/10 · Minimal
- Hot days now (above 91°F)
- 7 days/yr
- Hot days in 30 yrs
- 15 days/yr
Wind risk 1/10 · Minimal
- Chance of severe wind over 30 yrs
- —
Air-quality risk 1/10 · Minimal
- Unhealthy air days now
- 0 days/yr
- Unhealthy air days in 30 yrs
- 0 days/yr
Risk factors via First Street. Map © Google.
Why this score? — see what drove the A- grade
The composite is a weighted blend of 9 inputs, each scored 0–100. Each bar is that input's sub-score; the figure is the points it added to the 100-point composite (weight × sub-score).
- Cash flow +30.0/30.0
- 1% rule +10.0/10.0
- DSCR +10.0/10.0
- Appreciation +10.0/10.0
- ARV discount +7.5/15.0
- Schools +5.0/10.0
- Livability +3.0/5.0
- Rent growth +2.5/5.0
- Condition / age +2.5/5.0
$59,900
🖨 Deal sheet 📄 Offer letter ✓ Due diligence
Listing remarks
Built in 1940 this 1684 square foot home is located on 1.1 acres set back off the road. This home offers 4 bedrooms 1 full bathroom and has a lot of potential. Large country kitchen with plenty of cabinets for storage. Large living room, 3 main floor bedrooms and a 4th bedroom on the second level. Laundry on main floor. This home has a large, attached garage with a loft area for storage.
Key facts
- Country kitchen
- 1.1 acres
- Attached garage
Tags
Property features AI
Exterior
- Parking: Attached garage (1 car)
- Utilities: Well water; Septic tank
- Home design: Single-story property; Vinyl siding
- Construction: Vinyl siding construction; Existing (previously built)
- Exterior features: Dirt driveway; Irregular, rural lot; Lot dimensions approximately 87 x 512
Interior
- Kitchen: Dishwasher; Gas oven; Gas range; Refrigerator
- Bedrooms: 3 bedrooms on the main level
- Flooring: Carpet; Tile; Varies
- Bathrooms: 1 full bathroom on the main level
- Heating & cooling: Propane forced-air heating
- Interior features: Eat-in kitchen; Separate/formal living room; Country kitchen; Workshop
- Laundry & utility: Main level laundry; Electric water heater
Neighborhood map
What this means for you Summary
Snapshot
- This is a 4-bed/1.0-bath single-family listed at $60k.
Deal economics
- At list price, monthly cash flow is $609 ($7k/yr) — positive.
- The deal already cash-flows at list — no discount required.
- Meets the 1% rule at list price ($1k rent vs $60k).
- Recommended offer: $59k (1.5% below list) — sets the bar for market timing.
Location & tenants
- Location reads 60/100 on livability (#997 in NY) — a middle-class / working-renter tenant base. Strengths: cost of living A+; Watch: employment C-, health & safety C-, crime F.
- Parishville-Hopkinton Central School District (rural): math 65% / reading 51% proficiency, ranked #326 of 755 in NY (top 43%) — acceptable for families but not a draw, mixed tenant base, ~2y average lease.
- Market conditions: 117 active listings in the ZIP; 215 units permitted in St. Lawrence County in 2024 (0 in 5+ unit buildings).
Forward outlook
- In year one you build about $6k of equity ($414 loan paydown + $6k appreciation (10.0% local appreciation)).
- St. Lawrence County population projected at -14% by 2050 — secular population decline; favor cash flow + early exit over multi-decade hold.
- At projected returns (10.0% appreciation + 3.0% rent growth), your $17k cash investment doubles in ~2 years — after that, you're playing with house money.
- By year 6, paydown + projected appreciation supports a ~$38k cash-out refi (75% LTV) — recoverable capital for the next deal without selling this one.
Negotiation context
- It's been on market 26 days — a 2% lower offer ($59k) is reasonable based on typical stale-listing flexibility.
Risks & watch-outs
- Watch-outs: property tax is 3.8% of price; built in 1940 — expect roof / HVAC / electrical / plumbing capex.
Questions for the listing agent
- Built in 1940 — when were the roof, HVAC, electrical panel, plumbing, and water heater last replaced?
- Property tax is high relative to price — has the assessment been appealed recently, and will the sale trigger a re-assessment?
- Is there a deadline driving the sale (1031 exchange, divorce, estate, relocation)? That informs how much negotiation room exists.
- Schools are B-rated — typically a magnet for longer-tenancy family renters. What's the average tenant stay here, and is there a school-zone premium baked into asking?
- Crime grade is F in this area — have there been break-ins, vandalism, or insurance claims at this property in the last 3 years? What carrier currently insures it and at what premium?
- What's the average days-on-market for RENTAL listings here right now (not sales)? A rising rental-DOM trend means longer vacancies and softer asking-rent achievability than the comps imply.
- What's the recent tenant-quality profile in this submarket — average credit score on applications, eviction rate, late-payment / NSF rate, and stable-employment percentage? A property-management company in the area should have these aggregated.
- How much new for-sale + rental construction is in the pipeline within 1–3 miles? Heavy new supply typically softens prices + rents 12–24 months out; constrained supply supports both.
Investment metrics
- 1% rule
- 2.40% ✓
- Cap rate
- 18.49%
- Cash-on-cash
- 43.57%
- DSCR
- 2.94
- GRM
- 3.5
CMA / ARV
No comps found within radius.
Projected returns pro-forma
10.0% appreciation · 3.0% rent growth · sell at horizon
- IRR
- 58.2%
- Equity multiple
- 5.26×
- Total profit
- $71,501
- Equity at exit
- $53,963
- IRR
- 51.8%
- Equity multiple
- 11.75×
- Total profit
- $180,241
- Equity at exit
- $116,373
Cash invested: $16,772 (down + closing). Projections, not guarantees.
Landlord ↔ Tenant lean methodology
- Overall (STATE)
- 15 Strongly Tenant-Friendly
- State New York
- 15 Strongly Tenant-Friendly · D+10
- County
- — inherits STATE
- City
- — inherits STATE
ZIP-level market 13676
- Home prices YoY
- 17.7%
- Active inventory
- 117
- Price-to-rent
- 3.5×
Monthly cashflow live
- Estimated rent
- $1,439 medium interval (Pro) →
- Mortgage (P&I)
- −$314
- Tax from tax record
- −$189 /mo · $2,268/yr
- Insurance
- −$25
- HOA
- −$0
- Vacancy / Maint / Mgmt
- −$302
- Net cashflow
- $609
Break-even live
UW: 25.0% down · 7.5% · 30yr · 1.5% tax · 5.0% vac · 8.0% maint · 8.0% mgmt
Financing live
Cash to close
- Down payment
- $14,975
- Closing costs
- $1,797
- Reserves months
- —
- Total cash needed
- —
Loan-product check · same deal, 3 products live
Conventional
25% down · 7.5% · 30yr
- Down + closing
- —
- Monthly P&I
- —
- Monthly cashflow
- —
- DSCR
- —
- Eligible?
- —
Personal DTI + credit; lowest rate.
DSCR
20% down · 8.5% · 30yr
- Down + closing
- —
- Monthly P&I
- —
- Monthly cashflow
- —
- DSCR
- —
- Eligible?
- —
No personal income docs; deal must DSCR.
Hard money
10% down · 12.0% · 12mo
- Down + closing
- —
- Monthly P&I
- —
- Monthly cashflow
- —
- DSCR
- —
- Eligible?
- —
Short-term bridge; refi at stabilization.
Listing history 15 events
-
2026-06-18days on market $59,900 Active 26 DOM
-
2026-06-17days on market $59,900 Active 25 DOM
-
2026-06-16days on market $59,900 Active 24 DOM
-
2026-06-15days on market $59,900 Active 23 DOM
-
2026-06-13days on market $59,900 Active 21 DOM
-
2026-06-12days on market $59,900 Active 20 DOM
-
2026-06-09days on market $59,900 Active 17 DOM
-
2026-06-08days on market $59,900 Active 16 DOM
-
2026-06-07days on market $59,900 Active 15 DOM
-
2026-06-07days on market $59,900 Active 14 DOM
-
2026-06-04days on market $59,900 Active 11 DOM
-
2026-06-02days on market $59,900 Active 10 DOM
-
2026-06-01days on market $59,900 Active 9 DOM
-
2026-05-31days on market $59,900 Active 8 DOM
-
2026-05-23$59,900 Active
ⓘ Source: listings_history table (triggers on properties + properties_extension) + one-shot
backfill from property_details.listing_events for pre-trigger history.
Tax reassessment forecast NY · Partial reset (capped growth)
- Current annual tax
- $2,268 · $189/mo
- Projected year-2 tax
- $2,268 · $189/mo
- Expected delta
- $0/yr ($0/mo · 0.0%)
ⓘ Screening estimate from a state-policy table — verify with the county assessor before closing.
Climate risk First Street
- Flood 1/10 Low FEMA zone X · 0% chance over 30 yrs
- Wildfire 3/10 Moderate
- Heat 1/10 Low 7 d/yr ≥91°F today · 15 d/yr by 30 yrs out
- Wind 1/10 Low
- Air quality 1/10 Low 0 unhealthy d/yr today · 0 by 30 yrs out
Nearby sold comps map
Loading sold comps map…
Walkable amenities ~0.75 mi
Loading nearby amenities…
Taxation est. · year 1
- Rental income
- $17,272
- − Mortgage interest
- −$3,355
- − Property taxes
- −$2,268
- − Insurance
- −$300
- − Repairs & maintenance
- −$1,382
- − Management
- −$1,382
- − Depreciation
- −$1,743
- Taxable income
- $6,843
- Est. tax owed @ 24.0%
- −$1,642
- After-tax cash flow
- $5,665/yr
For passive investors: Depreciation is non-cash, so a rental often shows a tax loss while cash-flowing — sheltering income. Rental losses are passive: they offset passive income freely, and up to $25,000/yr can offset ordinary (W-2) income if you actively participate and your MAGI is under $100k (phasing out to $0 by $150k); unused losses carry forward. On sale, claimed depreciation is recaptured at up to 25%, and gains may owe capital-gains tax (a 1031 exchange can defer both). Figures are a year-1 estimate at your 24.0% rate — not tax advice; consult a CPA.
Schools (NCES district)
- District
- Parishville-Hopkinton Central School District
- NCES district ID
- 3622440
- Math proficiency
- 65% ▲ 10.00%
- Reading proficiency
- 51% ▬ 0.00%
- Median HH income
- $43,130
- Composite
- 50.48/100
- National rank
- #3989
- State rank
- #326 of 755 in NY
Livability — Parishville
- Score
- 60/100
- State rank
- #997
- US rank
- #19460
Category grades
Schools grade is shown separately in the Schools card above.
Census & demographics
- Population (ZIP)
- 13,408
Population outlook (St. Lawrence County) Hauer SSP2
- Today (2025)
- 110,027 people
- By 2030
- 107,455 · -2.3%
- By 2040
- 100,492 · -8.7%
- By 2050
- 94,254 · -14.3%
- By 2075
- 80,175 · -27.1%
- By 2100
- 63,140 · -42.6%
Race, ethnicity, and origin ACS 2023
- Neighborhood character
- Predominantly White (90%)
- Race & ethnicity
- White 90% Two or more races 4% Asian 3% Hispanic / Latino 2% Black 2%
- Common ancestry
- Lithuanian 6% Romanian 4% Iranian 2%
- Foreign-born
- 7% · Canada, China
- Languages at home
- 94% English-only · Spanish 2% Other Indo-European 1% French/Haitian/Cajun 1%
Political lean MEDSL · St. Lawrence
- 2024 margin
- R (+18.0) · D 41.0% · R 59.0%
- 2008→2024 swing
- -34.3pp toward R · 2008: 16.3pp · 2024: -18.0pp
- All cycles
- 2024: R+18.0 2020: R+11.7 2016: R+10.8 2012: D+16.6 2008: D+16.3
Not yet ingested
- Civics
- —
Market trends
- HPI YoY
- ▲ 48.01%
- Current HPI
- 318.7704
- Rent YoY
- —
- Metro
- —
- State GDP YoY
- ▲ 2.60%
- F500 in state
- 92
Industry mix (Fortune 500 HQ in NY)
| Industry | F500 HQs | Revenue |
|---|---|---|
| Financial Services | 10 | $950B |
|
||
| Consumer Goods | 9 | $162B |
|
||
| Insurance | 4 | $225B |
|
||
| Telecommunications | 2 | $144B |
|
||
| Pharmaceuticals | 2 | $112B |
|
||
| Media / Entertainment | 2 | $69B |
|
||
Price history
1 event — show timeline
- 2026-05-23 Listed $59,900 CNYIS
Property tax history
+8.7%/yrLatest (2025): $2,268 · +1.9% YoY. Source: county tax records.
Cash-flow waterfall
monthlySold comps — $/sqft
last 12 mo · ≤1 miLoading sold comps…