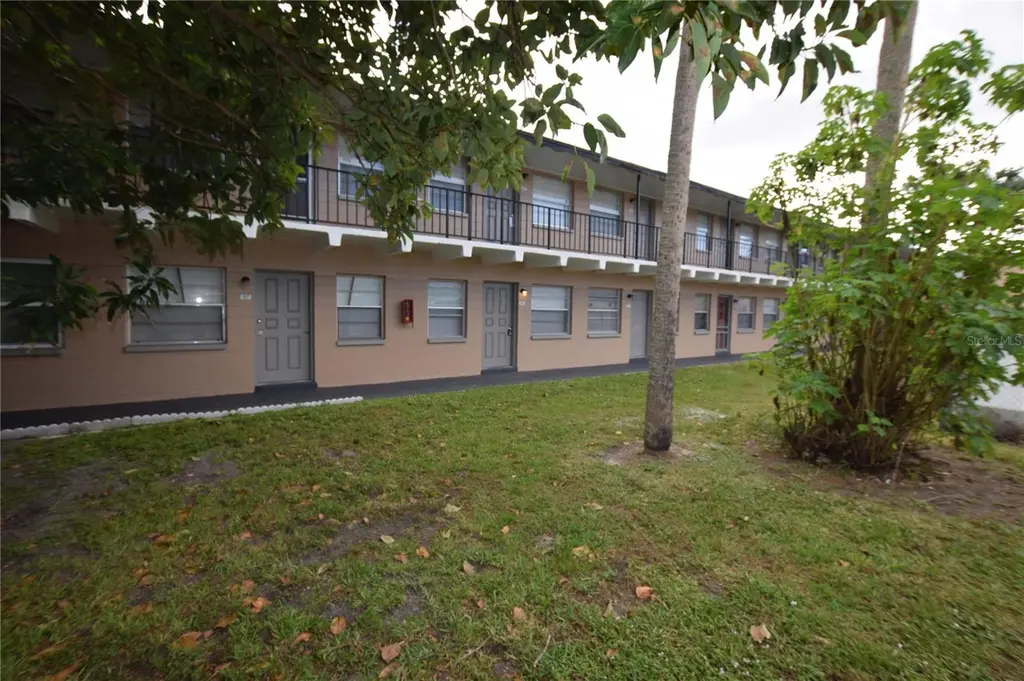
1711 Dixon Blvd #198 · Cocoa, FL
Flood risk 6/10 · Moderate
- FEMA flood zone
- X (unshaded)
- Chance of flooding over 30 yrs
- 0.71%
- Est. flood insurance / yr
- $507 – $1,088
Fire risk 5/10 · Moderate
- Est. fire insurance / yr
- $947 – $1,759
Heat risk 10/10 · Severe
- Hot days now (above 106°F)
- 7 days/yr
- Hot days in 30 yrs
- 23 days/yr
Wind risk 10/10 · Severe
- Chance of severe wind over 30 yrs
- 99.0%
Air-quality risk 1/10 · Minimal
- Unhealthy air days now
- 0 days/yr
- Unhealthy air days in 30 yrs
- 0 days/yr
Risk factors via First Street. Map © Google.
Why this score? — see what drove the B- grade
The composite is a weighted blend of 9 inputs, each scored 0–100. Each bar is that input's sub-score; the figure is the points it added to the 100-point composite (weight × sub-score).
- Cash flow +27.6/30.0
- 1% rule +10.0/10.0
- DSCR +9.7/10.0
- ARV discount +7.5/15.0
- Schools +4.7/10.0
- Livability +3.6/5.0
- Rent growth +3.5/5.0
- Condition / age +2.5/5.0
- Appreciation +0.0/10.0
$53,000
🖨 Deal sheet 📄 Offer letter ✓ Due diligence
Listing remarks
1 Bedroom 1 bath condo located in Cocoa FL. this condo can be an investment opportunity or your cozy home . Allen Condo apartment is located near the Cape Canaveral area, close to dining, shopping areas and the beaches. The community offers a pool, well maintained complex.
Key facts
- Near cape canaveral
- Close to dining
- Close to shopping
Tags
Property features AI
Finance
- Other: Lot served by asphalt roads; Lot area recorded as 6.69 acres (property-level detail)
- Financial info: Lease restrictions apply
- HOA & community: Monthly HOA fee of $284.06; HOA includes pool and water; Association approval required; Buyer approval required for the community; Pets allowed with breed restrictions
Exterior
- Utilities: Public water; Public sewer; Cable available
- Home design: Residential condominium; South-facing; One-level unit (floor 1); Two-story building
- Construction: Block construction; Shingle roof; Slab foundation; Built within a building identified as 1711
- Exterior features: Other exterior features
Interior
- Kitchen: Range; Refrigerator
- Bedrooms: 1 bedroom
- Flooring: Ceramic tile; Laminate
- Bathrooms: 1 full bathroom
- Heating & cooling: Ductless heating; Wall/Window air conditioning units
- Interior features: Ceiling fans
- Laundry & utility: Common area laundry
Neighborhood map
What this means for you Summary
Snapshot
- This is a 1-bed/1.0-bath condo listed at $53k.
Deal economics
- At list price, monthly cash flow is $158 ($2k/yr) — positive.
- The deal already cash-flows at list — no discount required.
- Meets the 1% rule at list price ($1k rent vs $53k).
- Recommended offer: $51k (3.0% below list) — sets the bar for market timing.
Location & tenants
- Location reads 72/100 on livability (#344 in FL) — a middle-class / working-renter tenant base. Strengths: commute A+, cost of living A+, housing A+; Watch: crime F, amenities F, employment D-.
- Brevard (suburban): math 53% / reading 57% proficiency, ranked #19 of 73 in FL (top 26%) — acceptable for families but not a draw, mixed tenant base, ~2y average lease.
- Market conditions: Rents rising fast (+4.1%/yr); 167 active listings in the ZIP; lower-income renter base — watch delinquency; 4,602 units permitted in Brevard County in 2024 (702 in 5+ unit buildings).
Forward outlook
- Local home prices are declining (-3.0%/yr); year-one equity from $366 of loan paydown is wiped out by about $2k of value loss. Plan a longer hold.
- Brevard County population projected at +15% by 2050 — modest demand growth; plan on rents tracking national, not racing it.
- At projected returns (-3.0% appreciation + 4.1% rent growth), your $15k cash investment doubles in ~8 years — after that, you're playing with house money.
Negotiation context
- It's been on market 53 days — a 3% lower offer ($51k) is reasonable based on typical stale-listing flexibility.
- 7 sale attempts since 3y ago; this cycle's ask is 6525% above the opening price — seller raised mid-cycle; expect resistance to lowballs.
- Current owner paid $31k; list at $53k implies a 71% gain — meaningful room to come down on a strong offer.
Risks & watch-outs
- Watch-outs: HOA is 27% of rent.
- Climate carrying-cost: major flood risk; severe wind risk, 99% chance of damaging wind over 30y; moderate wildfire risk; extreme-heat days projected 7→23/yr by 2055 (HVAC capex compounding) — expect insurance premiums to compound above CPI over the hold.
Questions for the listing agent
- It's been on market 53 days. Have you received any prior offers? Is the seller open to a 3% concession, seller financing, or rate buy-down credit?
- Built in 1966 — when were the roof, HVAC, electrical panel, plumbing, and water heater last replaced?
- What does the HOA fee cover, when was the last increase, and are there any pending special assessments or reserve-fund shortfalls?
- Any open or pending special assessments — roof, HVAC, plumbing, elevator, façade? What's the per-unit balance and payoff schedule, and is the seller paying it off at close or rolling it to the buyer?
- Is there a deadline driving the sale (1031 exchange, divorce, estate, relocation)? That informs how much negotiation room exists.
- Schools are B-rated — typically a magnet for longer-tenancy family renters. What's the average tenant stay here, and is there a school-zone premium baked into asking?
- Crime grade is F in this area — have there been break-ins, vandalism, or insurance claims at this property in the last 3 years? What carrier currently insures it and at what premium?
- What's the average days-on-market for RENTAL listings here right now (not sales)? A rising rental-DOM trend means longer vacancies and softer asking-rent achievability than the comps imply.
- What's the recent tenant-quality profile in this submarket — average credit score on applications, eviction rate, late-payment / NSF rate, and stable-employment percentage? A property-management company in the area should have these aggregated.
- How much new apartment / multifamily construction is in the pipeline within 1–3 miles? Heavy new supply (>2% of stock underway) typically softens rents 12–24 months out; light construction supports rent growth.
Investment metrics
- 1% rule
- 1.97% ✓
- Cap rate
- 9.88%
- Cash-on-cash
- 12.80%
- DSCR
- 1.57
- GRM
- 4.2
CMA / ARV
No comps found within radius.
Projected returns pro-forma
-3.0% appreciation · 4.13% rent growth · sell at horizon
- IRR
- 4.9%
- Equity multiple
- 1.19×
- Total profit
- $2,894
- Equity at exit
- $7,902
- IRR
- 16.1%
- Equity multiple
- 2.44×
- Total profit
- $21,363
- Equity at exit
- $4,582
Cash invested: $14,840 (down + closing). Projections, not guarantees.
Landlord ↔ Tenant lean methodology
- Overall (STATE)
- 87 Strongly Landlord-Friendly
- State Florida
- 87 Strongly Landlord-Friendly · R+3
- County
- — inherits STATE
- City
- — inherits STATE
ZIP-level market 32922
- Home prices YoY
- -20.3%
- Rents YoY
- 4.1%
- Active inventory
- 167
- Price-to-rent
- 4.2×
Monthly cashflow live
- Estimated rent
- $1,046 medium interval (Pro) →
- Mortgage (P&I)
- −$278
- Tax from tax record
- −$84 /mo · $1,005/yr
- Insurance
- −$22
- HOA
- −$284
- Vacancy / Maint / Mgmt
- −$220
- Net cashflow
- $158
Break-even live
UW: 25.0% down · 7.5% · 30yr · 1.5% tax · 5.0% vac · 8.0% maint · 8.0% mgmt
Financing live
Cash to close
- Down payment
- $13,250
- Closing costs
- $1,590
- Reserves months
- —
- Total cash needed
- —
Loan-product check · same deal, 3 products live
Conventional
25% down · 7.5% · 30yr
- Down + closing
- —
- Monthly P&I
- —
- Monthly cashflow
- —
- DSCR
- —
- Eligible?
- —
Personal DTI + credit; lowest rate.
DSCR
20% down · 8.5% · 30yr
- Down + closing
- —
- Monthly P&I
- —
- Monthly cashflow
- —
- DSCR
- —
- Eligible?
- —
No personal income docs; deal must DSCR.
Hard money
10% down · 12.0% · 12mo
- Down + closing
- —
- Monthly P&I
- —
- Monthly cashflow
- —
- DSCR
- —
- Eligible?
- —
Short-term bridge; refi at stabilization.
HOA detail condo
- Monthly dues
- $284 · $3,408/yr
- Likely covers
- pool
- Assessments
- None detected in remarks — confirm with the listing agent.
Listing history 21 events
-
2026-05-15status Pending
-
2026-03-26historical $800
-
2026-03-24$800
-
2026-03-24historical $800
-
2026-03-23$53,000 Active
-
2025-09-25$800
-
2025-09-25historical $800
-
2025-09-25$800
-
2025-05-26historical $800
-
2024-12-12$800
-
2024-12-12historical $800
-
2024-11-12price $800
-
2024-11-12historical $850
-
2024-11-12$850
-
2024-01-23price $850
-
2023-12-13$875
-
2013-01-18soldstatus $31,000
-
2012-06-28soldstatus $338,800
-
2007-07-23soldstatus $5,500,000
-
1998-07-06soldstatus $82,500
-
1980-10-01soldstatus $4,125,000
ⓘ Source: listings_history table (triggers on properties + properties_extension) + one-shot
backfill from property_details.listing_events for pre-trigger history.
Tax reassessment forecast FL · Resets to sale price
- Current annual tax
- $1,005 · $84/mo
- Projected year-2 tax
- $1,005 · $84/mo
- Expected delta
- $0/yr ($0/mo · 0.0%)
ⓘ Screening estimate from a state-policy table — verify with the county assessor before closing.
Climate risk First Street
- Flood 6/10 Major FEMA zone X (unshaded) · 71% chance over 30 yrs
- Wildfire 5/10 Major
- Heat 10/10 Extreme 7 d/yr ≥106°F today · 23 d/yr by 30 yrs out
- Wind 10/10 Extreme 99% chance of damaging wind over 30 yrs
- Air quality 1/10 Low 0 unhealthy d/yr today · 0 by 30 yrs out
Nearby sold comps map
Loading sold comps map…
Walkable amenities ~0.75 mi
Loading nearby amenities…
Taxation est. · year 1
- Rental income
- $12,548
- − Mortgage interest
- −$2,969
- − Property taxes
- −$1,005
- − Insurance
- −$265
- − Repairs & maintenance
- −$1,004
- − Management
- −$1,004
- − HOA
- −$3,408
- − Depreciation
- −$1,542
- Taxable income
- $1,351
- Est. tax owed @ 24.0%
- −$324
- After-tax cash flow
- $1,575/yr
For passive investors: Depreciation is non-cash, so a rental often shows a tax loss while cash-flowing — sheltering income. Rental losses are passive: they offset passive income freely, and up to $25,000/yr can offset ordinary (W-2) income if you actively participate and your MAGI is under $100k (phasing out to $0 by $150k); unused losses carry forward. On sale, claimed depreciation is recaptured at up to 25%, and gains may owe capital-gains tax (a 1031 exchange can defer both). Figures are a year-1 estimate at your 24.0% rate — not tax advice; consult a CPA.
Schools (NCES district)
- District
- Brevard
- NCES district ID
- 1200150
- Math proficiency
- 53% ▼ -9.00%
- Reading proficiency
- 57% ▼ -4.00%
- Median HH income
- $49,426
- Composite
- 46.86/100
- National rank
- #2370
- State rank
- #19 of 73 in FL
Livability — Cocoa
- Score
- 72/100
- State rank
- #344
- US rank
- #5979
Category grades
Schools grade is shown separately in the Schools card above.
Census & demographics
- Census place
- Cocoa, FL
- County
- Brevard County · 602,871 people
- City population
- 67,424
- Metro
- Palm Bay-Melbourne-Titusville, FL
- Population (ZIP)
- 14,700
- Household income
- $44,469
- Rent vs Own
- Severe rent burden
- 1007.0
Population outlook (Brevard County) Hauer SSP2
- Today (2025)
- 623,254 people
- By 2030
- 648,420 · +4.0%
- By 2040
- 690,009 · +10.7%
- By 2050
- 715,669 · +14.8%
- By 2075
- 775,744 · +24.5%
- By 2100
- 776,687 · +24.6%
Race, ethnicity, and origin ACS 2023
- Neighborhood character
- Diverse neighborhood (Simpson 0.66)
- Race & ethnicity
- White 45% Black 29% Hispanic / Latino 21% Two or more races 12%
- Hispanic origin (detail)
- Mexican 10% Puerto Rican 1% Cuban 4%
- Common ancestry
- Slovak 2% Romanian 2% Lithuanian 1%
- Foreign-born
- 14% · Canada
- Languages at home
- 81% English-only · Spanish 16% German/W. Germanic 2%
Political lean MEDSL · Brevard
- 2024 margin
- Strong R (+20.8) · D 39.1% · R 59.9% · Other 1.0%
- 2008→2024 swing
- -10.4pp toward R · 2008: -10.4pp · 2024: -20.8pp
- All cycles
- 2024: R+20.8 2020: R+16.4 2016: R+19.8 2012: R+12.7 2008: R+10.4
Not yet ingested
- Civics
- —
Market trends
- HPI YoY
- ▼ -68.95%
- Current HPI
- 271.1139
- Rent YoY
- ▲ 4.13%
- Metro
- Palm Bay-Melbourne-Titusville, FL
- State GDP YoY
- ▲ 3.28%
- F500 in state
- 36
Industry mix (Fortune 500 HQ in FL)
| Industry | F500 HQs | Revenue |
|---|---|---|
| Industrial Technology | 2 | $29B |
|
||
| Insurance | 2 | $17B |
|
||
| Retail | 1 | $60B |
|
||
| Technology Distribution | 1 | $58B |
|
||
| Homebuilding | 1 | $35B |
|
||
| Technology Manufacturing | 1 | $35B |
|
||
Price history
-98.7% since first listed21 events — show timeline
- 2026-05-15 Pending — Stellar MLS as Distributed by MLS Grid
- 2026-03-26 Rental Removed $800 APPFOLIO
- 2026-03-24 Listed for Rent $800 APPFOLIO
- 2026-03-24 Rental Removed $800 STELLARMLS
- 2026-03-23 Listed $53,000 Stellar MLS as Distributed by MLS Grid
- 2025-09-25 Listed for Rent $800 STELLARMLS
- 2025-09-25 Rental Removed $800 APPFOLIO
- 2025-09-25 Listed for Rent $800 APPFOLIO
- 2025-05-26 Rental Removed $800 APPFOLIO
- 2024-12-12 Listed for Rent $800 APPFOLIO
- 2024-12-12 Rental Removed $800 STELLARMLS
- 2024-11-12 Price Changed $800 STELLARMLS
- 2024-11-12 Rental Removed $850 APPFOLIO
- 2024-11-12 Listed for Rent $850 APPFOLIO
- 2024-01-23 Price Changed $850 STELLARMLS
- 2023-12-13 Listed for Rent $875 STELLARMLS
- 2013-01-18 Sold (Public Records) $31,000 Public Records
- 2012-06-28 Sold (Public Records) $338,800 Public Records
- 2007-07-23 Sold (Public Records) $5,500,000 Public Records
- 1998-07-06 Sold (Public Records) $82,500 Public Records
- 1980-10-01 Sold (Public Records) $4,125,000 Public Records
Property tax history
+4.4%/yrLatest (2025): $1,005 · +14.4% YoY. Source: county tax records.
Cash-flow waterfall
monthlySold comps — $/sqft
last 12 mo · ≤1 miLoading sold comps…