6160 Fredericksburg Tpke · Fredericksburg, VA
Flood risk 1/10 · Minimal
- FEMA flood zone
- X (unshaded)
- Chance of flooding over 30 yrs
- 0.0%
- Est. flood insurance / yr
- $473 – $860
Fire risk 5/10 · Moderate
- Est. fire insurance / yr
- $666 – $1,236
Heat risk 7/10 · Major
- Hot days now (above 103°F)
- 7 days/yr
- Hot days in 30 yrs
- 16 days/yr
Wind risk 5/10 · Moderate
- Chance of severe wind over 30 yrs
- 22.0%
Air-quality risk 2/10 · Minimal
- Unhealthy air days now
- 0 days/yr
- Unhealthy air days in 30 yrs
- 1 days/yr
Risk factors via First Street. Map © Google.
Why this score? — see what drove the D+ grade
The composite is a weighted blend of 9 inputs, each scored 0–100. Each bar is that input's sub-score; the figure is the points it added to the 100-point composite (weight × sub-score).
- ARV discount +15.0/15.0
- Appreciation +10.0/10.0
- Cash flow +7.2/30.0
- Schools +4.4/10.0
- Livability +3.4/5.0
- Rent growth +2.5/5.0
- Condition / age +2.5/5.0
- DSCR +1.4/10.0
- 1% rule +0.9/10.0
$369,900
🖨 Deal sheet 📄 Offer letter ✓ Due diligence
Listing remarks
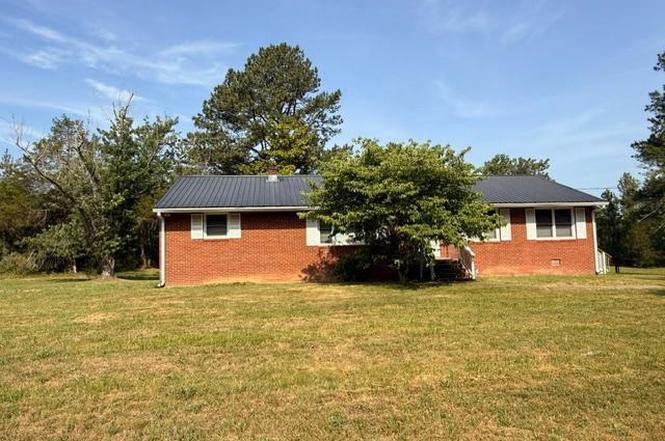
Discover the perfect blend of space, privacy, and potential with this all-brick rambler situated on 1.73 scenic acres in Caroline County. Offering over 1,800 square feet of main-level living, this 4-bedroom, 2-bath home provides a spacious and functional layout ideal for everyday living and entertaining. Major updates completed in 2022 included a new HVAC system, Septic system, metal roof, providing peace of mind for years to come. Inside, you'll find a large kitchen, separate dining room, dedicated office/study, and generously sized living spaces filled with natural light. The partial basement offers additional storage or future expansion possibilities. Surrounded by mature trees and open
Key facts
- 1.73 acre lot
- 2 parking spots
- Built 1962
Property features AI
Finance
- Other: Ownership is Fee Simple
- HOA & community: HOA/Condo/Coop fee details listed as 'Other'; HOA amenities listed as 'Other'
Exterior
- Parking: Driveway; Detached carport (2 spaces); Two total garage/parking spaces
- Utilities: Well water; On-site septic; Electric service available; Water service available
- Home design: Detached property; Estimated year built; Metal roof; Casement windows; Not in a federal flood zone
- Construction: Brick construction; Permanent foundation
- Exterior features: Backs to trees; Cleared yard; Trees/wooded; Shed on the property
Interior
- Kitchen: Stove; Refrigerator
- Basement: Unfinished basement
- Bedrooms: Four bedrooms on the main level
- Bathrooms: Two full bathrooms; One half bathroom
- Heating & cooling: Forced air heating (electric); Central air conditioning (electric); Electric hot water
- Interior features: Country-style kitchen; Dining area; Window treatments; Master bath(s); Open floor plan
- Laundry & utility: Washer; Dryer; Humidifier
Neighborhood map
What this means for you Summary
Snapshot
- This is a 3-bed/2.5-bath single-family listed at $370k.
Deal economics
- At list price, monthly cash flow is $-507 ($-6k/yr) — negative.
- To cash-flow at today's rent, offer at most $280k (24.2% below list).
- To meet the 1% rule (rent ≥ 1% of price), the offer needs to be $218k (41.0% below list).
- Recommended offer: $218k (41.0% below list) — sets the bar for 1% rule.
- Cap rate 4.6% vs local median 3.6% in Fredericksburg — meaningfully above typical; check what's discounted (condition, days-on-market, listing class) to confirm the premium yield is real.
Location & tenants
- Location reads 67/100 on livability (#299 in VA) — a middle-class / working-renter tenant base. Strengths: health & safety A+, employment A-, housing B+; Watch: crime F, commute F, cost of living F.
- Caroline County Public School District (rural): math 39% / reading 62% proficiency, ranked #95 of 131 in VA (top 72%) — acceptable for families but not a draw, mixed tenant base, ~2y average lease.
- Zoned schools: Caroline High (math 46% / reading 76%, grade C+, #242 of 319 statewide, top 76%, 1,251 students, 75% FRL) — zoned schools average 75% FRL vs 44% district-wide (30 pts higher); higher-poverty schools than district average — tighter screening recommended.
- Market conditions: 37 active listings in the ZIP; 318 units permitted in Caroline County in 2024 (0 in 5+ unit buildings).
Forward outlook
- In year one you build about $40k of equity ($3k loan paydown + $37k appreciation (10.0% local appreciation)).
- Caroline County population projected at +8% by 2050 — modest demand growth; plan on rents tracking national, not racing it.
- By year 2, paydown + projected appreciation supports a ~$64k cash-out refi (75% LTV) — recoverable capital for the next deal without selling this one.
Negotiation context
- Only 7 days on market — expect competitive offers; lowballing is unlikely to land.
- 6 sale attempts since 29y ago with the ask held roughly flat each time — persistent listings suggest the price (not the market) is what's stuck; bring a comps-based counter.
Risks & watch-outs
- Climate carrying-cost: moderate wind risk, 22% chance of damaging wind over 30y; moderate wildfire risk; extreme-heat days projected 7→16/yr by 2055 (HVAC capex compounding) — expect insurance premiums to compound above CPI over the hold.
Questions for the listing agent
- What do current leases actually rent for vs. the listed asking? Can we see a recent rent roll and the last 12 months of T-12 income?
- Built in 1962 — when were the roof, HVAC, electrical panel, plumbing, and water heater last replaced?
- Is there a deadline driving the sale (1031 exchange, divorce, estate, relocation)? That informs how much negotiation room exists.
- Schools are A-rated — typically a magnet for longer-tenancy family renters. What's the average tenant stay here, and is there a school-zone premium baked into asking?
- Crime grade is F in this area — have there been break-ins, vandalism, or insurance claims at this property in the last 3 years? What carrier currently insures it and at what premium?
- The area grade is low — what's the realistic commute time and amenity access for the typical tenant pool here? Any planned neighborhood developments (good or bad) we should know about?
- What's the average days-on-market for RENTAL listings here right now (not sales)? A rising rental-DOM trend means longer vacancies and softer asking-rent achievability than the comps imply.
- What's the recent tenant-quality profile in this submarket — average credit score on applications, eviction rate, late-payment / NSF rate, and stable-employment percentage? A property-management company in the area should have these aggregated.
- How much new for-sale + rental construction is in the pipeline within 1–3 miles? Heavy new supply typically softens prices + rents 12–24 months out; constrained supply supports both.
Investment metrics
- 1% rule
- 0.59% ✗
- Cap rate
- 4.65%
- Cash-on-cash
- -5.87%
- DSCR
- 0.74
- GRM
- 14.1
CMA / ARV
- ARV (on-the-fly)
- $515,214
- Comps found
- 2
Show comp detail 2 sales within ~0.75 mi
| Address | Dist | Beds/Ba | Sqft | Sold | Price | $/sf | Match |
|---|---|---|---|---|---|---|---|
| 14423 Long Branch Rd | 0.53mi | 4/1.0 (+1) | 1,704 (-7%) | 11mo | $480,000 | $282 | 44 |
| 13408 Mason St | 0.72mi | 3/2.0 | 1,596 (-13%) | 4mo | $394,000 | $247 | 40 |
Match score weights: distance 35% · size 25% · config 20% · recency 20%. Top-matched comps best support the ARV.
Projected returns pro-forma
10.0% appreciation · 3.0% rent growth · sell at horizon
- IRR
- 20.1%
- Equity multiple
- 2.63×
- Total profit
- $168,998
- Equity at exit
- $333,235
- IRR
- 18.4%
- Equity multiple
- 6.05×
- Total profit
- $522,737
- Equity at exit
- $718,634
Cash invested: $103,572 (down + closing). Projections, not guarantees.
Landlord ↔ Tenant lean methodology
- Overall (STATE)
- 55 Moderately Landlord-Leaning
- State Virginia
- 55 Moderately Landlord-Leaning · D+2
- County
- — inherits STATE
- City
- — inherits STATE
ZIP-level market 22580
- Home prices YoY
- 8.2%
- Active inventory
- 37
- Price-to-rent
- 14.1×
Monthly cashflow live
- Estimated rent
- $2,184 medium interval (Pro) →
- Mortgage (P&I)
- −$1,940
- Tax from tax record
- −$139 /mo · $1,663/yr
- Insurance
- −$154
- HOA
- −$0
- Vacancy / Maint / Mgmt
- −$459
- Net cashflow
- $-507
Break-even live
UW: 25.0% down · 7.5% · 30yr · 1.5% tax · 5.0% vac · 8.0% maint · 8.0% mgmt
Financing live
Cash to close
- Down payment
- $92,475
- Closing costs
- $11,097
- Reserves months
- —
- Total cash needed
- —
Loan-product check · same deal, 3 products live
Conventional
25% down · 7.5% · 30yr
- Down + closing
- —
- Monthly P&I
- —
- Monthly cashflow
- —
- DSCR
- —
- Eligible?
- —
Personal DTI + credit; lowest rate.
DSCR
20% down · 8.5% · 30yr
- Down + closing
- —
- Monthly P&I
- —
- Monthly cashflow
- —
- DSCR
- —
- Eligible?
- —
No personal income docs; deal must DSCR.
Hard money
10% down · 12.0% · 12mo
- Down + closing
- —
- Monthly P&I
- —
- Monthly cashflow
- —
- DSCR
- —
- Eligible?
- —
Short-term bridge; refi at stabilization.
Listing history 7 events
-
2026-06-18days on market $369,900 Coming Soon 7 DOM
-
2026-06-18remarks 699-char remark
-
2026-06-17days on market $369,900 Coming Soon 6 DOM
-
2026-06-16days on market $369,900 Coming Soon 5 DOM
-
2026-06-15days on market $369,900 Coming Soon 4 DOM
-
2026-06-13remarks 11-char remark
-
2026-06-13$369,900 Coming Soon 2 DOM
ⓘ Source: listings_history table (triggers on properties + properties_extension) + one-shot
backfill from property_details.listing_events for pre-trigger history.
Tax reassessment forecast VA · Resets to sale price
- Current annual tax
- $1,663 · $139/mo
- Projected year-2 tax
- $3,033 · $253/mo
- Expected delta
- +$1,370/yr (+$114/mo · 82.4%)
ⓘ Screening estimate from a state-policy table — verify with the county assessor before closing.
Climate risk First Street
- Flood 1/10 Low FEMA zone X (unshaded) · 0% chance over 30 yrs
- Wildfire 5/10 Major
- Heat 7/10 Severe 7 d/yr ≥103°F today · 16 d/yr by 30 yrs out
- Wind 5/10 Major 22% chance of damaging wind over 30 yrs
- Air quality 2/10 Low 0 unhealthy d/yr today · 1 by 30 yrs out
Nearby sold comps map
Loading sold comps map…
Walkable amenities ~0.75 mi
Loading nearby amenities…
Taxation est. · year 1
- Rental income
- $26,210
- − Mortgage interest
- −$20,720
- − Property taxes
- −$1,663
- − Insurance
- −$1,850
- − Repairs & maintenance
- −$2,097
- − Management
- −$2,097
- − Depreciation
- −$10,761
- Taxable loss
- −$12,977
- Est. tax savings @ 24.0%
- +$3,115
- After-tax cash flow
- $-2,970/yr
For passive investors: Depreciation is non-cash, so a rental often shows a tax loss while cash-flowing — sheltering income. Rental losses are passive: they offset passive income freely, and up to $25,000/yr can offset ordinary (W-2) income if you actively participate and your MAGI is under $100k (phasing out to $0 by $150k); unused losses carry forward. On sale, claimed depreciation is recaptured at up to 25%, and gains may owe capital-gains tax (a 1031 exchange can defer both). Figures are a year-1 estimate at your 24.0% rate — not tax advice; consult a CPA.
Schools (NCES district)
- District
- Caroline County Public School District
- NCES district ID
- 5100660
- Math proficiency
- 39% ▼ -36.00%
- Reading proficiency
- 62% ▼ -10.00%
- Median HH income
- $58,075
- Composite
- 43.88/100
- National rank
- #2920
- State rank
- #95 of 131 in VA
Livability — Fredericksburg
- Score
- 67/100
- State rank
- #299
- US rank
- #10735
Category grades
Schools grade is shown separately in the Schools card above.
Census & demographics
- City population
- 207,206
- Population (ZIP)
- 4,956
Population outlook (Caroline County) Hauer SSP2
- Today (2025)
- 32,136 people
- By 2030
- 32,973 · +2.6%
- By 2040
- 34,255 · +6.6%
- By 2050
- 34,843 · +8.4%
- By 2075
- 35,134 · +9.3%
- By 2100
- 32,184 · +0.1%
Race, ethnicity, and origin ACS 2023
- Neighborhood character
- Predominantly White (70%)
- Race & ethnicity
- White 70% Black 18% Hispanic / Latino 5% Two or more races 4% Asian 3%
- Common ancestry
- Slovak 5% Serbian 2% Scottish 1%
- Foreign-born
- 3% · Canada
- Languages at home
- 95% English-only · Spanish 4% Tagalog/Filipino 1%
Political lean MEDSL · Caroline
- 2024 margin
- Lean R (+8.8) · D 45.1% · R 53.9% · Other 1.1%
- 2008→2024 swing
- -20.8pp toward R · 2008: 12.0pp · 2024: -8.8pp
- All cycles
- 2024: R+8.8 2020: R+4.2 2016: R+5.1 2012: D+8.2 2008: D+12.0
Not yet ingested
- Civics
- —
Market trends
- HPI YoY
- ▲ 29.02%
- Current HPI
- 384.3319
- Rent YoY
- —
- Metro
- —
- State GDP YoY
- ▲ 2.40%
- F500 in state
- 50
Industry mix (Fortune 500 HQ in VA)
| Industry | F500 HQs | Revenue |
|---|---|---|
| Aerospace / Defense | 4 | $236B |
|
||
| Technology / Defense | 3 | $32B |
|
||
| Financial Services | 2 | $176B |
|
||
| Utilities | 2 | $27B |
|
||
| Insurance | 2 | $25B |
|
||
| Technology | 2 | $15B |
|
||
Price history
+23.3% since first listed21 events — show timeline
- 2026-06-11 Coming Soon $369,900 BRIGHT MLS
- 2022-12-16 Sold (Public Records) $340,000 Public Records
- 2022-11-27 Listing Removed — BRIGHT MLS
- 2022-11-03 Listed $359,990 BRIGHT MLS
- 2022-11-03 Listing Removed — BRIGHT MLS
- 2022-10-17 Price Changed $359,990 BRIGHT MLS
- 2022-10-06 Listed $390,000 BRIGHT MLS
- 2022-10-05 Coming Soon — BRIGHT MLS
- 2021-11-01 Sold (Public Records) $210,000 Public Records
- 2021-10-28 Sold (MLS) $210,000 BRIGHT MLS
- 2021-10-16 Contingent — BRIGHT MLS
- 2021-09-23 Price Changed $229,950 BRIGHT MLS
- 2021-08-27 Price Changed $255,000 BRIGHT MLS
- 2021-07-17 Price Changed $280,000 BRIGHT MLS
- 2021-06-02 Listed $300,000 BRIGHT MLS
- 1999-04-11 Delisted — MRIS
- 1998-12-18 Listed — MRIS
- 1997-12-08 Delisted — MRIS
- 1997-10-19 Listed — MRIS
- 1997-09-26 Delisted — MRIS
- 1997-03-28 Listed — MRIS
Property tax history
+2.5%/yrLatest (2025): $1,663 · +2.9% YoY. Source: county tax records.
Cash-flow waterfall
monthlySold comps — $/sqft
last 12 mo · ≤1 miLoading sold comps…