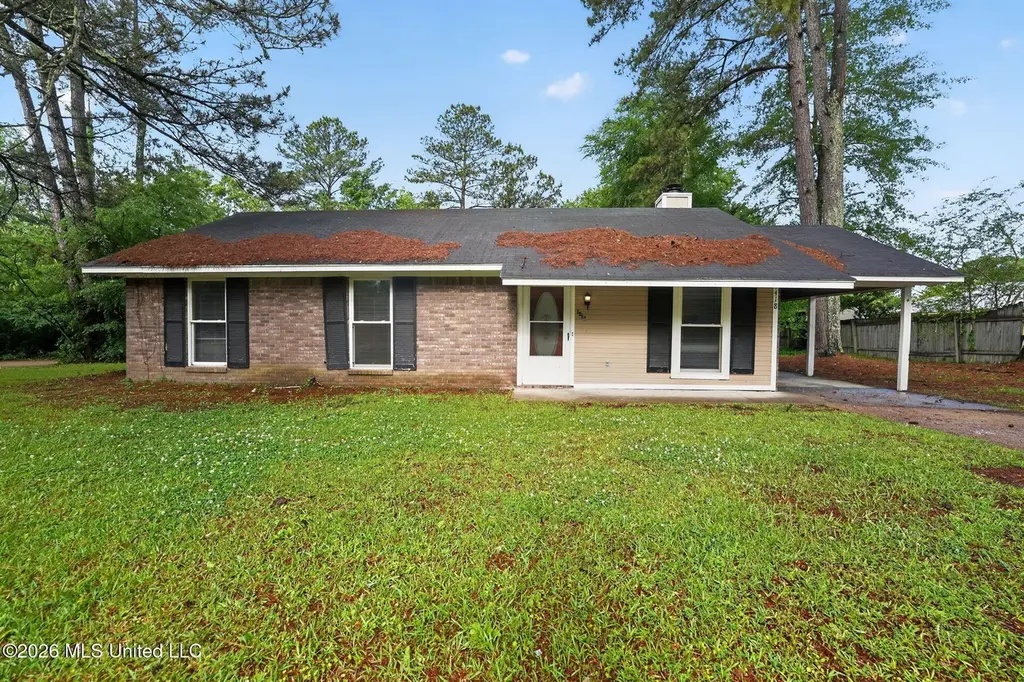
1418 Cooks · Jackson, MS
Flood risk 1/10 · Minimal
- FEMA flood zone
- X (unshaded)
- Chance of flooding over 30 yrs
- 0.0%
- Est. flood insurance / yr
- $507 – $1,088
Fire risk 4/10 · Minor
- Est. fire insurance / yr
- $1,241 – $2,305
Heat risk 7/10 · Major
- Hot days now (above 108°F)
- 7 days/yr
- Hot days in 30 yrs
- 20 days/yr
Wind risk 8/10 · Major
- Chance of severe wind over 30 yrs
- 80.0%
Air-quality risk 1/10 · Minimal
- Unhealthy air days now
- 0 days/yr
- Unhealthy air days in 30 yrs
- 0 days/yr
Risk factors via First Street. Map © Google.
Why this score? — see what drove the B+ grade
The composite is a weighted blend of 9 inputs, each scored 0–100. Each bar is that input's sub-score; the figure is the points it added to the 100-point composite (weight × sub-score).
- Cash flow +30.0/30.0
- ARV discount +15.0/15.0
- DSCR +10.0/10.0
- 1% rule +9.8/10.0
- Rent growth +3.6/5.0
- Livability +3.4/5.0
- Condition / age +2.5/5.0
- Schools +1.1/10.0
- Appreciation +0.0/10.0
$99,900
🖨 Deal sheet 📄 Offer letter ✓ Due diligence
Listing remarks
Charming 3-bedroom, 1.5-bathroom ranch home located in the desirable Lakeview Estates subdivision of Jackson. This single-story residence offers approximately 1,161 square feet of comfortable living space, featuring a spacious living room and a functional kitchen. The primary suite features a half bath for convenience. Outside, an attached carport provides easy and safe parking while a large patio makes for versatile outdoor enjoyment. The home is equipped with central air and heating for year-round comfort. Situated in a quiet, established neighborhood, this property provides convenient access to local schools, including Woodville Heights Elementary, Peeples Middle School, and Forest Hill
Key facts
- Attached carport
- Large patio
- 8,276 sq ft lot
Tags
Property features AI
Finance
- Other: Lot is level with many trees (approximately 0.19 acres)
Exterior
- Parking: Attached carport (1 carport space); 2 total parking spaces; Concrete driveway, paved
- Utilities: Public water; Public sewer; Cable connected; Sewer connected; Water connected; Electric service listed
- Home design: Single family residence (house); One story; Move-in ready
- Construction: Vinyl and brick exterior; Composition shingle roof; Conventional foundation; Built using public records
- Exterior features: Private yard; Patio on slab
Interior
- Kitchen: Dishwasher; Oven; Range hood; Refrigerator; Exhaust fan; Electric water heater
- Bedrooms: Primary bedroom on main level (12x12); Bedroom on main level (12x10); Bedroom on main level (11x10)
- Flooring: Carpet; Hardwood
- Bathrooms: 1 full bathroom; 1 half bathroom
- Heating & cooling: Central heating (electric); Central air; Ceiling fans
- Interior features: Kitchen island; Decorative masonry fireplace; See remarks
- Laundry & utility: Laundry closet on main level
Neighborhood map
What this means for you Summary
Snapshot
- This is a 3-bed/2.0-bath single-family listed at $100k.
Deal economics
- At list price, monthly cash flow is $477 ($6k/yr) — positive.
- The deal already cash-flows at list — no discount required.
- Meets the 1% rule at list price ($1k rent vs $100k).
- Recommended offer: $97k (3.0% below list) — sets the bar for market timing.
- Cap rate 12.0% vs local median 9.9% in Jackson — meaningfully above typical; check what's discounted (condition, days-on-market, listing class) to confirm the premium yield is real.
Location & tenants
- Location reads 68/100 on livability (#66 in MS) — a middle-class / working-renter tenant base. Strengths: commute A+, cost of living A+, housing A+; Watch: amenities F, employment F, health & safety F.
- Jackson Public School District (urban): math 9% / reading 18% proficiency, ranked #112 of 130 in MS (top 86%) — low school quality limits family demand, transient renter base, plan for 1-2y turnover; 88% free/reduced lunch — lower-income household profile, screen leases tightly.
- Zoned schools: Peeples Middle School (math 11% / reading 15%, grade F, #141 of 179 statewide, top 79%, 298 students, 100% FRL); Forest Hill High School (math 5% / reading 15%, grade F, #168 of 197 statewide, top 86%, 991 students, 100% FRL).
- Market conditions: Rents rising fast (+4.2%/yr); 302 active listings in the ZIP; 3 comparable units currently listed for rent nearby; rentals leasing fast (median 14d on market — plan ~1-2 weeks tenant-placement turnaround); 167 units permitted in Hinds County in 2024 (0 in 5+ unit buildings).
- This rent runs 35% of the median local income ($51k/yr) — at the standard rent-burdened threshold; future hikes will face affordability resistance.
Forward outlook
- Local home prices are declining (-3.0%/yr); year-one equity from $691 of loan paydown is wiped out by about $3k of value loss. Plan a longer hold.
- Hinds County population projected to shrink 6% by 2050 — rents likely to lag national; underwrite the cash flow, not the appreciation.
- At projected returns (-3.0% appreciation + 4.2% rent growth), your $28k cash investment doubles in ~6 years — after that, you're playing with house money.
Negotiation context
- It's been on market 48 days — a 3% lower offer ($97k) is reasonable based on typical stale-listing flexibility.
- 6 sale attempts since 23y ago with the ask held roughly flat each time — persistent listings suggest the price (not the market) is what's stuck; bring a comps-based counter.
Risks & watch-outs
- Climate carrying-cost: severe wind risk, 80% chance of damaging wind over 30y; extreme-heat days projected 7→20/yr by 2055 (HVAC capex compounding) — expect insurance premiums to compound above CPI over the hold.
Questions for the listing agent
- It's been on market 48 days. Have you received any prior offers? Is the seller open to a 3% concession, seller financing, or rate buy-down credit?
- Is there a deadline driving the sale (1031 exchange, divorce, estate, relocation)? That informs how much negotiation room exists.
- Schools are F-rated, which usually means shorter tenancies and higher turnover. Who's the typical renter profile here, and what's been the actual vacancy rate?
- What's the average days-on-market for RENTAL listings here right now (not sales)? A rising rental-DOM trend means longer vacancies and softer asking-rent achievability than the comps imply.
- What's the recent tenant-quality profile in this submarket — average credit score on applications, eviction rate, late-payment / NSF rate, and stable-employment percentage? A property-management company in the area should have these aggregated.
- How much new for-sale + rental construction is in the pipeline within 1–3 miles? Heavy new supply typically softens prices + rents 12–24 months out; constrained supply supports both.
Investment metrics
- 1% rule
- 1.48% ✓
- Cap rate
- 12.02%
- Cash-on-cash
- 20.46%
- DSCR
- 1.91
- GRM
- 5.6
CMA / ARV
- ARV (median comp)
- $123,873
- List price
- $99,900
- Delta
- -19.35%
- Verdict
- UNDERPRICED
- Comps
- 14 within 1.0 mi
Show comp detail 3 sales within ~0.75 mi
| Address | Dist | Beds/Ba | Sqft | Sold | Price | $/sf | Match |
|---|---|---|---|---|---|---|---|
| 1438 Cherrie Ave | 0.06mi | 3/1.5 | 1,161 (0%) | 7mo | $94,500 | $81 | 89 |
| 1478 Bass Ave | 0.20mi | 3/2.0 | 1,036 (-11%) | 7mo | $115,000 | $111 | 67 |
| 4080 Puckett Rd | 0.26mi | 2/1.0 (-1) | 1,034 (-11%) | 18mo | $45,000 | $44 | 46 |
Match score weights: distance 35% · size 25% · config 20% · recency 20%. Top-matched comps best support the ARV.
Projected returns pro-forma
-3.0% appreciation · 4.23% rent growth · sell at horizon
- IRR
- 14.1%
- Equity multiple
- 1.57×
- Total profit
- $16,058
- Equity at exit
- $14,895
- IRR
- 23.8%
- Equity multiple
- 3.18×
- Total profit
- $60,983
- Equity at exit
- $8,638
Cash invested: $27,972 (down + closing). Projections, not guarantees.
Landlord ↔ Tenant lean methodology
- Overall (STATE)
- 90 Strongly Landlord-Friendly
- State Mississippi
- 90 Strongly Landlord-Friendly · R+11
- County
- — inherits STATE
- City
- — inherits STATE
ZIP-level market 39212
- Home prices YoY
- -11.7%
- Rents YoY
- 4.2%
- Active inventory
- 302
- Price-to-rent
- 5.6×
Monthly cashflow live
- Estimated rent
- $1,480 medium interval (Pro) →
- Mortgage (P&I)
- −$524
- Tax from tax record
- −$127 /mo · $1,520/yr
- Insurance
- −$42
- HOA
- −$0
- Vacancy / Maint / Mgmt
- −$311
- Net cashflow
- $477
Break-even live
UW: 25.0% down · 7.5% · 30yr · 1.5% tax · 5.0% vac · 8.0% maint · 8.0% mgmt
Financing live
Cash to close
- Down payment
- $24,975
- Closing costs
- $2,997
- Reserves months
- —
- Total cash needed
- —
Loan-product check · same deal, 3 products live
Conventional
25% down · 7.5% · 30yr
- Down + closing
- —
- Monthly P&I
- —
- Monthly cashflow
- —
- DSCR
- —
- Eligible?
- —
Personal DTI + credit; lowest rate.
DSCR
20% down · 8.5% · 30yr
- Down + closing
- —
- Monthly P&I
- —
- Monthly cashflow
- —
- DSCR
- —
- Eligible?
- —
No personal income docs; deal must DSCR.
Hard money
10% down · 12.0% · 12mo
- Down + closing
- —
- Monthly P&I
- —
- Monthly cashflow
- —
- DSCR
- —
- Eligible?
- —
Short-term bridge; refi at stabilization.
Rent comps 3 comps
| Address | Beds | Baths | Sqft | Rent | $/sqft | DOM | Units | Dist |
|---|---|---|---|---|---|---|---|---|
| 1457 Lakeview Ave Jackson, MS | 3.0 | 2.0 | 1288 | $1,426 | $1.11 | 13d | 1 | 0.17mi |
| 1478 Bass Ave Jackson, MS | 3.0 | 2.0 | 1036 | $1,525 | $1.47 | 13d | 1 | 0.21mi |
| 2750 N Siwell Rd Jackson, MS | 1.0–2.0 | 1.0 | 850 | $975 | $1.15 | 13d | 1 | 1.47mi |
Listing history 30 events
-
2026-06-18days on market $99,900 Active 48 DOM
-
2026-06-17days on market $99,900 Active 47 DOM
-
2026-06-16days on market $99,900 Active 46 DOM
-
2026-06-15days on market $99,900 Active 45 DOM
-
2026-06-14days on market $99,900 Active 43 DOM
-
2026-06-13days on market $99,900 Active 42 DOM
-
2026-06-10days on market $99,900 Active 40 DOM
-
2026-06-09days on market $99,900 Active 39 DOM
-
2026-06-08days on market $99,900 Active 38 DOM
-
2026-06-07days on market $99,900 Active 37 DOM
-
2026-06-05days on market $99,900 Active 34 DOM
-
2026-06-03days on market $99,900 Active 33 DOM
-
2026-06-02days on market $99,900 Active 32 DOM
-
2026-06-01days on market $99,900 Active 31 DOM
-
2026-05-31days on market $99,900 Active 30 DOM
-
2026-05-30days on market $99,900 Active 29 DOM
-
2026-05-01$99,900 Active 711-char remark
-
2021-10-02historical
-
2021-10-01historical
-
2021-10-01historical
-
2021-10-01historical
-
2020-12-31soldstatus
-
2020-05-12soldstatus
-
2020-05-07soldstatus
-
2019-07-27$72,000
-
2011-03-31$51,000
-
2007-06-07soldstatus
-
2006-12-22$63,000
-
2006-11-03$70,000
-
2003-09-16$58,000
ⓘ Source: listings_history table (triggers on properties + properties_extension) + one-shot
backfill from property_details.listing_events for pre-trigger history.
Tax reassessment forecast MS · Resets to sale price
- Current annual tax
- $1,520 · $127/mo
- Projected year-2 tax
- $1,520 · $127/mo
- Expected delta
- $0/yr ($0/mo · 0.0%)
ⓘ Screening estimate from a state-policy table — verify with the county assessor before closing.
Climate risk First Street
- Flood 1/10 Low FEMA zone X (unshaded) · 0% chance over 30 yrs
- Wildfire 4/10 Moderate
- Heat 7/10 Severe 7 d/yr ≥108°F today · 20 d/yr by 30 yrs out
- Wind 8/10 Severe 80% chance of damaging wind over 30 yrs
- Air quality 1/10 Low 0 unhealthy d/yr today · 0 by 30 yrs out
Nearby sold comps map
Loading sold comps map…
Walkable amenities ~0.75 mi
Loading nearby amenities…
Taxation est. · year 1
- Rental income
- $17,756
- − Mortgage interest
- −$5,596
- − Property taxes
- −$1,520
- − Insurance
- −$500
- − Repairs & maintenance
- −$1,421
- − Management
- −$1,421
- − Depreciation
- −$2,906
- Taxable income
- $4,394
- Est. tax owed @ 24.0%
- −$1,055
- After-tax cash flow
- $4,667/yr
For passive investors: Depreciation is non-cash, so a rental often shows a tax loss while cash-flowing — sheltering income. Rental losses are passive: they offset passive income freely, and up to $25,000/yr can offset ordinary (W-2) income if you actively participate and your MAGI is under $100k (phasing out to $0 by $150k); unused losses carry forward. On sale, claimed depreciation is recaptured at up to 25%, and gains may owe capital-gains tax (a 1031 exchange can defer both). Figures are a year-1 estimate at your 24.0% rate — not tax advice; consult a CPA.
Schools (NCES district)
- District
- Jackson Public School District
- NCES district ID
- 2802190
- Math proficiency
- 9% ▼ -14.00%
- Reading proficiency
- 18% ▼ -7.00%
- Median HH income
- $33,234
- Composite
- 10.89/100
- National rank
- #9755
- State rank
- #112 of 130 in MS
Livability — Jackson
- Score
- 68/100
- State rank
- #66
- US rank
- #9695
Category grades
Schools grade is shown separately in the Schools card above.
Census & demographics
- Census place
- Jackson, MS
- County
- Hinds County · 167,040 people
- City population
- 140,204
- Metro
- Jackson, MS
- Population (ZIP)
- 25,659
- Household income
- $50,722
- Rent vs Own
- Severe rent burden
- 1314.0
Population outlook (Hinds County) Hauer SSP2
- Today (2025)
- 242,528 people
- By 2030
- 241,113 · -0.6%
- By 2040
- 235,557 · -2.9%
- By 2050
- 226,946 · -6.4%
- By 2075
- 199,995 · -17.5%
- By 2100
- 164,165 · -32.3%
Race, ethnicity, and origin ACS 2023
- Neighborhood character
- Predominantly Black (86%)
- Race & ethnicity
- Black 86% White 9% Hispanic / Latino 3% Two or more races 3%
- Common ancestry
- Serbian 1% Lithuanian 1%
- Foreign-born
- 1% · Canada
- Languages at home
- 97% English-only · Spanish 2%
Political lean MEDSL · Hinds
- 2024 margin
- Solid D (+46.1) · D 72.4% · R 26.3% · Other 1.4%
- 2008→2024 swing
- +7.1pp toward D · 2008: 39.0pp · 2024: 46.1pp
- All cycles
- 2024: D+46.1 2020: D+48.3 2016: D+43.7 2012: D+45.1 2008: D+39.0
Not yet ingested
- Civics
- —
Market trends
- HPI YoY
- ▼ -23.01%
- Current HPI
- 174.4025
- Rent YoY
- ▲ 4.23%
- Metro
- Jackson, MS
- State GDP YoY
- —
- F500 in state
- 0
Price history
+72.2% since first listed14 events — show timeline
- 2026-05-01 Listed $99,900 MLSU
- 2021-10-02 Listing Removed — MLSU
- 2021-10-01 Listing Removed — MLSU
- 2021-10-01 Listing Removed — MLSU
- 2021-10-01 Listing Removed — MLSU
- 2020-12-31 Sold (Public Records) — Public Records
- 2020-05-12 Sold (MLS) — MLSU
- 2020-05-07 Sold (Public Records) — Public Records
- 2019-07-27 Listed $72,000 MLSU
- 2011-03-31 Listed $51,000 MLSU
- 2007-06-07 Sold (Public Records) — Public Records
- 2006-12-22 Listed $63,000 MLSU
- 2006-11-03 Listed $70,000 MLSU
- 2003-09-16 Listed $58,000 MLSU
Property tax history
+1.5%/yrLatest (2025): $1,520 · +5.2% YoY. Source: county tax records.
Cash-flow waterfall
monthlySold comps — $/sqft
last 12 mo · ≤1 miLoading sold comps…