145 Firefly Dr · Carter, TX
Flood risk No data
- FEMA flood zone
- —
- Chance of flooding over 30 yrs
- —
- Est. flood insurance / yr
- —
Fire risk No data
- Est. fire insurance / yr
- —
Heat risk No data
- Hot days now (above threshold)
- —
- Hot days in 30 yrs
- —
Wind risk No data
- Chance of severe wind over 30 yrs
- —
Air-quality risk No data
- Unhealthy air days now
- —
- Unhealthy air days in 30 yrs
- —
Risk factors via First Street. Map © Google.
Why this score? — see what drove the C grade
The composite is a weighted blend of 9 inputs, each scored 0–100. Each bar is that input's sub-score; the figure is the points it added to the 100-point composite (weight × sub-score).
- Cash flow +20.5/30.0
- ARV discount +15.0/15.0
- DSCR +6.5/10.0
- 1% rule +5.8/10.0
- Schools +3.3/10.0
- Rent growth +2.5/5.0
- Livability +2.5/5.0
- Condition / age +2.5/5.0
- Appreciation +0.0/10.0
$173,000
🖨 Deal sheet 📄 Offer letter ✓ Due diligence
Listing remarks MLS
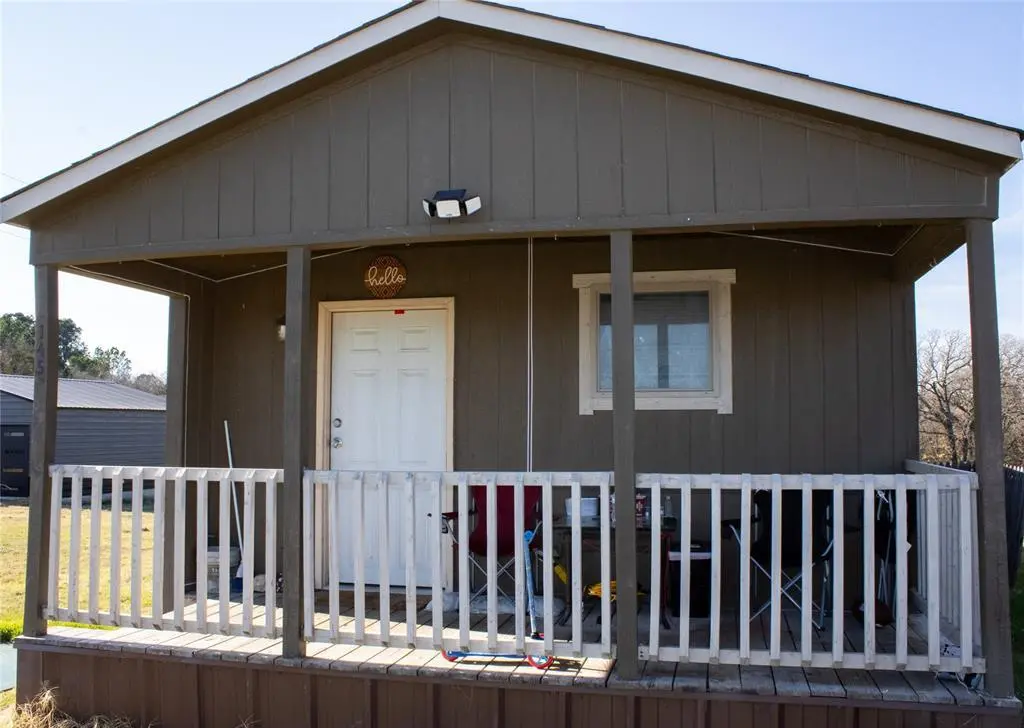
Escape the noise and enjoy the calm of this adorable 3 bedroom home situated on a spacious one-acre lot. Located in a quiet, desirable gated community, this property offers privacy, open space, and endless potential. The open concept makes for great entertaining, natural lighting, improves flow, and maximizes usable space. Backyard is partially fenced off, front yard has an adorable covered patio perfect for morning coffee and your after dinner drinks. Plenty of room for outdoor entertaining, pets, hobbies, or future improvements, all while enjoying the tranquility of country style living. Property is listed below market value for a quick sale. Property is being sold as is, so come and see this home before its gone!
Key facts
- Gated community
- One acre lot
- Open concept
Tags
Neighborhood map
What this means for you Summary
Snapshot
- This is a 3-bed/2.0-bath manufactured listed at $173k.
Deal economics
- At list price, monthly cash flow is $227 ($3k/yr) — positive.
- The deal already cash-flows at list — no discount required.
- Meets the 1% rule at list price ($2k rent vs $173k).
- Recommended offer: $152k (12.0% below list) — sets the bar for market timing.
- Cap rate 7.9% vs local median 2.5% in Carter — top-decile yield for the area; either an underpriced asset or a hidden risk that comps aren't pricing in. Stress-test before assuming the spread holds.
Location & tenants
- Location reads: area grade C — affects rentability + tenant quality, not the cash-flow math above.
- Springtown ISD (town): math 36% / reading 40% proficiency, ranked #435 of 826 in TX (top 53%) — families likely to look elsewhere, expect single-tenant / working-renter base with shorter leases.
- Market conditions: 519 active listings in the ZIP; solid renter incomes; 437 units permitted in Parker County in 2024 (0 in 5+ unit buildings).
Forward outlook
- Local home prices are declining (-3.0%/yr); year-one equity from $1k of loan paydown is wiped out by about $5k of value loss. Plan a longer hold.
- Parker County population projected at +32% by 2050 — long-run rental-demand tailwind backs the buy-and-hold thesis.
Negotiation context
- It's been on market 171 days — a 12% lower offer ($152k) is reasonable based on typical stale-listing flexibility.
- 2 sale attempts; this cycle's ask has dropped $17k (9%) from the opening price — seller is motivated, your offer sets the floor, not the list.
Questions for the listing agent
- It's been on market 171 days. Have you received any prior offers? Is the seller open to a 12% concession, seller financing, or rate buy-down credit?
- Why hasn't it sold? Are there any deal-killer items the seller is aware of (foundation, flood, title, zoning, code violations)?
- Is there a deadline driving the sale (1031 exchange, divorce, estate, relocation)? That informs how much negotiation room exists.
- What's the average days-on-market for RENTAL listings here right now (not sales)? A rising rental-DOM trend means longer vacancies and softer asking-rent achievability than the comps imply.
- What's the recent tenant-quality profile in this submarket — average credit score on applications, eviction rate, late-payment / NSF rate, and stable-employment percentage? A property-management company in the area should have these aggregated.
- How much new for-sale + rental construction is in the pipeline within 1–3 miles? Heavy new supply typically softens prices + rents 12–24 months out; constrained supply supports both.
Investment metrics
- 1% rule
- 1.08% ✓
- Cap rate
- 7.87%
- Cash-on-cash
- 5.63%
- DSCR
- 1.25
- GRM
- 7.7
CMA / ARV
- ARV (median comp)
- $244,900
- List price
- $173,000
- Delta
- -29.36%
- Verdict
- UNDERPRICED
- Comps
- 3 within 1.0 mi
Show comp detail 2 sales within ~0.75 mi
| Address | Dist | Beds/Ba | Sqft | Sold | Price | $/sf | Match |
|---|---|---|---|---|---|---|---|
| 328 Hometown Way | 0.18mi | 2/2.5 (-1) | 1,152 (-5%) | 11mo | $200,000 | $174 | 67 |
| 217 Farmhouse Rd | 0.23mi | 2/2.5 (-1) | 1,152 (-5%) | 17mo | $189,900 | $165 | 60 |
Match score weights: distance 35% · size 25% · config 20% · recency 20%. Top-matched comps best support the ARV.
Projected returns pro-forma
-3.0% appreciation · 3.0% rent growth · sell at horizon
- IRR
- -7.5%
- Equity multiple
- 0.72×
- Total profit
- $-13,495
- Equity at exit
- $25,795
- IRR
- 2.1%
- Equity multiple
- 1.15×
- Total profit
- $7,133
- Equity at exit
- $14,958
Cash invested: $48,440 (down + closing). Projections, not guarantees.
Landlord ↔ Tenant lean methodology
- Overall (STATE)
- 87 Strongly Landlord-Friendly
- State Texas
- 87 Strongly Landlord-Friendly · R+5
- County
- — inherits STATE
- City
- — inherits STATE
ZIP-level market 76082
- Home prices YoY
- -21.5%
- Active inventory
- 519
- Price-to-rent
- 7.7×
Monthly cashflow live
- Estimated rent
- $1,865 medium interval (Pro) →
- Mortgage (P&I)
- −$907
- Tax from tax record
- −$266 /mo · $3,196/yr
- Insurance
- −$72
- HOA
- −$0
- Vacancy / Maint / Mgmt
- −$392
- Net cashflow
- $227
Break-even live
UW: 25.0% down · 7.5% · 30yr · 1.5% tax · 5.0% vac · 8.0% maint · 8.0% mgmt
Financing live
Cash to close
- Down payment
- $43,250
- Closing costs
- $5,190
- Reserves months
- —
- Total cash needed
- —
Loan-product check · same deal, 3 products live
Conventional
25% down · 7.5% · 30yr
- Down + closing
- —
- Monthly P&I
- —
- Monthly cashflow
- —
- DSCR
- —
- Eligible?
- —
Personal DTI + credit; lowest rate.
DSCR
20% down · 8.5% · 30yr
- Down + closing
- —
- Monthly P&I
- —
- Monthly cashflow
- —
- DSCR
- —
- Eligible?
- —
No personal income docs; deal must DSCR.
Hard money
10% down · 12.0% · 12mo
- Down + closing
- —
- Monthly P&I
- —
- Monthly cashflow
- —
- DSCR
- —
- Eligible?
- —
Short-term bridge; refi at stabilization.
Listing history 22 events
-
2026-06-18days on market $173,000 Active 171 DOM
-
2026-06-17days on market $173,000 Active 170 DOM
-
2026-06-16days on market $173,000 Active 169 DOM
-
2026-06-15days on market $173,000 Active 168 DOM
-
2026-06-13days on market $173,000 Active 166 DOM
-
2026-06-13days on market $173,000 Active 165 DOM
-
2026-06-10price $173,000 Active 162 DOM
-
2026-06-09days on market $180,000 Active 162 DOM
-
2026-06-08days on market $180,000 Active 161 DOM
-
2026-06-07days on market $180,000 Active 160 DOM
-
2026-06-04days on market $180,000 Active 157 DOM
-
2026-06-03days on market $180,000 Active 156 DOM
-
2026-06-02days on market $180,000 Active 155 DOM
-
2026-06-01days on market $180,000 Active 154 DOM
-
2026-05-31days on market $180,000 Active 153 DOM
-
2026-01-28price $180,000 726-char remark
Show marketing remark (726 chars)
Escape the noise and enjoy the calm of this adorable 3 bedroom home situated on a spacious one-acre lot. Located in a quiet, desirable gated community, this property offers privacy, open space, and endless potential. The open concept makes for great entertaining, natural lighting, improves flow, and maximizes usable space. Backyard is partially fenced off, front yard has an adorable covered patio perfect for morning coffee and your after dinner drinks. Plenty of room for outdoor entertaining, pets, hobbies, or future improvements, all while enjoying the tranquility of country style living. Property is listed below market value for a quick sale. Property is being sold as is, so come and see this home before its gone!
-
2025-12-29$190,000 Active 726-char remark
Show marketing remark (726 chars)
Escape the noise and enjoy the calm of this adorable 3 bedroom home situated on a spacious one-acre lot. Located in a quiet, desirable gated community, this property offers privacy, open space, and endless potential. The open concept makes for great entertaining, natural lighting, improves flow, and maximizes usable space. Backyard is partially fenced off, front yard has an adorable covered patio perfect for morning coffee and your after dinner drinks. Plenty of room for outdoor entertaining, pets, hobbies, or future improvements, all while enjoying the tranquility of country style living. Property is listed below market value for a quick sale. Property is being sold as is, so come and see this home before its gone!
-
2025-11-11historical
-
2025-07-22price $185,000
-
2025-07-15price $195,000
-
2025-06-24$209,000 Active
-
2021-03-31soldstatus
ⓘ Source: listings_history table (triggers on properties + properties_extension) + one-shot
backfill from property_details.listing_events for pre-trigger history.
Tax reassessment forecast TX · Resets to sale price
- Current annual tax
- $3,196 · $266/mo
- Projected year-2 tax
- $3,196 · $266/mo
- Expected delta
- $0/yr ($0/mo · 0.0%)
ⓘ Screening estimate from a state-policy table — verify with the county assessor before closing.
Nearby sold comps map
Loading sold comps map…
Walkable amenities ~0.75 mi
Loading nearby amenities…
Taxation est. · year 1
- Rental income
- $22,375
- − Mortgage interest
- −$9,691
- − Property taxes
- −$3,196
- − Insurance
- −$865
- − Repairs & maintenance
- −$1,790
- − Management
- −$1,790
- − Depreciation
- −$5,033
- Taxable income
- $10
- Est. tax owed @ 24.0%
- −$2
- After-tax cash flow
- $2,726/yr
For passive investors: Depreciation is non-cash, so a rental often shows a tax loss while cash-flowing — sheltering income. Rental losses are passive: they offset passive income freely, and up to $25,000/yr can offset ordinary (W-2) income if you actively participate and your MAGI is under $100k (phasing out to $0 by $150k); unused losses carry forward. On sale, claimed depreciation is recaptured at up to 25%, and gains may owe capital-gains tax (a 1031 exchange can defer both). Figures are a year-1 estimate at your 24.0% rate — not tax advice; consult a CPA.
Schools (NCES district)
- District
- Springtown ISD
- NCES district ID
- 4841280
- Math proficiency
- 36% ▼ -14.00%
- Reading proficiency
- 40% ▼ -2.00%
- Median HH income
- $56,136
- Composite
- 33.41/100
- National rank
- #5474
- State rank
- #435 of 826 in TX
Livability — Carter
No livability data for this city. (Only ~50 U.S. cities are tracked.)
Census & demographics
- County
- Parker County · 144,797 people
- Metro
- Dallas-Fort Worth-Arlington, TX
- Population (ZIP)
- 24,880
- Household income
- $92,485
- Rent vs Own
- Severe rent burden
- 333.0
Population outlook (Parker County) Hauer SSP2
- Today (2025)
- 147,426 people
- By 2030
- 157,863 · +7.1%
- By 2040
- 177,519 · +20.4%
- By 2050
- 194,786 · +32.1%
- By 2075
- 238,799 · +62.0%
- By 2100
- 264,126 · +79.2%
Race, ethnicity, and origin ACS 2023
- Neighborhood character
- Predominantly White (80%)
- Race & ethnicity
- White 80% Hispanic / Latino 13% Two or more races 11%
- Hispanic origin (detail)
- Mexican 12%
- Common ancestry
- Slovak 3% Lithuanian 2% Italian 2%
- Foreign-born
- 4% · Canada
- Languages at home
- 93% English-only · Spanish 6%
Political lean MEDSL · Parker
- 2024 margin
- Solid R (+66.4) · D 16.4% · R 82.8%
- 2008→2024 swing
- -11.2pp toward R · 2008: -55.2pp · 2024: -66.4pp
- All cycles
- 2024: R+66.4 2020: R+64.4 2016: R+67.5 2012: R+65.8 2008: R+55.2
Not yet ingested
- Civics
- —
Market trends
- HPI YoY
- ▼ -71.65%
- Current HPI
- 262.1991
- Rent YoY
- —
- Metro
- Dallas-Fort Worth-Arlington, TX
- State GDP YoY
- ▲ 3.95%
- F500 in state
- 110
Industry mix (Fortune 500 HQ in TX)
| Industry | F500 HQs | Revenue |
|---|---|---|
| Energy | 16 | $1,198B |
|
||
| Technology | 5 | $198B |
|
||
| Engineering / Construction | 4 | $72B |
|
||
| Energy Services | 3 | $60B |
|
||
| Utilities | 3 | $41B |
|
||
| Healthcare | 2 | $330B |
|
||
Price history
-13.9% since first listed7 events — show timeline
- 2026-01-28 Price Changed $180,000 NTREIS
- 2025-12-29 Listed $190,000 NTREIS
- 2025-11-11 Listing Removed — NTREIS
- 2025-07-22 Price Changed $185,000 NTREIS
- 2025-07-15 Price Changed $195,000 NTREIS
- 2025-06-24 Listed $209,000 NTREIS
- 2021-03-31 Sold (Public Records) — Public Records
Property tax history
+24.3%/yrLatest (2025): $3,196 · +5.4% YoY. Source: county tax records.
Cash-flow waterfall
monthlySold comps — $/sqft
last 12 mo · ≤1 miLoading sold comps…