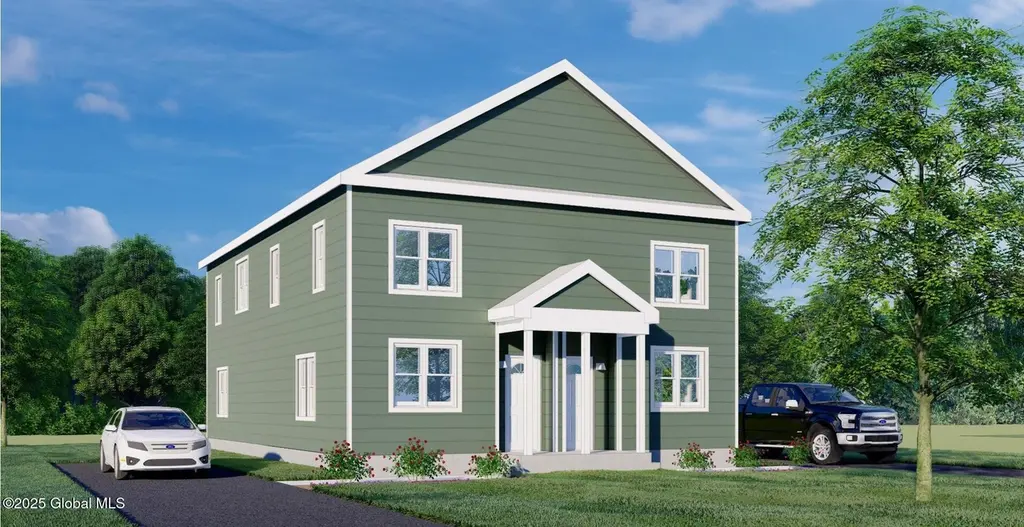
440 Summit Ave · Schenectady, NY
Flood risk No data
- FEMA flood zone
- —
- Chance of flooding over 30 yrs
- —
- Est. flood insurance / yr
- —
Fire risk No data
- Est. fire insurance / yr
- —
Heat risk No data
- Hot days now (above threshold)
- —
- Hot days in 30 yrs
- —
Wind risk No data
- Chance of severe wind over 30 yrs
- —
Air-quality risk No data
- Unhealthy air days now
- —
- Unhealthy air days in 30 yrs
- —
Risk factors via First Street. Map © Google.
Why this score? — see what drove the B- grade
The composite is a weighted blend of 9 inputs, each scored 0–100. Each bar is that input's sub-score; the figure is the points it added to the 100-point composite (weight × sub-score).
- Cash flow +19.3/30.0
- ARV discount +15.0/15.0
- Appreciation +10.0/10.0
- DSCR +6.1/10.0
- 1% rule +5.1/10.0
- Condition / age +4.0/5.0
- Livability +3.9/5.0
- Schools +3.0/10.0
- Rent growth +2.5/5.0
$165,000
🖨 Deal sheet 📄 Offer letter ✓ Due diligence
Listing remarks
This newly constructed townhome, offered through the Affordable Homeownership Opportunity Program (AHOP), provides a modern and affordable path to homeownership for moderate-income first-time buyers. Designed with contemporary finishes and quality craftsmanship, the home offers both comfort and style at a budget-conscious price making it an ideal choice for those seeking long-term stability and equity in a growing community. Let us help you get into your dream home!
Key facts
- 2 parking spots
- Built 2026
- Listed 50 days
Property features AI
Exterior
- Parking: Two parking spaces
- Security: Carbon monoxide detectors; Fire alarm
- Utilities: Public water; Public sewer; Cable available
- Home design: Townhouse; New construction
- Construction: Shingle roof; Drywall and vinyl siding exterior; Concrete perimeter and slab foundation; Built with permanent foundation elements
- Exterior features: Paved driveway
Interior
- Kitchen: Range; Range hood; Dishwasher; Refrigerator; ENERGY STAR qualified appliances
- Bedrooms: Three bedrooms on the second level
- Flooring: Carpet; Linoleum
- Bathrooms: One full bathroom on the second level; One half bathroom on the first level
- Heating & cooling: Heat pump and electric heating; Ductless heating; Ductless cooling
- Interior features: High-speed internet; Radon mitigation system; Instant hot water; Tankless water heater; Low-E windows; Window screens and blinds; Egress window
- Laundry & utility: Washer hookup; Electric dryer hookup; Laundry closet on upper level
Neighborhood map
What this means for you Summary
Snapshot
- This is a 3-bed/1.5-bath land listed at $165k. Condition is rated good.
Deal economics
- At list price, monthly cash flow is $183 ($2k/yr) — positive.
- The deal already cash-flows at list — no discount required.
- Meets the 1% rule at list price ($2k rent vs $165k).
- Recommended offer: $160k (3.0% below list) — sets the bar for market timing.
- Cap rate 7.6% vs local median 6.3% in Schenectady — meaningfully above typical; check what's discounted (condition, days-on-market, listing class) to confirm the premium yield is real.
Location & tenants
- Location reads 78/100 on livability (#167 in NY, #2,597 nationally) — a middle-class / working-renter tenant base. Strengths: commute A+, health & safety A+, cost of living A; Watch: employment D+, crime F.
- Schenectady City School District (urban): math 38% / reading 34% proficiency, ranked #556 of 590 in NY (top 94%) — families likely to look elsewhere, expect single-tenant / working-renter base with shorter leases; 65% free/reduced lunch — lower-income household profile, screen leases tightly.
- Zoned schools: Schenectady High School (math 75% / reading 90%, grade A, #446 of 1,100 statewide, top 41%, 2,743 students, 71% FRL).
- Zoned-school proficiency averages 82% at this address vs 36% district-wide (+46 pts) — the actual schools serving this property are materially stronger than the Schenectady City School District average implies; a family-tenant draw the district grade alone would hide.
- Market conditions: 33 active listings in the ZIP; 14 comparable units currently listed for rent nearby; rentals at typical pace (median 23d on market — plan ~3-4 weeks tenant-placement turnaround); 43% of comp listings sitting > 30 days — soft ceiling on asking rent; 154 units permitted in Schenectady County in 2024 (54 in 5+ unit buildings).
Forward outlook
- In year one you build about $18k of equity ($1k loan paydown + $16k appreciation (10.0% local appreciation)).
- Schenectady County population projected to shrink 4% by 2050 — rents likely to lag national; underwrite the cash flow, not the appreciation.
- At projected returns (10.0% appreciation + 3.0% rent growth), your $46k cash investment doubles in ~3 years — after that, you're playing with house money.
- By year 3, paydown + projected appreciation supports a ~$45k cash-out refi (75% LTV) — recoverable capital for the next deal without selling this one.
Negotiation context
- It's been on market 50 days — a 3% lower offer ($160k) is reasonable based on typical stale-listing flexibility.
Questions for the listing agent
- It's been on market 50 days. Have you received any prior offers? Is the seller open to a 3% concession, seller financing, or rate buy-down credit?
- Is there a deadline driving the sale (1031 exchange, divorce, estate, relocation)? That informs how much negotiation room exists.
- Crime grade is F in this area — have there been break-ins, vandalism, or insurance claims at this property in the last 3 years? What carrier currently insures it and at what premium?
- What's the average days-on-market for RENTAL listings here right now (not sales)? A rising rental-DOM trend means longer vacancies and softer asking-rent achievability than the comps imply.
- What's the recent tenant-quality profile in this submarket — average credit score on applications, eviction rate, late-payment / NSF rate, and stable-employment percentage? A property-management company in the area should have these aggregated.
- How much new for-sale + rental construction is in the pipeline within 1–3 miles? Heavy new supply typically softens prices + rents 12–24 months out; constrained supply supports both.
Investment metrics
- 1% rule
- 1.01% ✓
- Cap rate
- 7.62%
- Cash-on-cash
- 4.74%
- DSCR
- 1.21
- GRM
- 8.2
CMA / ARV
- ARV (median comp)
- $234,941
- List price
- $165,000
- Delta
- -29.77%
- Verdict
- UNDERPRICED
- Comps
- 20 within 1.0 mi
Projected returns pro-forma
10.0% appreciation · 3.0% rent growth · sell at horizon
- IRR
- 27.7%
- Equity multiple
- 3.20×
- Total profit
- $101,522
- Equity at exit
- $148,645
- IRR
- 24.2%
- Equity multiple
- 7.27×
- Total profit
- $289,867
- Equity at exit
- $320,559
Cash invested: $46,200 (down + closing). Projections, not guarantees.
Landlord ↔ Tenant lean methodology
- Overall (STATE)
- 15 Strongly Tenant-Friendly
- State New York
- 15 Strongly Tenant-Friendly · D+10
- County
- — inherits STATE
- City
- — inherits STATE
ZIP-level market 12307
- Home prices YoY
- 3.3%
- Active inventory
- 33
- Price-to-rent
- 8.2×
Monthly cashflow live
- Estimated rent
- $1,675 high interval (Pro) →
- Mortgage (P&I)
- −$865
- Tax est. 1.5%
- −$206 /mo · $2,475/yr
- Insurance
- −$69
- HOA
- −$0
- Vacancy / Maint / Mgmt
- −$352
- Net cashflow
- $183
Break-even live
UW: 25.0% down · 7.5% · 30yr · 1.5% tax · 5.0% vac · 8.0% maint · 8.0% mgmt
Financing live
Cash to close
- Down payment
- $41,250
- Closing costs
- $4,950
- Reserves months
- —
- Total cash needed
- —
Loan-product check · same deal, 3 products live
Conventional
25% down · 7.5% · 30yr
- Down + closing
- —
- Monthly P&I
- —
- Monthly cashflow
- —
- DSCR
- —
- Eligible?
- —
Personal DTI + credit; lowest rate.
DSCR
20% down · 8.5% · 30yr
- Down + closing
- —
- Monthly P&I
- —
- Monthly cashflow
- —
- DSCR
- —
- Eligible?
- —
No personal income docs; deal must DSCR.
Hard money
10% down · 12.0% · 12mo
- Down + closing
- —
- Monthly P&I
- —
- Monthly cashflow
- —
- DSCR
- —
- Eligible?
- —
Short-term bridge; refi at stabilization.
Rent comps 14 comps
| Address | Beds | Baths | Sqft | Rent | $/sqft | DOM | Units | Dist |
|---|---|---|---|---|---|---|---|---|
| 918 Delamont Ave Schenectady, NY | 3.0 | 1.0 | 1192 | $1,600 | $1.34 | 23d | 1 | 0.30mi |
| 117 Washington Ave Schenectady, NY | 2.0–4.0 | 1.0–2.0 | 1033 | $1,515 | $1.47 | 13d | 9 | 0.57mi |
| 13 State St Schenectady, NY | 1.0–2.0 | 1.0 | 923 | $1,768 | $1.92 | 13d | 1 | 0.66mi |
| 762 Eastern Ave Schenectady, NY | 2.0 | 1.0 | 1119 | $1,400 | $1.25 | 23d | 1 | 0.76mi |
| 1130 Pleasant St Schenectady, NY | 2.0 | 1.0 | 1069 | $1,300 | $1.22 | 43d | 1 | 0.82mi |
| 1037 University Pl Unit 2 Schenectady, NY | 3.0 | 1.0 | 1200 | $1,600 | $1.33 | 43d | 1 | 0.97mi |
| 509 Nott St Unit 507 Schenectady, NY | 4.0 | 1.0 | 1400 | $1,695 | $1.21 | 43d | 1 | 1.15mi |
| 2007 Campbell Ave Schenectady, NY | 3.0 | 1.0 | 1272 | $1,600 | $1.26 | 13d | 1 | 1.22mi |
| 2030 Euclid Ave Schenectady, NY | 3.0 | 1.0 | 1300 | $2,000 | $1.54 | 18d | 1 | 1.30mi |
| 830 Plymouth Ave Schenectady, NY | 2.0 | 1.0 | 1200 | $1,700 | $1.42 | 18d | 1 | 1.33mi |
| 1347 Union St Schenectady, NY | 4.0 | 1.5 | 2188 | $3,750 | $1.71 | 43d | 1 | 1.35mi |
| 901 Nott St Unit 1R Schenectady, NY | 3.0 | 1.0 | 1500 | $1,250 | $0.83 | 23d | 1 | 1.36mi |
| 1633 Carrie St Schenectady, NY | 2.0 | 1.0 | 1200 | $1,500 | $1.25 | 43d | 1 | 1.39mi |
| 1673 Van Vranken Ave Schenectady, NY | 3.0 | 1.0 | 1335 | $1,750 | $1.31 | 43d | 1 | 1.48mi |
Listing history 16 events
-
2026-06-18days on market $165,000 Active 50 DOM
-
2026-06-17days on market $165,000 Active 49 DOM
-
2026-06-16days on market $165,000 Active 48 DOM
-
2026-06-15days on market $165,000 Active 47 DOM
-
2026-06-14days on market $165,000 Active 45 DOM
-
2026-06-13days on market $165,000 Active 44 DOM
-
2026-06-10days on market $165,000 Active 42 DOM
-
2026-06-09days on market $165,000 Active 41 DOM
-
2026-06-08days on market $165,000 Active 40 DOM
-
2026-06-07days on market $165,000 Active 39 DOM
-
2026-06-03days on market $165,000 Active 35 DOM
-
2026-06-02days on market $165,000 Active 34 DOM
-
2026-06-01days on market $165,000 Active 33 DOM
-
2026-05-31days on market $165,000 Active 32 DOM
-
2026-05-31days on market $165,000 Active 31 DOM
-
2026-04-29$165,000 Active 470-char remark
ⓘ Source: listings_history table (triggers on properties + properties_extension) + one-shot
backfill from property_details.listing_events for pre-trigger history.
Nearby sold comps map
Loading sold comps map…
Walkable amenities ~0.75 mi
Loading nearby amenities…
Taxation est. · year 1
- Rental income
- $20,095
- − Mortgage interest
- −$9,243
- − Property taxes
- −$2,475
- − Insurance
- −$825
- − Repairs & maintenance
- −$1,608
- − Management
- −$1,608
- − Depreciation
- −$4,800
- Taxable loss
- −$463
- Est. tax savings @ 24.0%
- +$111
- After-tax cash flow
- $2,303/yr
For passive investors: Depreciation is non-cash, so a rental often shows a tax loss while cash-flowing — sheltering income. Rental losses are passive: they offset passive income freely, and up to $25,000/yr can offset ordinary (W-2) income if you actively participate and your MAGI is under $100k (phasing out to $0 by $150k); unused losses carry forward. On sale, claimed depreciation is recaptured at up to 25%, and gains may owe capital-gains tax (a 1031 exchange can defer both). Figures are a year-1 estimate at your 24.0% rate — not tax advice; consult a CPA.
Condition & rehab AI · 1 photo
This newly constructed townhome is in excellent condition with no visible repairs needed. It offers a modern and affordable path to homeownership and is ideal for those seeking long-term stability and equity.
Value-add opportunities
- Both Landscaping — Enhances curb appeal and adds value
- Both Interior paint — Fresh paint can make the interior look new and attractive
Renovation cost estimate screening
Value-add ROI direction
- Both Landscaping — Enhances curb appeal and adds value ↑
- Both Interior paint — Fresh paint can make the interior look new and attractive ↑
ⓘ Cost ranges are severity-bucket heuristics (US national rule-of-thumb). Get contractor quotes + a written scope before underwriting a rehab budget.
Schools (NCES district)
- District
- Schenectady City School District
- NCES district ID
- 3626010
- Math proficiency
- 38% ▲ 12.00%
- Reading proficiency
- 34% ▲ 2.00%
- Median HH income
- $39,453
- Composite
- 30.2/100
- National rank
- #6309
- State rank
- #556 of 590 in NY
Livability — Schenectady
- Score
- 78/100
- State rank
- #167
- US rank
- #2597
Category grades
Schools grade is shown separately in the Schools card above.
Census & demographics
- Census place
- Schenectady, NY
- City population
- 141,369
- Population (ZIP)
- 7,977
Population outlook (Schenectady County) Hauer SSP2
- Today (2025)
- 155,046 people
- By 2030
- 154,322 · -0.5%
- By 2040
- 151,796 · -2.1%
- By 2050
- 148,621 · -4.1%
- By 2075
- 141,229 · -8.9%
- By 2100
- 126,014 · -18.7%
Race, ethnicity, and origin ACS 2023
- Neighborhood character
- Highly diverse neighborhood (Simpson 0.81)
- Race & ethnicity
- Black 28% Hispanic / Latino 25% White 19% Two or more races 16% Asian 11% Native American 3%
- Hispanic origin (detail)
- Mexican 5% Puerto Rican 14% Dominican 3%
- Common ancestry
- Lithuanian 3% Ukrainian 3% Romanian 1%
- Foreign-born
- 32% · Canada, Jamaica, South Korea
- Languages at home
- 79% English-only · Spanish 12% Arabic 2% Other Asian/Pacific 1%
Political lean MEDSL · Schenectady
- 2024 margin
- D (+10.8) · D 55.4% · R 44.6%
- 2008→2024 swing
- -1.8pp toward R · 2008: 12.7pp · 2024: 10.8pp
- All cycles
- 2024: D+10.8 2020: D+15.7 2016: D+5.8 2012: D+15.4 2008: D+12.7
Not yet ingested
- Civics
- —
Market trends
- HPI YoY
- ▲ 12.60%
- Current HPI
- 398.0252
- Rent YoY
- —
- Metro
- —
- State GDP YoY
- ▲ 2.60%
- F500 in state
- 92
Industry mix (Fortune 500 HQ in NY)
| Industry | F500 HQs | Revenue |
|---|---|---|
| Financial Services | 10 | $950B |
|
||
| Consumer Goods | 9 | $162B |
|
||
| Insurance | 4 | $225B |
|
||
| Telecommunications | 2 | $144B |
|
||
| Pharmaceuticals | 2 | $112B |
|
||
| Media / Entertainment | 2 | $69B |
|
||
Price history
1 event — show timeline
- 2026-04-29 Listed $165,000 Global MLS
Cash-flow waterfall
monthlySold comps — $/sqft
last 12 mo · ≤1 miLoading sold comps…