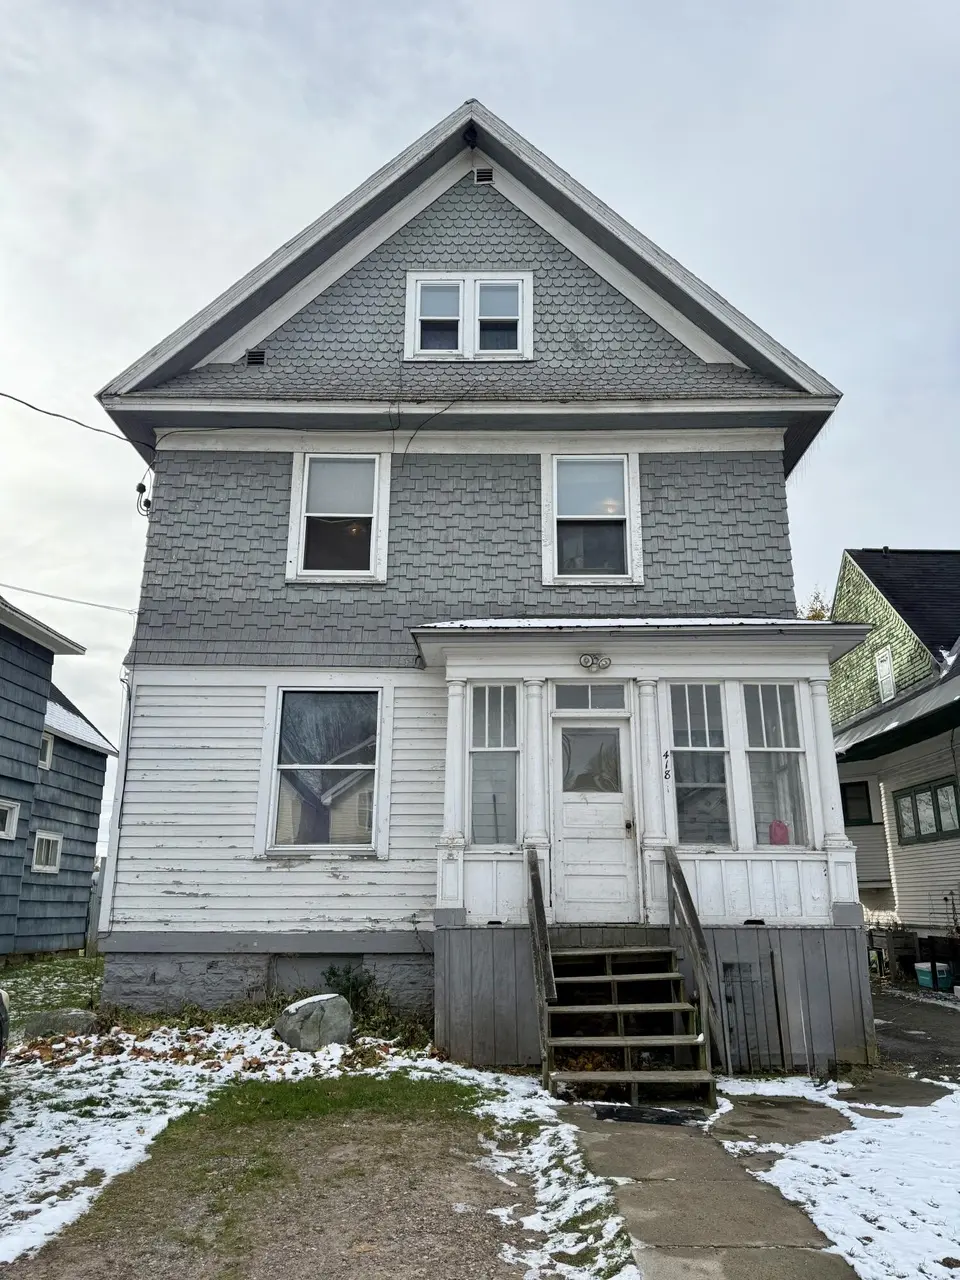
418 Dawson St · Sault Ste. Marie, MI
Flood risk No data
- FEMA flood zone
- —
- Chance of flooding over 30 yrs
- —
- Est. flood insurance / yr
- —
Fire risk No data
- Est. fire insurance / yr
- —
Heat risk No data
- Hot days now (above threshold)
- —
- Hot days in 30 yrs
- —
Wind risk No data
- Chance of severe wind over 30 yrs
- —
Air-quality risk No data
- Unhealthy air days now
- —
- Unhealthy air days in 30 yrs
- —
Risk factors via First Street. Map © Google.
Why this score? — see what drove the B- grade
The composite is a weighted blend of 9 inputs, each scored 0–100. Each bar is that input's sub-score; the figure is the points it added to the 100-point composite (weight × sub-score).
- Cash flow +30.0/30.0
- DSCR +10.0/10.0
- 1% rule +9.3/10.0
- ARV discount +5.4/15.0
- Schools +3.3/10.0
- Rent growth +2.5/5.0
- Livability +2.5/5.0
- Condition / age +2.5/5.0
- Appreciation +0.0/10.0
$99,000
🖨 Deal sheet 📄 Offer letter ✓ Due diligence
Listing remarks MLS
Fantastic investment opportunity in the heart of downtown Sault Ste. Marie with direct views of the canal! This TRIPLEX features a spacious 2-bedroom unit on the main floor, a 3-bedroom unit on the second floor, and a 1-bedroom unit on the third floor. Each unit offers separate electric service, and all tenants are currently on month-to-month leases, providing flexibility for owner occupancy or rent adjustments. Conveniently located within walking distance to shops, dining, and entertainment. Call for your showing today!
Key facts
- Built 1900
- Listed 218 days
Tags
Neighborhood map
What this means for you Summary
Snapshot
- This is a 4-bed/4.0-bath single-family listed at $99k.
Deal economics
- At list price, monthly cash flow is $401 ($5k/yr) — positive.
- The deal already cash-flows at list — no discount required.
- Meets the 1% rule at list price ($1k rent vs $99k).
- Recommended offer: $87k (12.0% below list) — sets the bar for market timing.
- Cap rate 11.2% vs local median 4.5% in Sault Ste. Marie — top-decile yield for the area; either an underpriced asset or a hidden risk that comps aren't pricing in. Stress-test before assuming the spread holds.
Location & tenants
- Location reads: area grade B — affects rentability + tenant quality, not the cash-flow math above.
- Sault Ste. Marie Area Schools (town): math 35% / reading 44% proficiency, ranked #230 of 540 in MI (top 43%) — families likely to look elsewhere, expect single-tenant / working-renter base with shorter leases.
- Market conditions: 125 active listings in the ZIP; 92 units permitted in Chippewa County in 2024 (40 in 5+ unit buildings).
Forward outlook
- Local home prices are declining (-3.0%/yr); year-one equity from $684 of loan paydown is wiped out by about $3k of value loss. Plan a longer hold.
- Chippewa County population projected at -10% by 2050 — secular population decline; favor cash flow + early exit over multi-decade hold.
- At projected returns (-3.0% appreciation + 3.0% rent growth), your $28k cash investment doubles in ~7 years — after that, you're playing with house money.
Negotiation context
- It's been on market 219 days — a 12% lower offer ($87k) is reasonable based on typical stale-listing flexibility.
- Current owner paid $63k; list at $99k implies a 57% gain — meaningful room to come down on a strong offer.
Risks & watch-outs
- Watch-outs: built in 1900 — expect roof / HVAC / electrical / plumbing capex.
Questions for the listing agent
- It's been on market 219 days. Have you received any prior offers? Is the seller open to a 12% concession, seller financing, or rate buy-down credit?
- Built in 1900 — when were the roof, HVAC, electrical panel, plumbing, and water heater last replaced?
- Why hasn't it sold? Are there any deal-killer items the seller is aware of (foundation, flood, title, zoning, code violations)?
- Is there a deadline driving the sale (1031 exchange, divorce, estate, relocation)? That informs how much negotiation room exists.
- What's the average days-on-market for RENTAL listings here right now (not sales)? A rising rental-DOM trend means longer vacancies and softer asking-rent achievability than the comps imply.
- What's the recent tenant-quality profile in this submarket — average credit score on applications, eviction rate, late-payment / NSF rate, and stable-employment percentage? A property-management company in the area should have these aggregated.
- How much new for-sale + rental construction is in the pipeline within 1–3 miles? Heavy new supply typically softens prices + rents 12–24 months out; constrained supply supports both.
Investment metrics
- 1% rule
- 1.43% ✓
- Cap rate
- 11.16%
- Cash-on-cash
- 17.38%
- DSCR
- 1.77
- GRM
- 5.8
CMA / ARV
- ARV (median comp)
- $94,520
- List price
- $99,000
- Delta
- 4.74%
- Verdict
- FAIR
- Comps
- 12 within 1.0 mi
Show comp detail 12 sales within ~0.75 mi
| Address | Dist | Beds/Ba | Sqft | Sold | Price | $/sf | Match |
|---|---|---|---|---|---|---|---|
| 804 Newton Ave | 0.33mi | 4/2.5 | 2,231 (-4%) | 7mo | $239,900 | $108 | 67 |
| 210 E Easterday Ave | 0.39mi | 5/2.0 (+1) | 2,325 (+0%) | 14mo | $100,000 | $43 | 57 |
| 820 Lizzie St | 0.24mi | 3/2.0 (-1) | 2,466 (+6%) | 11mo | $228,000 | $92 | 56 |
| 408 E Portage Ave | 0.32mi | 4/2.0 | 2,096 (-10%) | 8mo | $300,000 | $143 | 54 |
| 330 Maple St | 0.30mi | 4/1.5 | 2,209 (-5%) | 21mo | $167,500 | $76 | 51 |
| 806 E Spruce St | 0.54mi | 4/2.5 | 2,356 (+2%) | 22mo | $229,900 | $98 | 48 |
| 1205 Seymour St | 0.52mi | 4/2.0 | 2,164 (-7%) | 12mo | $330,000 | $152 | 47 |
| 806 Court St | 0.46mi | 4/2.0 | 2,200 (-5%) | 20mo | $174,900 | $80 | 45 |
| 710 Cedar St | 0.46mi | 4/1.5 | 2,432 (+5%) | 22mo | $167,000 | $69 | 42 |
| 1016 E 6th Ave | 0.54mi | 4/1.0 | 2,228 (-4%) | 20mo | $188,000 | $84 | 40 |
| 707 Cedar St | 0.46mi | 5/2.0 (+1) | 2,042 (-12%) | 10mo | $199,000 | $97 | 37 |
| 301 Bingham Ave | 0.33mi | 4/1.0 | 2,052 (-12%) | 21mo | $99,000 | $48 | 36 |
Match score weights: distance 35% · size 25% · config 20% · recency 20%. Top-matched comps best support the ARV.
Projected returns pro-forma
-3.0% appreciation · 3.0% rent growth · sell at horizon
- IRR
- 8.8%
- Equity multiple
- 1.34×
- Total profit
- $9,563
- Equity at exit
- $14,761
- IRR
- 18.0%
- Equity multiple
- 2.49×
- Total profit
- $41,412
- Equity at exit
- $8,560
Cash invested: $27,720 (down + closing). Projections, not guarantees.
Landlord ↔ Tenant lean methodology
- Overall (STATE)
- 62 Landlord-Friendly
- State Michigan
- 62 Landlord-Friendly · EVEN
- County
- — inherits STATE
- City
- — inherits STATE
ZIP-level market 49783
- Active inventory
- 125
- Price-to-rent
- 5.8×
Monthly cashflow live
- Estimated rent
- $1,415 medium interval (Pro) →
- Mortgage (P&I)
- −$519
- Tax from tax record
- −$156 /mo · $1,868/yr
- Insurance
- −$41
- HOA
- −$0
- Vacancy / Maint / Mgmt
- −$297
- Net cashflow
- $401
Break-even live
UW: 25.0% down · 7.5% · 30yr · 1.5% tax · 5.0% vac · 8.0% maint · 8.0% mgmt
Financing live
Cash to close
- Down payment
- $24,750
- Closing costs
- $2,970
- Reserves months
- —
- Total cash needed
- —
Loan-product check · same deal, 3 products live
Conventional
25% down · 7.5% · 30yr
- Down + closing
- —
- Monthly P&I
- —
- Monthly cashflow
- —
- DSCR
- —
- Eligible?
- —
Personal DTI + credit; lowest rate.
DSCR
20% down · 8.5% · 30yr
- Down + closing
- —
- Monthly P&I
- —
- Monthly cashflow
- —
- DSCR
- —
- Eligible?
- —
No personal income docs; deal must DSCR.
Hard money
10% down · 12.0% · 12mo
- Down + closing
- —
- Monthly P&I
- —
- Monthly cashflow
- —
- DSCR
- —
- Eligible?
- —
Short-term bridge; refi at stabilization.
Listing history 17 events
-
2026-06-18days on market $99,000 Active 219 DOM
-
2026-06-17days on market $99,000 Active 218 DOM
-
2026-06-16days on market $99,000 Active 217 DOM
-
2026-06-15days on market $99,000 Active 216 DOM
-
2026-06-13days on market $99,000 Active 214 DOM
-
2026-06-12days on market $99,000 Active 213 DOM
-
2026-06-09days on market $99,000 Active 210 DOM
-
2026-06-08days on market $99,000 Active 209 DOM
-
2026-06-07days on market $99,000 Active 208 DOM
-
2026-06-07days on market $99,000 Active 207 DOM
-
2026-06-04days on market $99,000 Active 204 DOM
-
2026-06-02days on market $99,000 Active 203 DOM
-
2026-06-01days on market $99,000 Active 202 DOM
-
2026-05-31days on market $99,000 Active 201 DOM
-
2026-05-31days on market $99,000 Active 200 DOM
-
2025-11-11$99,000 Active 526-char remark
Show marketing remark (526 chars)
Fantastic investment opportunity in the heart of downtown Sault Ste. Marie with direct views of the canal! This TRIPLEX features a spacious 2-bedroom unit on the main floor, a 3-bedroom unit on the second floor, and a 1-bedroom unit on the third floor. Each unit offers separate electric service, and all tenants are currently on month-to-month leases, providing flexibility for owner occupancy or rent adjustments. Conveniently located within walking distance to shops, dining, and entertainment. Call for your showing today!
-
2005-09-16soldstatus $63,000
ⓘ Source: listings_history table (triggers on properties + properties_extension) + one-shot
backfill from property_details.listing_events for pre-trigger history.
Tax reassessment forecast MI · Partial reset (capped growth)
- Current annual tax
- $1,868 · $156/mo
- Projected year-2 tax
- $1,868 · $156/mo
- Expected delta
- $0/yr ($0/mo · 0.0%)
ⓘ Screening estimate from a state-policy table — verify with the county assessor before closing.
Nearby sold comps map
Loading sold comps map…
Walkable amenities ~0.75 mi
Loading nearby amenities…
Taxation est. · year 1
- Rental income
- $16,975
- − Mortgage interest
- −$5,546
- − Property taxes
- −$1,868
- − Insurance
- −$495
- − Repairs & maintenance
- −$1,358
- − Management
- −$1,358
- − Depreciation
- −$2,880
- Taxable income
- $3,470
- Est. tax owed @ 24.0%
- −$833
- After-tax cash flow
- $3,984/yr
For passive investors: Depreciation is non-cash, so a rental often shows a tax loss while cash-flowing — sheltering income. Rental losses are passive: they offset passive income freely, and up to $25,000/yr can offset ordinary (W-2) income if you actively participate and your MAGI is under $100k (phasing out to $0 by $150k); unused losses carry forward. On sale, claimed depreciation is recaptured at up to 25%, and gains may owe capital-gains tax (a 1031 exchange can defer both). Figures are a year-1 estimate at your 24.0% rate — not tax advice; consult a CPA.
Schools (NCES district)
- District
- Sault Ste. Marie Area Schools
- NCES district ID
- 2630990
- Math proficiency
- 35% ▼ -9.00%
- Reading proficiency
- 44% ▼ -12.00%
- Median HH income
- $40,273
- Composite
- 33.12/100
- National rank
- #5559
- State rank
- #230 of 540 in MI
Livability — Sault Ste. Marie
No livability data for this city. (Only ~50 U.S. cities are tracked.)
Census & demographics
- Census place
- Sault Ste. Marie, MI
- Population (ZIP)
- 18,778
Population outlook (Chippewa County) Hauer SSP2
- Today (2025)
- 37,043 people
- By 2030
- 36,431 · -1.7%
- By 2040
- 34,911 · -5.8%
- By 2050
- 33,350 · -10.0%
- By 2075
- 29,789 · -19.6%
- By 2100
- 24,171 · -34.7%
Race, ethnicity, and origin ACS 2023
- Neighborhood character
- Predominantly White (70%)
- Race & ethnicity
- White 70% Native American 14% Two or more races 13% Hispanic / Latino 2%
- Common ancestry
- Lithuanian 6% Romanian 6% Slovak 4%
- Foreign-born
- 4% · Canada, Vietnam, Guatemala
- Languages at home
- 95% English-only · Spanish 1% Other Indo-European 1% German/W. Germanic 1%
Political lean MEDSL · Chippewa
- 2024 margin
- Strong R (+24.2) · D 37.0% · R 61.3% · Other 1.7%
- 2008→2024 swing
- -23.8pp toward R · 2008: -0.5pp · 2024: -24.2pp
- All cycles
- 2024: R+24.2 2020: R+22.9 2016: R+24.2 2012: R+7.6 2008: R+0.5
Not yet ingested
- Civics
- —
Market trends
- HPI YoY
- ▼ -183.63%
- Current HPI
- 149.9878
- Rent YoY
- —
- Metro
- —
- State GDP YoY
- ▲ 1.37%
- F500 in state
- 28
Industry mix (Fortune 500 HQ in MI)
| Industry | F500 HQs | Revenue |
|---|---|---|
| Automotive Parts | 3 | $48B |
|
||
| Automotive | 2 | $372B |
|
||
| Chemicals | 1 | $45B |
|
||
| Automotive Retail | 1 | $29B |
|
||
| Healthcare / Medical Devices | 1 | $23B |
|
||
| Automotive Technology | 1 | $20B |
|
||
Price history
+57.1% since first listed2 events — show timeline
- 2025-11-11 Listed $99,000 EUPBR
- 2005-09-16 Sold (Public Records) $63,000 Public Records
Property tax history
+2.3%/yrLatest (2024): $1,868 · +192.7% YoY. Source: county tax records.
Cash-flow waterfall
monthlySold comps — $/sqft
last 12 mo · ≤1 miLoading sold comps…