 Fourplex
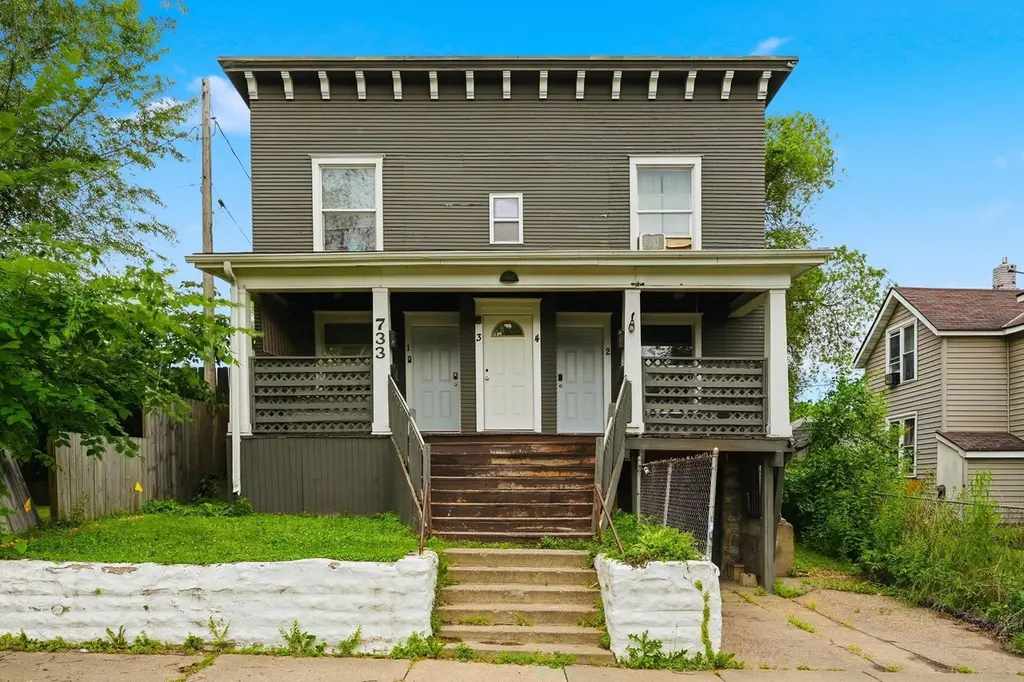
733 Bradley St · St. Paul, MN
Flood risk 1/10 · Minimal
- FEMA flood zone
- X (unshaded)
- Chance of flooding over 30 yrs
- 0.0%
- Est. flood insurance / yr
- $473 – $860
Fire risk 1/10 · Minimal
- Est. fire insurance / yr
- $888 – $1,650
Heat risk 2/10 · Minimal
- Hot days now (above 99°F)
- 7 days/yr
- Hot days in 30 yrs
- 14 days/yr
Wind risk 2/10 · Minimal
- Chance of severe wind over 30 yrs
- —
Air-quality risk 2/10 · Minimal
- Unhealthy air days now
- 1 days/yr
- Unhealthy air days in 30 yrs
- 1 days/yr
Risk factors via First Street. Map © Google.
Why this score? — see what drove the B- grade
The composite is a weighted blend of 9 inputs, each scored 0–100. Each bar is that input's sub-score; the figure is the points it added to the 100-point composite (weight × sub-score).
- Cash flow +30.0/30.0
- DSCR +10.0/10.0
- 1% rule +9.5/10.0
- ARV discount +7.5/15.0
- Rent growth +3.5/5.0
- Livability +2.5/5.0
- Condition / age +2.5/5.0
- Schools +2.4/10.0
- Appreciation +0.0/10.0
$619,000
🖨 Deal sheet 📄 Offer letter ✓ Due diligence
Multi-family units
County records classify this as Multi-Family (5+ Unit). Listing-text estimate: 4 units. estimate disagrees with records
5+ unit building — per-unit beds/baths from public records are typically unavailable; the breakdown below (if shown) is an estimate from the listing text.
Listing remarks MLS
Excellent investment opportunity-- here's your chance to own a high income producing property! Large, turn key, 4 plex with 2 and 3 bedroom units is conveniently located near public transit and downtown St. Paul. Fully rented with strong rental history.
Key facts
- 4,878 sq ft lot
- 4 parking spots
- Built 1915
Property features AI
Finance
- Other: Four total units; Unit mix: two 3-bedroom units and two 2-bedroom units; Unit features include natural woodwork and kitchen windows; Total living area reported at 4,100 (above grade); building total area 6,150
- Financial info: Conventional mortgage type; Estimated electric expense: $800; Estimated fuel expense: $1,200; Not owner occupied (investment property)
Exterior
- Parking: On-site parking (1 space per unit indicated)
- Utilities: City water (connected); City sewer (connected); Natural gas
- Home design: Residential income property; Two levels; Main level and additional levels (multi-unit layout)
- Construction: Block foundation
- Exterior features: Stone and wood exterior
Interior
- Kitchen: Range; Refrigerator
- Bedrooms: Total of 10 bedrooms across units
- Flooring: Hardwood floors
- Bathrooms: Four full bathrooms across units (each unit has 1 full bath)
- Heating & cooling: Forced air heating; Hot water heating; Window cooling units
- Interior features: Hardwood floors; Natural woodwork; Kitchen window; Full, unfinished block basement with shared access, storage/locker
- Laundry & utility: Laundry in basement
Neighborhood map
What this means for you Summary
Snapshot
- This is a 4 × 2-bed/1.0-bath units multifamily listed at $619k.
Deal economics
- At list price, monthly cash flow is $2k ($28k/yr) — positive. Per door: $576/mo.
- The deal already cash-flows at list — no discount required.
- Meets the 1% rule at list price ($9k rent vs $619k).
Location & tenants
- Location reads: area grade B — affects rentability + tenant quality, not the cash-flow math above.
- St. Paul Public School District (urban): math 21% / reading 33% proficiency, ranked #270 of 301 in MN (top 90%) — low school quality limits family demand, transient renter base, plan for 1-2y turnover; 64% free/reduced lunch — lower-income household profile, screen leases tightly.
- Market conditions: Rents rising (+3.9%/yr); 58 active listings in the ZIP; 1,202 units permitted in Ramsey County in 2024 (880 in 5+ unit buildings).
- At $8,961/mo this rent would consume 199% of the median local household income ($54k/yr) (locally 818% of renters already pay >50% of income on rent) — very limited rent-growth headroom before tenants either downsize or default.
Forward outlook
- Local home prices are declining (-3.0%/yr); year-one equity from $4k of loan paydown is wiped out by about $19k of value loss. Plan a longer hold.
- Ramsey County population projected at +27% by 2050 — long-run rental-demand tailwind backs the buy-and-hold thesis.
- At projected returns (-3.0% appreciation + 3.9% rent growth), your $173k cash investment doubles in ~7 years — after that, you're playing with house money.
Negotiation context
- Only 1 days on market — expect competitive offers; lowballing is unlikely to land.
- 8 sale attempts since 31y ago with the ask held roughly flat each time — persistent listings suggest the price (not the market) is what's stuck; bring a comps-based counter.
- Current owner paid $512k; 21% above their basis — modest negotiation headroom, anchor on the comps not their cost.
Risks & watch-outs
- Watch-outs: built in 1915 — expect roof / HVAC / electrical / plumbing capex.
Questions for the listing agent
- Can we see the unit-by-unit rent roll, current vacancy, and any below-market leases? What's the average tenancy length?
- What capital expenditures (roof, boiler, parking lot, exteriors) have been made in the last 5 years, and what's planned in the next 2?
- Built in 1915 — when were the roof, HVAC, electrical panel, plumbing, and water heater last replaced?
- Is there a deadline driving the sale (1031 exchange, divorce, estate, relocation)? That informs how much negotiation room exists.
- What's the average days-on-market for RENTAL listings here right now (not sales)? A rising rental-DOM trend means longer vacancies and softer asking-rent achievability than the comps imply.
- What's the recent tenant-quality profile in this submarket — average credit score on applications, eviction rate, late-payment / NSF rate, and stable-employment percentage? A property-management company in the area should have these aggregated.
- How much new apartment / multifamily construction is in the pipeline within 1–3 miles? Heavy new supply (>2% of stock underway) typically softens rents 12–24 months out; light construction supports rent growth.
Investment metrics
- 1% rule
- 1.45% ✓
- Cap rate
- 10.76%
- Cash-on-cash
- 15.96%
- DSCR
- 1.71
- GRM
- 5.8
CMA / ARV
No comps found within radius.
Projected returns pro-forma
-3.0% appreciation · 3.94% rent growth · sell at horizon
- IRR
- 8.1%
- Equity multiple
- 1.32×
- Total profit
- $55,549
- Equity at exit
- $92,295
- IRR
- 18.2%
- Equity multiple
- 2.59×
- Total profit
- $275,044
- Equity at exit
- $53,520
Cash invested: $173,320 (down + closing). Projections, not guarantees.
Landlord ↔ Tenant lean methodology
- Overall (STATE)
- 46 Balanced
- State Minnesota
- 46 Balanced · D+2
- County
- — inherits STATE
- City
- — inherits STATE
ZIP-level market 55130
- Home prices YoY
- -17.6%
- Rents YoY
- 3.9%
- Active inventory
- 58
- Price-to-rent
- 23.0×
Monthly cashflow live
- Estimated rent
- $8,961 high interval (Pro) →
- Mortgage (P&I)
- −$3,246
- Tax from tax record
- −$1,269 /mo · $15,232/yr
- Insurance
- −$258
- HOA
- −$0
- Vacancy / Maint / Mgmt
- −$1,882
- Net cashflow
- $2,306
Break-even live
4-unit breakdown (identical units grouped — click to expand)
| Units | Beds | Baths | Est. rent |
|---|---|---|---|
| 4× units | 2 | 1 | $8,960 |
| #1 | 2 | 1 | $2,240 |
| #2 | 2 | 1 | $2,240 |
| #3 | 2 | 1 | $2,240 |
| #4 | 2 | 1 | $2,240 |
| Total (4 units) | $8,961 | ||
UW: 25.0% down · 7.5% · 30yr · 1.5% tax · 5.0% vac · 8.0% maint · 8.0% mgmt
Financing live
Cash to close
- Down payment
- $154,750
- Closing costs
- $18,570
- Reserves months
- —
- Total cash needed
- —
Loan-product check · same deal, 3 products live
Conventional
25% down · 7.5% · 30yr
- Down + closing
- —
- Monthly P&I
- —
- Monthly cashflow
- —
- DSCR
- —
- Eligible?
- —
Personal DTI + credit; lowest rate.
DSCR
20% down · 8.5% · 30yr
- Down + closing
- —
- Monthly P&I
- —
- Monthly cashflow
- —
- DSCR
- —
- Eligible?
- —
No personal income docs; deal must DSCR.
Hard money
10% down · 12.0% · 12mo
- Down + closing
- —
- Monthly P&I
- —
- Monthly cashflow
- —
- DSCR
- —
- Eligible?
- —
Short-term bridge; refi at stabilization.
Listing history 2 events
-
2026-06-18remarks 345-char remark
-
2026-06-18$619,000 Active 1 DOM
ⓘ Source: listings_history table (triggers on properties + properties_extension) + one-shot
backfill from property_details.listing_events for pre-trigger history.
Tax reassessment forecast MN · Partial reset (capped growth)
- Current annual tax
- $15,232 · $1,269/mo
- Projected year-2 tax
- $15,232 · $1,269/mo
- Expected delta
- $0/yr ($0/mo · 0.0%)
ⓘ Screening estimate from a state-policy table — verify with the county assessor before closing.
Climate risk First Street
- Flood 1/10 Low FEMA zone X (unshaded) · 0% chance over 30 yrs
- Wildfire 1/10 Low
- Heat 2/10 Low 7 d/yr ≥99°F today · 14 d/yr by 30 yrs out
- Wind 2/10 Low
- Air quality 2/10 Low 1 unhealthy d/yr today · 1 by 30 yrs out
Nearby sold comps map
Loading sold comps map…
Walkable amenities ~0.75 mi
Loading nearby amenities…
Taxation est. · year 1
- Rental income
- $107,532
- − Mortgage interest
- −$34,674
- − Property taxes
- −$15,232
- − Insurance
- −$3,095
- − Repairs & maintenance
- −$8,603
- − Management
- −$8,603
- − Depreciation
- −$18,007
- Taxable income
- $19,319
- Est. tax owed @ 24.0%
- −$4,637
- After-tax cash flow
- $23,033/yr
For passive investors: Depreciation is non-cash, so a rental often shows a tax loss while cash-flowing — sheltering income. Rental losses are passive: they offset passive income freely, and up to $25,000/yr can offset ordinary (W-2) income if you actively participate and your MAGI is under $100k (phasing out to $0 by $150k); unused losses carry forward. On sale, claimed depreciation is recaptured at up to 25%, and gains may owe capital-gains tax (a 1031 exchange can defer both). Figures are a year-1 estimate at your 24.0% rate — not tax advice; consult a CPA.
Schools (NCES district)
- District
- St. Paul Public School District
- NCES district ID
- 2733840
- Math proficiency
- 21% ▼ -11.00%
- Reading proficiency
- 33% ▼ -7.00%
- Median HH income
- $48,316
- Composite
- 23.51/100
- National rank
- #7868
- State rank
- #270 of 301 in MN
Livability — St. Paul
No livability data for this city. (Only ~50 U.S. cities are tracked.)
Census & demographics
- Census place
- St. Paul, MN
- County
- Ramsey County · 542,837 people
- City population
- 280,599
- Metro
- Minneapolis-St. Paul-Bloomington, MN-WI
- Population (ZIP)
- 17,775
- Household income
- $54,130
- Rent vs Own
- Severe rent burden
- 818.0
Population outlook (Ramsey County) Hauer SSP2
- Today (2025)
- 603,431 people
- By 2030
- 636,459 · +5.5%
- By 2040
- 700,596 · +16.1%
- By 2050
- 765,819 · +26.9%
- By 2075
- 929,297 · +54.0%
- By 2100
- 1,053,924 · +74.7%
Race, ethnicity, and origin ACS 2023
- Neighborhood character
- Diverse neighborhood (Simpson 0.69)
- Race & ethnicity
- Asian 47% Black 22% White 19% Hispanic / Latino 9% Two or more races 4%
- Hispanic origin (detail)
- Mexican 6%
- Common ancestry
- Portuguese 3% Swedish 2% Romanian 1%
- Foreign-born
- 33% · Philippines, Canada, Vietnam
- Languages at home
- 44% English-only · Other Asian/Pacific 37% Spanish 7% Other Indo-European 1%
Political lean MEDSL · Ramsey
- 2024 margin
- Solid D (+43.3) · D 70.5% · R 27.2% · Other 2.3%
- 2008→2024 swing
- +9.4pp toward D · 2008: 33.9pp · 2024: 43.3pp
- All cycles
- 2024: D+43.3 2020: D+45.4 2016: D+39.4 2012: D+35.3 2008: D+33.9
Not yet ingested
- Civics
- —
Market trends
- HPI YoY
- ▼ -60.12%
- Current HPI
- 281.2507
- Rent YoY
- ▲ 3.94%
- Metro
- Minneapolis-St. Paul-Bloomington, MN-WI
- State GDP YoY
- ▲ 2.41%
- F500 in state
- 34
Industry mix (Fortune 500 HQ in MN)
| Industry | F500 HQs | Revenue |
|---|---|---|
| Healthcare | 2 | $407B |
|
||
| Retail | 2 | $150B |
|
||
| Consumer Goods | 2 | $32B |
|
||
| Industrial Machinery | 2 | $6B |
|
||
| Agriculture | 1 | $40B |
|
||
| Healthcare / Medical Devices | 1 | $32B |
|
||
Price history
+1673.6% since first listed23 events — show timeline
- 2026-06-12 Listed $619,000 NORTHSTARMLS as Distributed by MLS Grid
- 2022-08-12 Sold (MLS) $512,000 NORTHSTARMLS as Distributed by MLS Grid
- 2022-07-06 Pending — NORTHSTARMLS as Distributed by MLS Grid
- 2022-06-27 Contingent — NORTHSTARMLS as Distributed by MLS Grid
- 2022-06-17 Listed $515,000 NORTHSTARMLS as Distributed by MLS Grid
- 2016-07-26 Sold (Public Records) $275,000 Public Records
- 2016-06-30 Sold (MLS) $275,000 NORTHSTARMLS as Distributed by MLS Grid
- 2016-05-17 Pending — NORTHSTARMLS as Distributed by MLS Grid
- 2016-03-07 Relisted — NORTHSTARMLS as Distributed by MLS Grid
- 2016-02-29 Contingent — NORTHSTARMLS as Distributed by MLS Grid
- 2016-02-11 Listed $270,000 NORTHSTARMLS as Distributed by MLS Grid
- 2012-04-13 Sold (MLS) $215,000 NORTHSTARMLS as Distributed by MLS Grid
- 2012-01-09 Listed $220,000 NORTHSTARMLS as Distributed by MLS Grid
- 2008-03-06 Sold (MLS) $98,000 NORTHSTARMLS as Distributed by MLS Grid
- 2008-02-20 Listing Removed — NORTHSTARMLS as Distributed by MLS Grid
- 2007-11-26 Listed $139,900 NORTHSTARMLS as Distributed by MLS Grid
- 2007-11-14 Listing Removed — NORTHSTARMLS as Distributed by MLS Grid
- 2006-12-13 Listed $320,000 NORTHSTARMLS as Distributed by MLS Grid
- 2005-11-30 Sold (Public Records) $370,000 Public Records
- 2004-06-15 Sold (Public Records) $325,000 Public Records
- 1996-02-29 Sold (MLS) $31,750 NORTHSTARMLS as Distributed by MLS Grid
- 1996-01-05 Listing Removed — NORTHSTARMLS as Distributed by MLS Grid
- 1995-11-24 Listed $34,900 NORTHSTARMLS as Distributed by MLS Grid
Property tax history
+12.2%/yrLatest (2025): $15,232 · +48.1% YoY. Source: county tax records.
Cash-flow waterfall
monthlySold comps — $/sqft
last 12 mo · ≤1 miLoading sold comps…