320 N Blackstone St #14 · Tulare, CA
Flood risk 1/10 · Minimal
- FEMA flood zone
- X (unshaded)
- Chance of flooding over 30 yrs
- 0.0%
- Est. flood insurance / yr
- $507 – $1,088
Fire risk 5/10 · Moderate
- Est. fire insurance / yr
- $659 – $1,223
Heat risk 7/10 · Major
- Hot days now (above 105°F)
- 7 days/yr
- Hot days in 30 yrs
- 17 days/yr
Wind risk 1/10 · Minimal
- Chance of severe wind over 30 yrs
- —
Air-quality risk 10/10 · Severe
- Unhealthy air days now
- 33 days/yr
- Unhealthy air days in 30 yrs
- 38 days/yr
Risk factors via First Street. Map © Google.
Why this score? — see what drove the B- grade
The composite is a weighted blend of 9 inputs, each scored 0–100. Each bar is that input's sub-score; the figure is the points it added to the 100-point composite (weight × sub-score).
- Cash flow +30.0/30.0
- 1% rule +10.0/10.0
- DSCR +10.0/10.0
- ARV discount +7.5/15.0
- Rent growth +3.2/5.0
- Schools +3.0/10.0
- Livability +2.9/5.0
- Condition / age +2.5/5.0
- Appreciation +0.0/10.0
$39,900
🖨 Deal sheet 📄 Offer letter ✓ Due diligence
Listing remarks MLS
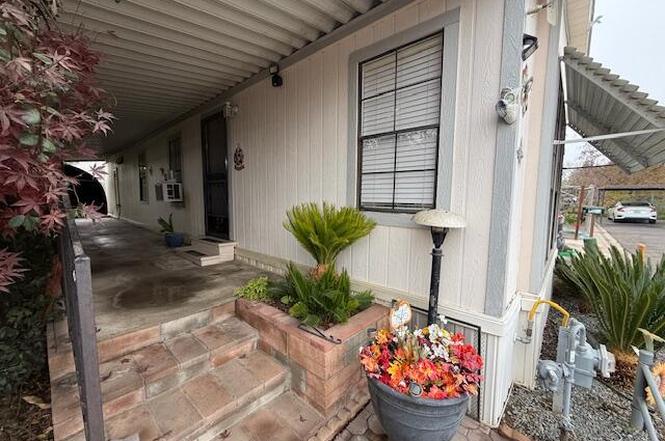
2 bed 1 bath mobile home located in the heart of the city. This unit is located in the peaceful 55+ Mountain View Mobile Home Estates and is ready for its new owner.
Key facts
- Newer appliances
- Storage shed
- Generous backyard
Tags
Neighborhood map
What this means for you Summary
Snapshot
- This is a 2-bed/1.0-bath land listed at $40k.
Deal economics
- At list price, monthly cash flow is $941 ($11k/yr) — positive.
- The deal already cash-flows at list — no discount required.
- Meets the 1% rule at list price ($1k rent vs $40k).
- Recommended offer: $36k (9.0% below list) — sets the bar for market timing.
- Cap rate 34.6% vs local median 3.3% in Tulare — top-decile yield for the area; either an underpriced asset or a hidden risk that comps aren't pricing in. Stress-test before assuming the spread holds.
Location & tenants
- Location reads 58/100 on livability (#701 in CA) — a working-class tenant base; expect higher turnover. Strengths: housing A+; Watch: commute C-, employment D+, schools D-.
- Tulare Joint Union High (suburban): math 18% / reading 52% proficiency, ranked #280 of 517 in CA (top 54%) — families likely to look elsewhere, expect single-tenant / working-renter base with shorter leases.
- Market conditions: Rents rising (+2.7%/yr); 352 active listings in the ZIP; 1 comparable units currently listed for rent nearby; 1,447 units permitted in Tulare County in 2024 (307 in 5+ unit buildings).
Forward outlook
- Local home prices are declining (-3.0%/yr); year-one equity from $276 of loan paydown is wiped out by about $1k of value loss. Plan a longer hold.
- Tulare County population projected at +10% by 2050 — modest demand growth; plan on rents tracking national, not racing it.
- At projected returns (-3.0% appreciation + 2.7% rent growth), your $11k cash investment doubles in ~2 years — after that, you're playing with house money.
Negotiation context
- It's been on market 112 days — a 9% lower offer ($36k) is reasonable based on typical stale-listing flexibility.
- 2 sale attempts since 10y ago; this cycle's ask has dropped $5k (11%) from the opening price — seller is motivated, your offer sets the floor, not the list.
- Current owner paid $6k; list at $40k implies a 514% gain — meaningful room to come down on a strong offer.
Risks & watch-outs
- Climate carrying-cost: moderate wildfire risk; extreme-heat days projected 7→17/yr by 2055 (HVAC capex compounding) — expect insurance premiums to compound above CPI over the hold.
Questions for the listing agent
- It's been on market 112 days. Have you received any prior offers? Is the seller open to a 9% concession, seller financing, or rate buy-down credit?
- Why hasn't it sold? Are there any deal-killer items the seller is aware of (foundation, flood, title, zoning, code violations)?
- Is there a deadline driving the sale (1031 exchange, divorce, estate, relocation)? That informs how much negotiation room exists.
- Schools are D-rated, which usually means shorter tenancies and higher turnover. Who's the typical renter profile here, and what's been the actual vacancy rate?
- Crime grade is F in this area — have there been break-ins, vandalism, or insurance claims at this property in the last 3 years? What carrier currently insures it and at what premium?
- What's the average days-on-market for RENTAL listings here right now (not sales)? A rising rental-DOM trend means longer vacancies and softer asking-rent achievability than the comps imply.
- What's the recent tenant-quality profile in this submarket — average credit score on applications, eviction rate, late-payment / NSF rate, and stable-employment percentage? A property-management company in the area should have these aggregated.
- How much new for-sale + rental construction is in the pipeline within 1–3 miles? Heavy new supply typically softens prices + rents 12–24 months out; constrained supply supports both.
Investment metrics
- 1% rule
- 3.73% ✓
- Cap rate
- 34.59%
- Cash-on-cash
- 101.06%
- DSCR
- 5.50
- GRM
- 2.2
CMA / ARV
No comps found within radius.
Projected returns pro-forma
-3.0% appreciation · 2.67% rent growth · sell at horizon
- IRR
- —
- Equity multiple
- 5.74×
- Total profit
- $52,966
- Equity at exit
- $5,949
- IRR
- —
- Equity multiple
- 11.85×
- Total profit
- $121,267
- Equity at exit
- $3,450
Cash invested: $11,172 (down + closing). Projections, not guarantees.
Landlord ↔ Tenant lean methodology
- Overall (STATE)
- 18 Strongly Tenant-Friendly
- State California
- 18 Strongly Tenant-Friendly · D+13
- County
- — inherits STATE
- City
- — inherits STATE
ZIP-level market 93274
- Rents YoY
- 2.7%
- Active inventory
- 352
- Price-to-rent
- 2.2×
Monthly cashflow live
- Estimated rent
- $1,486 medium interval (Pro) →
- Mortgage (P&I)
- −$209
- Tax from tax record
- −$7 /mo · $89/yr
- Insurance
- −$17
- HOA
- −$0
- Vacancy / Maint / Mgmt
- −$312
- Net cashflow
- $941
Break-even live
UW: 25.0% down · 7.5% · 30yr · 1.5% tax · 5.0% vac · 8.0% maint · 8.0% mgmt
Financing live
Cash to close
- Down payment
- $9,975
- Closing costs
- $1,197
- Reserves months
- —
- Total cash needed
- —
Loan-product check · same deal, 3 products live
Conventional
25% down · 7.5% · 30yr
- Down + closing
- —
- Monthly P&I
- —
- Monthly cashflow
- —
- DSCR
- —
- Eligible?
- —
Personal DTI + credit; lowest rate.
DSCR
20% down · 8.5% · 30yr
- Down + closing
- —
- Monthly P&I
- —
- Monthly cashflow
- —
- DSCR
- —
- Eligible?
- —
No personal income docs; deal must DSCR.
Hard money
10% down · 12.0% · 12mo
- Down + closing
- —
- Monthly P&I
- —
- Monthly cashflow
- —
- DSCR
- —
- Eligible?
- —
Short-term bridge; refi at stabilization.
Rent comps 1 comps
| Address | Beds | Baths | Sqft | Rent | $/sqft | DOM | Units | Dist |
|---|---|---|---|---|---|---|---|---|
| 425 Center St Tulare, CA | 1.0 | 1.0 | 650 | $1,095 | $1.68 | 13d | 1 | 0.67mi |
Listing history 6 events
-
2026-04-06status Pending
-
2026-03-20price $39,900
-
2026-02-19price $42,500
-
2025-12-12$45,000 Active
-
2016-07-11soldstatus $6,500 165-char remark
Show marketing remark (165 chars)
2 bed 1 bath mobile home located in the heart of the city. This unit is located in the peaceful 55+ Mountain View Mobile Home Estates and is ready for its new owner.
-
2016-06-24$6,552 165-char remark
Show marketing remark (165 chars)
2 bed 1 bath mobile home located in the heart of the city. This unit is located in the peaceful 55+ Mountain View Mobile Home Estates and is ready for its new owner.
ⓘ Source: listings_history table (triggers on properties + properties_extension) + one-shot
backfill from property_details.listing_events for pre-trigger history.
Tax reassessment forecast CA · Resets to sale price
- Current annual tax
- $89 · $7/mo
- Projected year-2 tax
- $303 · $25/mo
- Expected delta
- +$214/yr (+$18/mo · 241.2%)
ⓘ Screening estimate from a state-policy table — verify with the county assessor before closing.
Climate risk First Street
- Flood 1/10 Low FEMA zone X (unshaded) · 0% chance over 30 yrs
- Wildfire 5/10 Major
- Heat 7/10 Severe 7 d/yr ≥105°F today · 17 d/yr by 30 yrs out
- Wind 1/10 Low
- Air quality 10/10 Extreme 33 unhealthy d/yr today · 38 by 30 yrs out
Nearby sold comps map
Loading sold comps map…
Walkable amenities ~0.75 mi
Loading nearby amenities…
Taxation est. · year 1
- Rental income
- $17,836
- − Mortgage interest
- −$2,235
- − Property taxes
- −$89
- − Insurance
- −$200
- − Repairs & maintenance
- −$1,427
- − Management
- −$1,427
- − Depreciation
- −$1,161
- Taxable income
- $11,298
- Est. tax owed @ 24.0%
- −$2,711
- After-tax cash flow
- $8,579/yr
For passive investors: Depreciation is non-cash, so a rental often shows a tax loss while cash-flowing — sheltering income. Rental losses are passive: they offset passive income freely, and up to $25,000/yr can offset ordinary (W-2) income if you actively participate and your MAGI is under $100k (phasing out to $0 by $150k); unused losses carry forward. On sale, claimed depreciation is recaptured at up to 25%, and gains may owe capital-gains tax (a 1031 exchange can defer both). Figures are a year-1 estimate at your 24.0% rate — not tax advice; consult a CPA.
Schools (NCES district)
- District
- Tulare Joint Union High
- NCES district ID
- 0639930
- Math proficiency
- 18% ▼ -6.00%
- Reading proficiency
- 52% ▼ -1.00%
- Median HH income
- $46,858
- Composite
- 29.91/100
- National rank
- #6384
- State rank
- #280 of 517 in CA
Livability — Tulare
- Score
- 58/100
- State rank
- #701
- US rank
- #21185
Category grades
Schools grade is shown separately in the Schools card above.
Census & demographics
- Census place
- Tulare, CA
- County
- Tulare County · 323,826 people
- City population
- 80,026
- Metro
- Visalia, CA
- Population (ZIP)
- 80,026
- Household income
- $72,650
- Rent vs Own
- Severe rent burden
- 2393.0
Population outlook (Tulare County) Hauer SSP2
- Today (2025)
- 484,681 people
- By 2030
- 496,241 · +2.4%
- By 2040
- 518,507 · +7.0%
- By 2050
- 534,920 · +10.4%
- By 2075
- 548,417 · +13.2%
- By 2100
- 513,085 · +5.9%
Race, ethnicity, and origin ACS 2023
- Neighborhood character
- Majority Hispanic (64%)
- Race & ethnicity
- Hispanic / Latino 64% White 29% Two or more races 24% Asian 2% Black 2%
- Hispanic origin (detail)
- Mexican 60%
- Common ancestry
- Russian 7% Iranian 1% Italian 1%
- Foreign-born
- 19% · Canada, Vietnam
- Languages at home
- 52% English-only · Spanish 42% Other Indo-European 3% Other Asian/Pacific 1%
Political lean MEDSL · Tulare
- 2024 margin
- Strong R (+20.7) · D 38.5% · R 59.2% · Other 2.3%
- 2008→2024 swing
- -5.4pp toward R · 2008: -15.3pp · 2024: -20.7pp
- All cycles
- 2024: R+20.7 2020: R+7.8 2016: R+12.1 2012: R+17.8 2008: R+15.3
Not yet ingested
- Civics
- —
Market trends
- HPI YoY
- ▼ -402.03%
- Current HPI
- 316.0806
- Rent YoY
- ▲ 2.67%
- Metro
- Visalia, CA
- State GDP YoY
- ▲ 3.21%
- F500 in state
- 116
Industry mix (Fortune 500 HQ in CA)
| Industry | F500 HQs | Revenue |
|---|---|---|
| Technology | 27 | $1,492B |
|
||
| Financial Services | 3 | $174B |
|
||
| Retail | 3 | $44B |
|
||
| Insurance | 3 | $26B |
|
||
| Media / Entertainment | 2 | $115B |
|
||
| Pharmaceuticals / Biotech | 2 | $62B |
|
||
Price history
+509.0% since first listed6 events — show timeline
- 2026-04-06 Pending — TCMLS
- 2026-03-20 Price Changed $39,900 TCMLS
- 2026-02-19 Price Changed $42,500 TCMLS
- 2025-12-12 Listed $45,000 TCMLS
- 2016-07-11 Sold (MLS) $6,500 TCMLS
- 2016-06-24 Listed $6,552 TCMLS
Property tax history
-1.5%/yrLatest (2019): $89 · -3.3% YoY. Source: county tax records.
Cash-flow waterfall
monthlySold comps — $/sqft
last 12 mo · ≤1 miLoading sold comps…