300 S Luna Ct #2 · Hollywood, FL
Flood risk No data
- FEMA flood zone
- —
- Chance of flooding over 30 yrs
- —
- Est. flood insurance / yr
- —
Fire risk No data
- Est. fire insurance / yr
- —
Heat risk No data
- Hot days now (above threshold)
- —
- Hot days in 30 yrs
- —
Wind risk No data
- Chance of severe wind over 30 yrs
- —
Air-quality risk No data
- Unhealthy air days now
- —
- Unhealthy air days in 30 yrs
- —
Risk factors via First Street. Map © Google.
Why this score? — see what drove the D grade
The composite is a weighted blend of 9 inputs, each scored 0–100. Each bar is that input's sub-score; the figure is the points it added to the 100-point composite (weight × sub-score).
- Cash flow +12.2/30.0
- ARV discount +7.5/15.0
- 1% rule +4.8/10.0
- Schools +4.1/10.0
- Livability +3.8/5.0
- DSCR +3.6/10.0
- Rent growth +3.1/5.0
- Condition / age +2.5/5.0
- Appreciation +0.0/10.0
$235,000
🖨 Deal sheet 📄 Offer letter ✓ Due diligence
Listing remarks
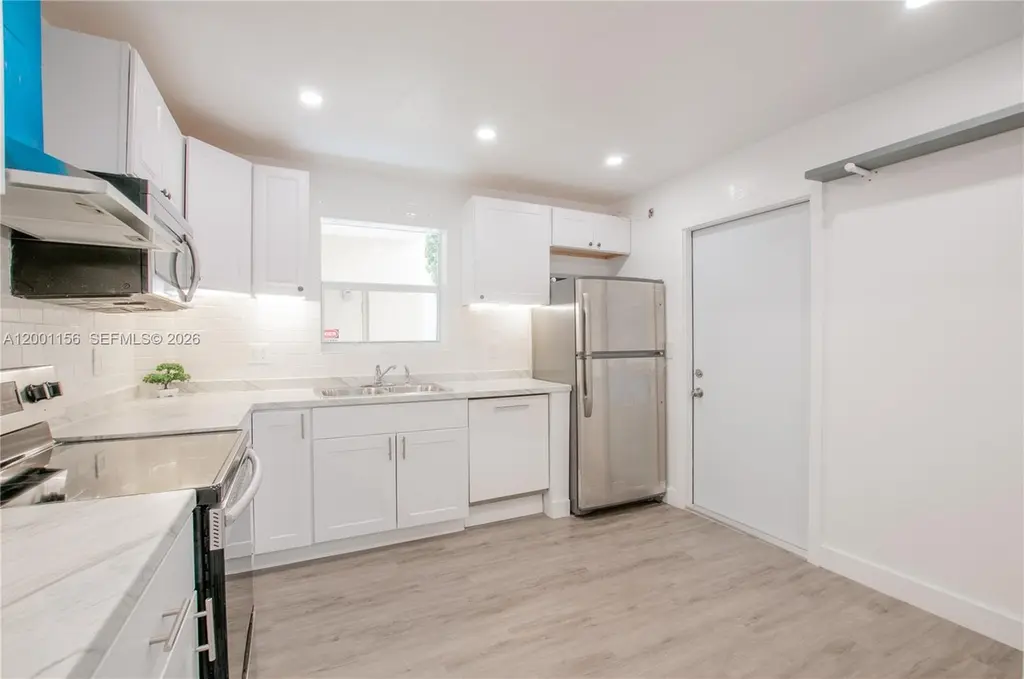
Fully Renovated First-Floor Condo in Hollywood – Move-In Ready! Welcome to this beautifully updated 2-bedroom, 2-bathroom condo in desirable Hollywood, FL. This move-in ready, fully renovated unit features modern finishes throughout, making it perfect for a primary residence, vacation home, or investment property. HIGH-IMPACT WINDOWS AND DOORS Enjoy the convenience of first-floor living with assigned parking directly in front of the unit—ideal for easy access and everyday comfort. The interior boasts stylish upgrades, including a modern kitchen, updated bathrooms, and a unique luxury feature: a heated-seat toilet for added comfort. This well-maintained community offer
Key facts
- Fully renovated
- Heated-seat toilet
- First-floor living
Tags
Property features AI
Finance
- Financial info: No pets allowed
- HOA & community: Monthly association fee of $300; HOA covers hot water, grounds maintenance, parking, sewer, trash and water; Association amenities: elevator(s), laundry, trash
Exterior
- Parking: One assigned parking space
- Security: Fire alarm; Security/high-impact doors; Storm/security shutters
- Utilities: Has cooling and heating; Electric service
- Home design: 3-story building; Property is attached; Entry on level 1; Effective year built
- Construction: Block construction
- Exterior features: Enclosed porch; Porch (screened); Security/high-impact doors; Storm/security shutters; Fire alarm
Interior
- Kitchen: Dishwasher; Microwave; Refrigerator; Garbage disposal; Electric water heater
- Bedrooms: Bedroom on main level
- Flooring: Laminate
- Bathrooms: 2 full bathrooms
- Heating & cooling: Central air; Ceiling fans; Electric heating
- Interior features: Bidet; Bedroom on main level; First-floor entry; Elevator; Other
- Laundry & utility: Common area laundry
Neighborhood map
What this means for you Summary
Snapshot
- This is a 2-bed/2.0-bath condo listed at $235k.
Deal economics
- At list price, monthly cash flow is $-49 ($-590/yr) — negative.
- To cash-flow at today's rent, offer at most $226k (3.7% below list).
- To meet the 1% rule (rent ≥ 1% of price), the offer needs to be $230k (2.0% below list).
- Recommended offer: $221k (6.0% below list) — sets the bar for market timing.
- Cap rate 6.0% vs local median 3.2% in Hollywood — top-decile yield for the area; either an underpriced asset or a hidden risk that comps aren't pricing in. Stress-test before assuming the spread holds.
Location & tenants
- Location reads 76/100 on livability (#232 in FL, #3,548 nationally) — a middle-class / working-renter tenant base. Strengths: commute A+, housing A+, crime B+; Watch: amenities D.
- Broward (suburban): math 42% / reading 53% proficiency, ranked #46 of 73 in FL (top 63%) — families likely to look elsewhere, expect single-tenant / working-renter base with shorter leases.
- Market conditions: Rents rising (+2.4%/yr); 529 active listings in the ZIP; 40 comparable units currently listed for rent nearby; rentals at typical pace (median 24d on market — plan ~3-4 weeks tenant-placement turnaround); 2,111 units permitted in Broward County in 2024 (1,265 in 5+ unit buildings).
- This rent runs 39% of the median local income ($71k/yr) — at the standard rent-burdened threshold; future hikes will face affordability resistance.
Forward outlook
- Local home prices are declining (-3.0%/yr); year-one equity from $2k of loan paydown is wiped out by about $7k of value loss. Plan a longer hold.
- Broward County population projected at +34% by 2050 — long-run rental-demand tailwind backs the buy-and-hold thesis.
Negotiation context
- It's been on market 65 days — a 6% lower offer ($221k) is reasonable based on typical stale-listing flexibility.
- Current owner paid $44k; list at $235k implies a 434% gain — meaningful room to come down on a strong offer.
Questions for the listing agent
- What do current leases actually rent for vs. the listed asking? Can we see a recent rent roll and the last 12 months of T-12 income?
- It's been on market 65 days. Have you received any prior offers? Is the seller open to a 6% concession, seller financing, or rate buy-down credit?
- Built in 1969 — when were the roof, HVAC, electrical panel, plumbing, and water heater last replaced?
- What does the HOA fee cover, when was the last increase, and are there any pending special assessments or reserve-fund shortfalls?
- Any open or pending special assessments — roof, HVAC, plumbing, elevator, façade? What's the per-unit balance and payoff schedule, and is the seller paying it off at close or rolling it to the buyer?
- Why hasn't it sold? Are there any deal-killer items the seller is aware of (foundation, flood, title, zoning, code violations)?
- Is there a deadline driving the sale (1031 exchange, divorce, estate, relocation)? That informs how much negotiation room exists.
- The area grade is low — what's the realistic commute time and amenity access for the typical tenant pool here? Any planned neighborhood developments (good or bad) we should know about?
- What's the average days-on-market for RENTAL listings here right now (not sales)? A rising rental-DOM trend means longer vacancies and softer asking-rent achievability than the comps imply.
- What's the recent tenant-quality profile in this submarket — average credit score on applications, eviction rate, late-payment / NSF rate, and stable-employment percentage? A property-management company in the area should have these aggregated.
- How much new apartment / multifamily construction is in the pipeline within 1–3 miles? Heavy new supply (>2% of stock underway) typically softens rents 12–24 months out; light construction supports rent growth.
Investment metrics
- 1% rule
- 0.98% ✗
- Cap rate
- 6.04%
- Cash-on-cash
- -0.90%
- DSCR
- 0.96
- GRM
- 8.5
CMA / ARV
No comps found within radius.
Projected returns pro-forma
-3.0% appreciation · 2.41% rent growth · sell at horizon
- IRR
- -18.4%
- Equity multiple
- 0.36×
- Total profit
- $-42,384
- Equity at exit
- $35,039
- IRR
- -12.0%
- Equity multiple
- 0.31×
- Total profit
- $-45,696
- Equity at exit
- $20,319
Cash invested: $65,800 (down + closing). Projections, not guarantees.
Landlord ↔ Tenant lean methodology
- Overall (STATE)
- 87 Strongly Landlord-Friendly
- State Florida
- 87 Strongly Landlord-Friendly · R+3
- County
- — inherits STATE
- City
- — inherits STATE
ZIP-level market 33021
- Rents YoY
- 2.4%
- Active inventory
- 529
- Price-to-rent
- 8.5×
Monthly cashflow live
- Estimated rent
- $2,303 high interval (Pro) →
- Mortgage (P&I)
- −$1,232
- Tax from tax record
- −$238 /mo · $2,854/yr
- Insurance
- −$98
- HOA
- −$300
- Vacancy / Maint / Mgmt
- −$484
- Net cashflow
- $-49
Break-even live
UW: 25.0% down · 7.5% · 30yr · 1.5% tax · 5.0% vac · 8.0% maint · 8.0% mgmt
Financing live
Cash to close
- Down payment
- $58,750
- Closing costs
- $7,050
- Reserves months
- —
- Total cash needed
- —
Loan-product check · same deal, 3 products live
Conventional
25% down · 7.5% · 30yr
- Down + closing
- —
- Monthly P&I
- —
- Monthly cashflow
- —
- DSCR
- —
- Eligible?
- —
Personal DTI + credit; lowest rate.
DSCR
20% down · 8.5% · 30yr
- Down + closing
- —
- Monthly P&I
- —
- Monthly cashflow
- —
- DSCR
- —
- Eligible?
- —
No personal income docs; deal must DSCR.
Hard money
10% down · 12.0% · 12mo
- Down + closing
- —
- Monthly P&I
- —
- Monthly cashflow
- —
- DSCR
- —
- Eligible?
- —
Short-term bridge; refi at stabilization.
Rent comps 40 comps
| Address | Beds | Baths | Sqft | Rent | $/sqft | DOM | Units | Dist |
|---|---|---|---|---|---|---|---|---|
| 400 S Luna Ct #2 Hollywood, FL | 2.0 | 1.0 | 960 | $2,300 | $2.40 | 24d | 1 | 0.05mi |
| 3624 Jackson St Unit 21 Hollywood, FL | 2.0 | 2.0 | 1100 | $1,900 | $1.73 | 2d | 1 | 0.11mi |
| 3601 Van Buren St Hollywood, FL | 1.0–2.0 | 1.0–2.0 | 941 | $2,195 | $2.33 | 3d | 3 | 0.14mi |
| 3600 Van Buren St Hollywood, FL | 1.0–2.0 | 1.0–2.0 | 1055 | $2,350 | $2.23 | 2d | 4 | 0.15mi |
| 3501 Jackson St #309 Hollywood, FL | 2.0 | 2.0 | 1170 | $2,500 | $2.14 | 24d | 1 | 0.19mi |
| 3500 Jackson St Unit 203 Hollywood, FL | 2.0 | 2.0 | 875 | $1,995 | $2.28 | 24d | 1 | 0.20mi |
| 555 S Luna Ct Hollywood, FL | 2.0 | 2.0 | 1036 | $2,120 | $2.05 | 4d | 2 | 0.22mi |
| 570 S Park Rd Unit 13-6 Hollywood, FL | 2.0 | 2.0 | 1060 | $2,400 | $2.26 | 24d | 1 | 0.25mi |
| 3709 Tyler St Hollywood, FL | 3.0 | 2.0 | 1300 | $3,129 | $2.41 | 1d | 1 | 0.27mi |
| 3711 Tyler St Unit 3709 Hollywood, FL | 3.0 | 2.0 | 1300 | $3,150 | $2.42 | 24d | 1 | 0.27mi |
| 450 S Park Rd Unit 5-307 Hollywood, FL | 3.0 | 2.0 | 1084 | $2,800 | $2.58 | 24d | 1 | 0.28mi |
| 470 S Park Rd Unit 7-203 Hollywood, FL | 2.0 | 2.0 | 820 | $2,050 | $2.50 | 24d | 1 | 0.28mi |
| 470 S Park Rd Unit 7-307 Hollywood, FL | 3.0 | 2.0 | 1084 | $3,250 | $3.00 | 24d | 1 | 0.28mi |
| 460 S Park Rd Unit 6-203 Hollywood, FL | 2.0 | 2.0 | 820 | $2,400 | $2.93 | 5d | 1 | 0.32mi |
| 460 S Park Rd Apt 109 Hollywood, FL | 2.0 | 2.0 | 867 | $2,100 | $2.42 | 19d | 1 | 0.32mi |
| 460 S Park Rd Unit 6-304 Hollywood, FL | 2.0 | 1.0 | 918 | $1,950 | $2.12 | 5d | 1 | 0.32mi |
| 530 S Park Rd Hollywood, FL | 2.0 | 2.0 | 1060 | $2,375 | $2.24 | 18d | 1 | 0.33mi |
| 640 S Park Rd Unit 12-4 Hollywood, FL | 3.0 | 2.0 | 1236 | $2,950 | $2.39 | 24d | 1 | 0.33mi |
| 640 S Park Rd Unit 14-4 Hollywood, FL | 2.0 | 2.0 | 1060 | $2,300 | $2.17 | 24d | 1 | 0.33mi |
| 530 S Park Rd Hollywood, FL | 1.0 | 1.0 | 841 | $1,800 | $2.14 | 24d | 1 | 0.33mi |
| 640 S Park Rd Unit 14-4 Hollywood, FL | 2.0 | 2.0 | 1060 | $2,200 | $2.08 | 16d | 1 | 0.33mi |
| 640 S Park Rd Unit 34-4 Hollywood, FL | 2.0 | 2.0 | 1060 | $2,250 | $2.12 | 24d | 1 | 0.33mi |
| 3525 Polk St #7 Hollywood, FL | 1.0 | 1.0 | 700 | $1,600 | $2.29 | 24d | 1 | 0.35mi |
| 3612-3614 Taylor St Unit 3614 Hollywood, FL | 3.0 | 2.0 | 1275 | $3,200 | $2.51 | 20d | 1 | 0.36mi |
| 3614 Taylor St Hollywood, FL | 3.0 | 2.0 | 1301 | $3,199 | $2.46 | 1d | 1 | 0.37mi |
| 3610 Taylor St Unit 3 Hollywood, FL | 2.0 | 2.0 | 950 | $2,290 | $2.41 | 24d | 1 | 0.37mi |
| 410 S Park Rd Unit 1-204 Hollywood, FL | 2.0 | 1.0 | 838 | $2,100 | $2.51 | 11d | 1 | 0.37mi |
| 530 S Park Rd Unit 12-11 Hollywood, FL | 2.0 | 2.0 | 1060 | $2,375 | $2.24 | 15d | 1 | 0.39mi |
| 530 S Park Rd Unit 17-11 Hollywood, FL | 2.0 | 2.0 | 1060 | $2,300 | $2.17 | 22d | 1 | 0.39mi |
| 812 S Park Rd Hollywood, FL | 1.0–3.0 | 1.0–2.0 | 999 | $2,424 | $2.43 | 1d | 24 | 0.40mi |
| 620 S Park Rd Unit 31-2 Hollywood, FL | 1.0 | 1.0 | 841 | $1,800 | $2.14 | 24d | 1 | 0.40mi |
| 610 S Park Rd Unit 26-1 Hollywood, FL | 1.0 | 1.0 | 841 | $1,950 | $2.32 | 4d | 1 | 0.40mi |
| 610 S Park Rd Unit 26-1 Hollywood, FL | 1.0 | 1.0 | 841 | $2,100 | $2.50 | 24d | 1 | 0.40mi |
| 919 Hillcrest Dr #511 Hollywood, FL | 1.0 | 1.5 | 830 | $1,700 | $2.05 | 24d | 1 | 0.57mi |
| 919 Hillcrest Dr #303 Hollywood, FL | 2.0 | 2.0 | 1100 | $2,000 | $1.82 | 24d | 1 | 0.57mi |
| 901 Hillcrest Dr #208 Hollywood, FL | 1.0 | 1.5 | 830 | $1,700 | $2.05 | 24d | 1 | 0.57mi |
| 901 Hillcrest Dr #307 Hollywood, FL | 1.0 | 1.5 | 830 | $1,750 | $2.11 | 24d | 1 | 0.57mi |
| 1200 Tallwood Ave #302 Hollywood, FL | 2.0 | 2.0 | 840 | $2,250 | $2.68 | 24d | 1 | 0.57mi |
| 1200 Tallwood Ave #302 Hollywood, FL | 2.0 | 2.0 | 840 | $2,225 | $2.65 | 3d | 1 | 0.57mi |
| 911 S Park Rd Hollywood, FL | 1.0–3.0 | 1.0–2.0 | 1123 | $2,619 | $2.33 | 1d | 24 | 0.61mi |
HOA detail condo
- Monthly dues
- $300 · $3,600/yr
- Likely covers
- parking
- Assessments
- None detected in remarks — confirm with the listing agent.
Listing history 19 events
-
2026-06-18days on market $235,000 Active 65 DOM
-
2026-06-17days on market $235,000 Active 64 DOM
-
2026-06-16days on market $235,000 Active 63 DOM
-
2026-06-15days on market $235,000 Active 62 DOM
-
2026-06-13days on market $235,000 Active 60 DOM
-
2026-06-09days on market $235,000 Active 56 DOM
-
2026-06-08days on market $235,000 Active 55 DOM
-
2026-06-07days on market $235,000 Active 54 DOM
-
2026-06-04days on market $235,000 Active 51 DOM
-
2026-06-03days on market $235,000 Active 50 DOM
-
2026-06-02days on market $235,000 Active 49 DOM
-
2026-06-01days on market $235,000 Active 48 DOM
-
2026-05-31days on market $235,000 Active 47 DOM
-
2026-05-22price $235,000
-
2026-05-04price $240,000
-
2026-04-14price $245,000
-
2026-04-14$247,000 Active
-
2009-09-17soldstatus $44,000
-
1969-05-01soldstatus $19,000
ⓘ Source: listings_history table (triggers on properties + properties_extension) + one-shot
backfill from property_details.listing_events for pre-trigger history.
Tax reassessment forecast FL · Resets to sale price
- Current annual tax
- $2,854 · $238/mo
- Projected year-2 tax
- $2,854 · $238/mo
- Expected delta
- $0/yr ($0/mo · 0.0%)
ⓘ Screening estimate from a state-policy table — verify with the county assessor before closing.
Nearby sold comps map
Loading sold comps map…
Walkable amenities ~0.75 mi
Loading nearby amenities…
Taxation est. · year 1
- Rental income
- $27,630
- − Mortgage interest
- −$13,164
- − Property taxes
- −$2,854
- − Insurance
- −$1,175
- − Repairs & maintenance
- −$2,210
- − Management
- −$2,210
- − HOA
- −$3,600
- − Depreciation
- −$6,836
- Taxable loss
- −$4,420
- Est. tax savings @ 24.0%
- +$1,061
- After-tax cash flow
- $471/yr
For passive investors: Depreciation is non-cash, so a rental often shows a tax loss while cash-flowing — sheltering income. Rental losses are passive: they offset passive income freely, and up to $25,000/yr can offset ordinary (W-2) income if you actively participate and your MAGI is under $100k (phasing out to $0 by $150k); unused losses carry forward. On sale, claimed depreciation is recaptured at up to 25%, and gains may owe capital-gains tax (a 1031 exchange can defer both). Figures are a year-1 estimate at your 24.0% rate — not tax advice; consult a CPA.
Schools (NCES district)
- District
- Broward
- NCES district ID
- 1200180
- Math proficiency
- 42% ▼ -18.00%
- Reading proficiency
- 53% ▼ -5.00%
- Median HH income
- $52,139
- Composite
- 40.88/100
- National rank
- #3621
- State rank
- #46 of 73 in FL
Livability — Hollywood
- Score
- 76/100
- State rank
- #232
- US rank
- #3548
Category grades
Schools grade is shown separately in the Schools card above.
Census & demographics
- Census place
- Hollywood, FL
- County
- Broward County · 1,963,430 people
- City population
- 109,079
- Metro
- Miami-Fort Lauderdale-Pompano Beach, FL
- Population (ZIP)
- 48,464
- Household income
- $71,318
- Rent vs Own
- Severe rent burden
- 2151.0
Population outlook (Broward County) Hauer SSP2
- Today (2025)
- 2,207,033 people
- By 2030
- 2,360,704 · +7.0%
- By 2040
- 2,661,208 · +20.6%
- By 2050
- 2,946,698 · +33.5%
- By 2075
- 3,602,273 · +63.2%
- By 2100
- 3,970,984 · +79.9%
Race, ethnicity, and origin ACS 2023
- Neighborhood character
- Diverse neighborhood (Simpson 0.65)
- Race & ethnicity
- White 45% Hispanic / Latino 37% Two or more races 17% Black 13% Asian 3%
- Hispanic origin (detail)
- Puerto Rican 5% Cuban 10% Dominican 2%
- Common ancestry
- Romanian 3% Scotch-Irish 2% Hispanic 2%
- Foreign-born
- 35% · Canada, Jamaica, Dominican Republic
- Languages at home
- 53% English-only · Spanish 33% French/Haitian/Cajun 4% Russian/Polish/Slavic 2%
Political lean MEDSL · Broward
- 2024 margin
- D (+17.0) · D 58.0% · R 41.0%
- 2008→2024 swing
- -17.8pp toward R · 2008: 34.7pp · 2024: 17.0pp
- All cycles
- 2024: D+17.0 2020: D+29.8 2016: D+35.0 2012: D+34.9 2008: D+34.7
Not yet ingested
- Civics
- —
Market trends
- HPI YoY
- ▼ -404.28%
- Current HPI
- 429.7129
- Rent YoY
- ▲ 2.41%
- Metro
- Miami-Fort Lauderdale-Pompano Beach, FL
- State GDP YoY
- ▲ 3.28%
- F500 in state
- 36
Industry mix (Fortune 500 HQ in FL)
| Industry | F500 HQs | Revenue |
|---|---|---|
| Industrial Technology | 2 | $29B |
|
||
| Insurance | 2 | $17B |
|
||
| Retail | 1 | $60B |
|
||
| Technology Distribution | 1 | $58B |
|
||
| Homebuilding | 1 | $35B |
|
||
| Technology Manufacturing | 1 | $35B |
|
||
Price history
+1136.8% since first listed6 events — show timeline
- 2026-05-22 Price Changed $235,000 MARMLS
- 2026-05-04 Price Changed $240,000 MARMLS
- 2026-04-14 Price Changed $245,000 MARMLS
- 2026-04-14 Listed $247,000 MARMLS
- 2009-09-17 Sold (Public Records) $44,000 Public Records
- 1969-05-01 Sold (Public Records) $19,000 Public Records
Property tax history
+9.7%/yrLatest (2025): $2,854 · +3.9% YoY. Source: county tax records.
Cash-flow waterfall
monthlySold comps — $/sqft
last 12 mo · ≤1 miLoading sold comps…