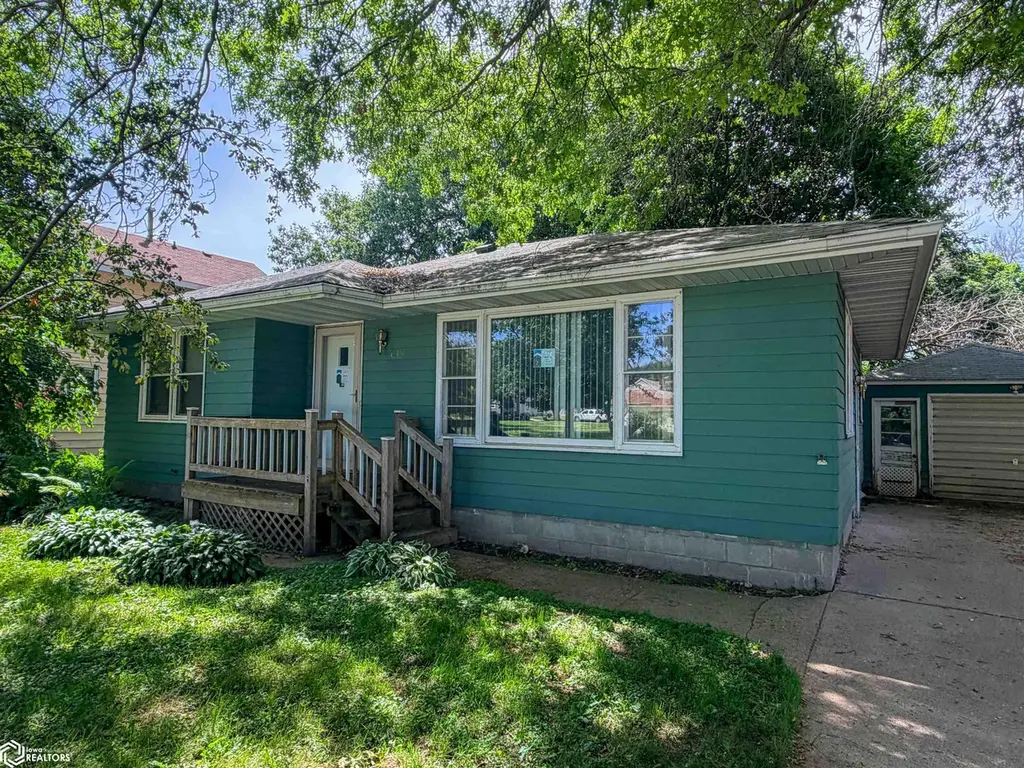
612 1st St SE · Belmond, IA
Flood risk 1/10 · Minimal
- FEMA flood zone
- X (unshaded)
- Chance of flooding over 30 yrs
- 0.0%
- Est. flood insurance / yr
- $473 – $860
Fire risk 3/10 · Minor
- Est. fire insurance / yr
- $902 – $1,676
Heat risk 2/10 · Minimal
- Hot days now (above 100°F)
- 7 days/yr
- Hot days in 30 yrs
- 16 days/yr
Wind risk 2/10 · Minimal
- Chance of severe wind over 30 yrs
- —
Air-quality risk 1/10 · Minimal
- Unhealthy air days now
- 0 days/yr
- Unhealthy air days in 30 yrs
- 0 days/yr
Risk factors via First Street. Map © Google.
Why this score? — see what drove the B- grade
The composite is a weighted blend of 9 inputs, each scored 0–100. Each bar is that input's sub-score; the figure is the points it added to the 100-point composite (weight × sub-score).
- Cash flow +25.2/30.0
- ARV discount +15.0/15.0
- DSCR +8.3/10.0
- 1% rule +6.7/10.0
- Schools +5.4/10.0
- Livability +4.0/5.0
- Rent growth +2.5/5.0
- Condition / age +2.5/5.0
- Appreciation +0.0/10.0
$90,000
🖨 Deal sheet 📄 Offer letter ✓ Due diligence
Listing remarks
2 bedroom, 1.5 bath 1 story home in Belmond. This home features a 1 car detached garage, full, partially finished basement, and family room addition with fireplace. This property is eligible under the First Look Initiative. All owner Occupant offers will be responded to after 7 days on the market and Investor offers will be responded to after 30 days. However, all offers can be submitted during the First Look period. All offers must be entered through propoffers.com. An offer management fee of $200 (plus sales tax, where applicable) is charged by Pyramid Platform in connection with the use of Propoffers. This fee will be paid at closing from the agent representing the buyer as selling agent
Key facts
- 9,940 sq ft lot
- Garage
- Built 1967
Property features AI
Exterior
- Parking: Detached 1-car garage
- Utilities: Public water; Public sewer
- Home design: Single-family residence; Residential property
- Construction: Metal siding; Foundation area listed (975)
- Exterior features: Lot dimensions approximately 71 x 140
Interior
- Bathrooms: 1 full bathroom; 1 half bathroom
- Heating & cooling: Central air conditioning; Forced-air heating
- Interior features: Fireplace (1); Basement
Neighborhood map
What this means for you Summary
Snapshot
- This is a 2-bed/1.5-bath single-family listed at $90k.
Deal economics
- At list price, monthly cash flow is $203 ($2k/yr) — positive.
- The deal already cash-flows at list — no discount required.
- Meets the 1% rule at list price ($1k rent vs $90k).
Location & tenants
- Location reads 79/100 on livability (#96 in IA, #1,995 nationally) — a middle-class / working-renter tenant base. Strengths: crime A+, cost of living A+, housing A+; Watch: amenities F, commute F.
- Belmond-Klemme Community School District (rural): math 60% / reading 67% proficiency, ranked #212 of 289 in IA (top 73%) — acceptable for families but not a draw, mixed tenant base, ~2y average lease.
- Market conditions: 20 active listings in the ZIP; 23 units permitted in Wright County in 2024 (10 in 5+ unit buildings).
Forward outlook
- Local home prices are declining (-3.0%/yr); year-one equity from $622 of loan paydown is wiped out by about $3k of value loss. Plan a longer hold.
- Wright County population projected at -15% by 2050 — secular population decline; favor cash flow + early exit over multi-decade hold.
Negotiation context
- Only 11 days on market — expect competitive offers; lowballing is unlikely to land.
Questions for the listing agent
- Built in 1967 — when were the roof, HVAC, electrical panel, plumbing, and water heater last replaced?
- Is there a deadline driving the sale (1031 exchange, divorce, estate, relocation)? That informs how much negotiation room exists.
- Schools are B-rated — typically a magnet for longer-tenancy family renters. What's the average tenant stay here, and is there a school-zone premium baked into asking?
- What's the average days-on-market for RENTAL listings here right now (not sales)? A rising rental-DOM trend means longer vacancies and softer asking-rent achievability than the comps imply.
- What's the recent tenant-quality profile in this submarket — average credit score on applications, eviction rate, late-payment / NSF rate, and stable-employment percentage? A property-management company in the area should have these aggregated.
- How much new for-sale + rental construction is in the pipeline within 1–3 miles? Heavy new supply typically softens prices + rents 12–24 months out; constrained supply supports both.
Investment metrics
- 1% rule
- 1.17% ✓
- Cap rate
- 9.00%
- Cash-on-cash
- 9.65%
- DSCR
- 1.43
- GRM
- 7.1
CMA / ARV
- ARV (on-the-fly)
- $156,040
- Comps found
- 8
Show comp detail 8 sales within ~0.75 mi
| Address | Dist | Beds/Ba | Sqft | Sold | Price | $/sf | Match |
|---|---|---|---|---|---|---|---|
| 208 5th Avenue Ave NE | 0.17mi | 2/1.5 | 1,716 (-9%) | 4mo | $132,000 | $77 | 74 |
| 615 E Main St | 0.10mi | 3/1.0 (+1) | 2,150 (+14%) | 8mo | $31,000 | $14 | 58 |
| 503 3rd Ave Ave NE | 0.40mi | 2/1.5 | 1,749 (-7%) | 17mo | $72,500 | $41 | 55 |
| 1007 5th Ave NE | 0.68mi | 3/2.0 (+1) | 1,876 (-0%) | 10mo | $185,000 | $99 | 53 |
| 208 3rd St NE | 0.38mi | 3/1.5 (+1) | 1,726 (-8%) | 15mo | $143,000 | $83 | 51 |
| 816 9th Ave NE | 0.64mi | 3/1.5 (+1) | 2,035 (+8%) | 6mo | $159,650 | $78 | 46 |
| 811 8th Ave NE | 0.59mi | 3/2.0 (+1) | 1,620 (-14%) | 1mo | $153,250 | $95 | 42 |
| 308 Fairway Dr | 0.64mi | 3/2.5 (+1) | 1,671 (-11%) | 2mo | $315,000 | $189 | 41 |
Match score weights: distance 35% · size 25% · config 20% · recency 20%. Top-matched comps best support the ARV.
Projected returns pro-forma
-3.0% appreciation · 3.0% rent growth · sell at horizon
- IRR
- -1.7%
- Equity multiple
- 0.93×
- Total profit
- $-1,652
- Equity at exit
- $13,419
- IRR
- 8.0%
- Equity multiple
- 1.61×
- Total profit
- $15,271
- Equity at exit
- $7,782
Cash invested: $25,200 (down + closing). Projections, not guarantees.
Landlord ↔ Tenant lean methodology
- Overall (STATE)
- 83 Strongly Landlord-Friendly
- State Iowa
- 83 Strongly Landlord-Friendly · R+6
- County
- — inherits STATE
- City
- — inherits STATE
ZIP-level market 50421
- Home prices YoY
- -27.0%
- Active inventory
- 20
- Price-to-rent
- 7.1×
Monthly cashflow live
- Estimated rent
- $1,054 medium interval (Pro) →
- Mortgage (P&I)
- −$472
- Tax from tax record
- −$121 /mo · $1,448/yr
- Insurance
- −$38
- HOA
- −$0
- Vacancy / Maint / Mgmt
- −$221
- Net cashflow
- $203
Break-even live
UW: 25.0% down · 7.5% · 30yr · 1.5% tax · 5.0% vac · 8.0% maint · 8.0% mgmt
Financing live
Cash to close
- Down payment
- $22,500
- Closing costs
- $2,700
- Reserves months
- —
- Total cash needed
- —
Loan-product check · same deal, 3 products live
Conventional
25% down · 7.5% · 30yr
- Down + closing
- —
- Monthly P&I
- —
- Monthly cashflow
- —
- DSCR
- —
- Eligible?
- —
Personal DTI + credit; lowest rate.
DSCR
20% down · 8.5% · 30yr
- Down + closing
- —
- Monthly P&I
- —
- Monthly cashflow
- —
- DSCR
- —
- Eligible?
- —
No personal income docs; deal must DSCR.
Hard money
10% down · 12.0% · 12mo
- Down + closing
- —
- Monthly P&I
- —
- Monthly cashflow
- —
- DSCR
- —
- Eligible?
- —
Short-term bridge; refi at stabilization.
Listing history 9 events
-
2026-06-18days on market $90,000 Active 11 DOM
-
2026-06-17days on market $90,000 Active 10 DOM
-
2026-06-16days on market $90,000 Active 9 DOM
-
2026-06-15days on market $90,000 Active 8 DOM
-
2026-06-13days on market $90,000 Active 6 DOM
-
2026-06-12days on market $90,000 Active 5 DOM
-
2026-06-09days on market $90,000 Active 2 DOM
-
2026-06-07remarks 699-char remark
-
2026-06-07$90,000 Active 1 DOM
ⓘ Source: listings_history table (triggers on properties + properties_extension) + one-shot
backfill from property_details.listing_events for pre-trigger history.
Tax reassessment forecast IA · Partial reset (capped growth)
- Current annual tax
- $1,448 · $121/mo
- Projected year-2 tax
- $1,448 · $121/mo
- Expected delta
- $0/yr ($0/mo · 0.0%)
ⓘ Screening estimate from a state-policy table — verify with the county assessor before closing.
Climate risk First Street
- Flood 1/10 Low FEMA zone X (unshaded) · 0% chance over 30 yrs
- Wildfire 3/10 Moderate
- Heat 2/10 Low 7 d/yr ≥100°F today · 16 d/yr by 30 yrs out
- Wind 2/10 Low
- Air quality 1/10 Low 0 unhealthy d/yr today · 0 by 30 yrs out
Nearby sold comps map
Loading sold comps map…
Walkable amenities ~0.75 mi
Loading nearby amenities…
Taxation est. · year 1
- Rental income
- $12,651
- − Mortgage interest
- −$5,041
- − Property taxes
- −$1,448
- − Insurance
- −$450
- − Repairs & maintenance
- −$1,012
- − Management
- −$1,012
- − Depreciation
- −$2,618
- Taxable income
- $1,069
- Est. tax owed @ 24.0%
- −$257
- After-tax cash flow
- $2,176/yr
For passive investors: Depreciation is non-cash, so a rental often shows a tax loss while cash-flowing — sheltering income. Rental losses are passive: they offset passive income freely, and up to $25,000/yr can offset ordinary (W-2) income if you actively participate and your MAGI is under $100k (phasing out to $0 by $150k); unused losses carry forward. On sale, claimed depreciation is recaptured at up to 25%, and gains may owe capital-gains tax (a 1031 exchange can defer both). Figures are a year-1 estimate at your 24.0% rate — not tax advice; consult a CPA.
Schools (NCES district)
- District
- Belmond-Klemme Community School District
- NCES district ID
- 1904680
- Math proficiency
- 60% ▼ -2.00%
- Reading proficiency
- 67% ▲ 7.00%
- Median HH income
- $46,566
- Composite
- 53.63/100
- National rank
- #1435
- State rank
- #212 of 289 in IA
Livability — Belmond
- Score
- 79/100
- State rank
- #96
- US rank
- #1995
Category grades
Schools grade is shown separately in the Schools card above.
Census & demographics
- Census place
- Belmond, IA
- City population
- 3,142
- Population (ZIP)
- 3,142
Population outlook (Wright County) Hauer SSP2
- Today (2025)
- 12,154 people
- By 2030
- 11,770 · -3.2%
- By 2040
- 10,981 · -9.7%
- By 2050
- 10,313 · -15.1%
- By 2075
- 9,217 · -24.2%
- By 2100
- 8,084 · -33.5%
Race, ethnicity, and origin ACS 2023
- Neighborhood character
- Predominantly White (84%)
- Race & ethnicity
- White 84% Hispanic / Latino 14% Two or more races 12%
- Hispanic origin (detail)
- Mexican 12%
- Common ancestry
- Portuguese 14% Iranian 2% Slovak 1%
- Foreign-born
- 6% · Canada
- Languages at home
- 91% English-only · Spanish 8%
Political lean MEDSL · Wright
- 2024 margin
- Solid R (+36.5) · D 31.0% · R 67.5% · Other 1.4%
- 2008→2024 swing
- -35.0pp toward R · 2008: -1.5pp · 2024: -36.5pp
- All cycles
- 2024: R+36.5 2020: R+34.2 2016: R+31.9 2012: R+8.3 2008: R+1.5
Not yet ingested
- Civics
- —
Market trends
- HPI YoY
- ▼ -40.41%
- Current HPI
- 109.3779
- Rent YoY
- —
- Metro
- —
- State GDP YoY
- ▲ 2.48%
- F500 in state
- 4
Industry mix (Fortune 500 HQ in IA)
| Industry | F500 HQs | Revenue |
|---|---|---|
| Financial Services | 1 | $16B |
|
||
| Retail / Convenience | 1 | $15B |
|
||
Price history
1 event — show timeline
- 2026-06-03 Listed $90,000 IAR
Property tax history
+1.1%/yrLatest (2025): $1,448 · +7.3% YoY. Source: county tax records.
Cash-flow waterfall
monthlySold comps — $/sqft
last 12 mo · ≤1 miLoading sold comps…