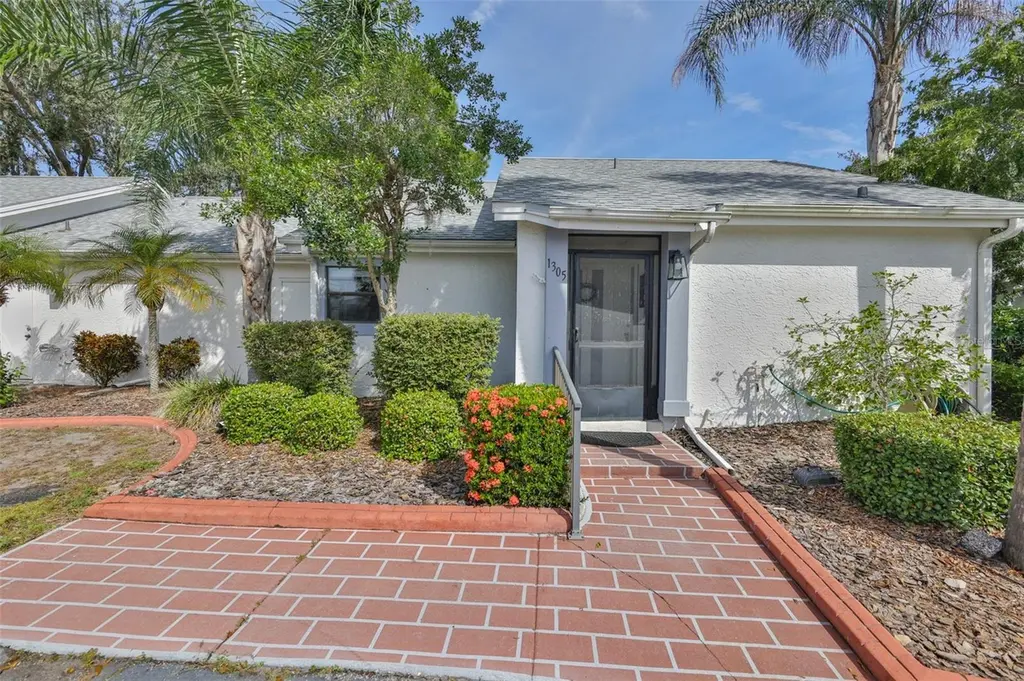
1305 Spry Ct · Sun City Center, FL
Flood risk 1/10 · Minimal
- FEMA flood zone
- X (unshaded)
- Chance of flooding over 30 yrs
- 0.0%
- Est. flood insurance / yr
- $507 – $1,088
Fire risk 4/10 · Minor
- Est. fire insurance / yr
- $947 – $1,759
Heat risk 10/10 · Severe
- Hot days now (above 109°F)
- 7 days/yr
- Hot days in 30 yrs
- 27 days/yr
Wind risk 10/10 · Severe
- Chance of severe wind over 30 yrs
- 99.0%
Air-quality risk 3/10 · Minor
- Unhealthy air days now
- 3 days/yr
- Unhealthy air days in 30 yrs
- 3 days/yr
Risk factors via First Street. Map © Google.
Why this score? — see what drove the D grade
The composite is a weighted blend of 9 inputs, each scored 0–100. Each bar is that input's sub-score; the figure is the points it added to the 100-point composite (weight × sub-score).
- Cash flow +9.1/30.0
- ARV discount +7.5/15.0
- 1% rule +6.8/10.0
- Schools +4.2/10.0
- Livability +3.9/5.0
- Appreciation +3.4/10.0
- Rent growth +3.2/5.0
- DSCR +2.5/10.0
- Condition / age +2.5/5.0
$149,900
🖨 Deal sheet (PDF) 📄 Offer letter ✓ Due diligence
Listing remarks
Virtually Staged. MOVE-IN READY with NEW ROOF 2024! Rare dual-suite condo in the highly desirable Golf Villas of Sun City Center. This unique split-plan layout offers exceptional flexibility with two private entrances, two true primary suites with ensuite baths, separate utility controls, two furnaces (2017), two hot water tanks (2021), and separate utility meters—an ideal setup for guests, rental income potential, or multi-generational living. With each suite functioning as its own private space, the property offers added comfort, privacy, and efficiency, allowing you to heat or cool only the areas in use while providing independence for family or visitors. Golf Villas HOA is $1,500/
Key facts
- In-unit laundry
- Dual-suite condo
- Separate entrances
Tags
Property features AI
Finance
- Other: Lease restrictions apply
- Financial info: Total monthly fees reported $428.67; total annual fees reported $5,144; Association fee includes cable TV, common area taxes, escrow reserves, structure and grounds maintenance, and trash
- HOA & community: HOA required; monthly HOA $400 (quarterly association fee $1,200); Association amenities include pool, fitness center, tennis and pickleball courts, basketball court, shuffleboard, trails, park, recreation facilities, dog park, community mailbox, sidewalks and golf; Buyer approval required; Golf carts allowed; Handicap modified / wheelchair access; Senior community; Pets not allowed
Exterior
- Parking: Golf cart parking; Guest parking; Open parking
- Security: Fire alarm; Smoke detectors
- Utilities: Public water; Public sewer; Cable connected; BB/HS internet available; Electricity connected; Sewer connected; Water connected; Fire hydrant nearby
- Home design: Residential condominium; Single-story; Faces southwest
- Construction: Block and stucco construction; Shingle roof; Slab foundation; Built as condominium (unit on floor 1)
- Exterior features: Enclosed patio; Front porch; Patio; Screened porch; Exterior lighting; Private mailbox; Rain gutters; Sliding doors; Storage; On-site tennis courts; Irrigation equipment; Trees and landscaped grounds; Cul-de-sac lot; Near golf course; Paved driveway/road
Interior
- Kitchen: Disposal; Microwave; Range; Refrigerator; Electric water heater
- Bedrooms: 2 bedrooms
- Flooring: Carpet; Ceramic tile
- Bathrooms: 2 full bathrooms
- Heating & cooling: Central heating; Central air
- Interior features: Ceiling fans; Eat-in kitchen; Living room/dining room combo; Open floor plan; Split bedroom layout; Thermostat; Vaulted ceilings; Walk-in closets; Window treatments
- Laundry & utility: Washer and dryer hookups; Electric dryer hookup; Washer hookup; Inside laundry closet
Neighborhood map
What this means for you Summary
Snapshot
- This is a 2-bed/2.0-bath condo listed at $150k.
Deal economics
- At list price, monthly cash flow is $-114 ($-1k/yr) — negative.
- To cash-flow at today's rent, offer at most $130k (13.5% below list).
- Meets the 1% rule at list price ($2k rent vs $150k).
- Recommended offer: $130k (13.5% below list) — sets the bar for cash-flow.
Location & tenants
- Location reads 78/100 on livability (#178 in FL, #2,736 nationally) — a middle-class / working-renter tenant base. Strengths: housing A+, health & safety A+, crime B+; Watch: amenities F.
- Hillsborough (suburban): math 47% / reading 50% proficiency, ranked #41 of 73 in FL (top 56%) — families likely to look elsewhere, expect single-tenant / working-renter base with shorter leases.
- Zoned schools: Cypress Creek Elementary School (math 40% / reading 40%, grade F, #1,491 of 2,144 statewide, top 70%, 957 students, 63% FRL); Shields Middle School (math 29% / reading 27%, grade F, #486 of 571 statewide, top 86%, 1,867 students, 68% FRL); Lennard High School (math 30% / reading 46%, grade F, #328 of 667 statewide, top 50%, 2,404 students, 47% FRL).
- Zoned-school proficiency averages 35% at this address vs 48% district-wide (-13 pts) — the specific schools serving this property underperform the Hillsborough average; the district grade overstates school quality for this exact location.
- Market conditions: Rents rising (+2.6%/yr); 605 active listings in the ZIP; 38 comparable units currently listed for rent nearby; rentals at typical pace (median 26d on market — plan ~3-4 weeks tenant-placement turnaround); 9,053 units permitted in Hillsborough County in 2024 (4,555 in 5+ unit buildings).
Forward outlook
- Local home prices are declining (-3.0%/yr); year-one equity from $1k of loan paydown is wiped out by about $4k of value loss. Plan a longer hold.
- Hillsborough County population projected at +37% by 2050 — long-run rental-demand tailwind backs the buy-and-hold thesis.
Negotiation context
- It's been on market 214 days — a 12% lower offer ($132k) is reasonable based on typical stale-listing flexibility.
- 2 sale attempts; this cycle's ask has dropped $20k (12%) from the opening price — seller is motivated, your offer sets the floor, not the list.
- Current owner paid $87k; list at $150k implies a 72% gain — meaningful room to come down on a strong offer.
Risks & watch-outs
- Watch-outs: HOA is 24% of rent.
- Climate carrying-cost: severe wind risk, 99% chance of damaging wind over 30y; extreme-heat days projected 7→27/yr by 2055 (HVAC capex compounding) — expect insurance premiums to compound above CPI over the hold.
Questions for the listing agent
- What do current leases actually rent for vs. the listed asking? Can we see a recent rent roll and the last 12 months of T-12 income?
- It's been on market 214 days. Have you received any prior offers? Is the seller open to a 13% concession, seller financing, or rate buy-down credit?
- What does the HOA fee cover, when was the last increase, and are there any pending special assessments or reserve-fund shortfalls?
- Any open or pending special assessments — roof, HVAC, plumbing, elevator, façade? What's the per-unit balance and payoff schedule, and is the seller paying it off at close or rolling it to the buyer?
- Why hasn't it sold? Are there any deal-killer items the seller is aware of (foundation, flood, title, zoning, code violations)?
- Is there a deadline driving the sale (1031 exchange, divorce, estate, relocation)? That informs how much negotiation room exists.
- Schools are D-rated, which usually means shorter tenancies and higher turnover. Who's the typical renter profile here, and what's been the actual vacancy rate?
- The area grade is low — what's the realistic commute time and amenity access for the typical tenant pool here? Any planned neighborhood developments (good or bad) we should know about?
- What's the average days-on-market for RENTAL listings here right now (not sales)? A rising rental-DOM trend means longer vacancies and softer asking-rent achievability than the comps imply.
- What's the recent tenant-quality profile in this submarket — average credit score on applications, eviction rate, late-payment / NSF rate, and stable-employment percentage? A property-management company in the area should have these aggregated.
- How much new apartment / multifamily construction is in the pipeline within 1–3 miles? Heavy new supply (>2% of stock underway) typically softens rents 12–24 months out; light construction supports rent growth.
Investment metrics
- 1% rule
- 1.18% ✓
- Cap rate
- 5.38%
- Cash-on-cash
- -3.26%
- DSCR
- 0.85
- GRM
- 7.1
CMA / ARV
No comps found within radius.
Projected returns pro-forma
-3.0% appreciation · 2.65% rent growth · sell at horizon
- IRR
- -22.0%
- Equity multiple
- 0.24×
- Total profit
- $-31,863
- Equity at exit
- $22,351
- IRR
- -16.6%
- Equity multiple
- 0.09×
- Total profit
- $-38,343
- Equity at exit
- $12,961
Cash invested: $41,972 (down + closing). Projections, not guarantees.
Landlord ↔ Tenant lean methodology
- Overall (STATE)
- 87 Strongly Landlord-Friendly
- State Florida
- 87 Strongly Landlord-Friendly · R+3
- County
- — inherits STATE
- City
- — inherits STATE
ZIP-level market 33573
- Home prices YoY
- -1.2%
- Rents YoY
- 2.6%
- Active inventory
- 605
- Price-to-rent
- 7.1×
Monthly cashflow live
- Estimated rent
- $1,767 high interval (Pro) →
- Mortgage (P&I)
- −$786
- Tax from tax record
- −$233 /mo · $2,798/yr
- Insurance
- −$62
- HOA
- −$428
- Vacancy / Maint / Mgmt
- −$371
- Net cashflow
- $-114
Break-even live
Sensitivity live
| Price | -10% $-29 | -5% $-72 | +0% $-114 | +5% $-157 | +10% $-199 |
|---|---|---|---|---|---|
| Rent | -10% $-254 | -5% $-184 | +0% $-114 | +5% $-44 | +10% $25 |
| Rate | -1.0pp $-39 | -0.5pp $-76 | base $-114 | +0.5pp $-153 | +1.0pp $-193 |
UW: 25.0% down · 7.5% · 30yr · 1.5% tax · 5.0% vac · 8.0% maint · 8.0% mgmt
Financing live
Cash to close
- Down payment
- $37,475
- Closing costs
- $4,497
- Reserves months
- —
- Total cash needed
- —
Loan-product check · same deal, 3 products live
Conventional
25% down · 7.5% · 30yr
- Down + closing
- —
- Monthly P&I
- —
- Monthly cashflow
- —
- DSCR
- —
- Eligible?
- —
Personal DTI + credit; lowest rate.
DSCR
20% down · 8.5% · 30yr
- Down + closing
- —
- Monthly P&I
- —
- Monthly cashflow
- —
- DSCR
- —
- Eligible?
- —
No personal income docs; deal must DSCR.
Hard money
10% down · 12.0% · 12mo
- Down + closing
- —
- Monthly P&I
- —
- Monthly cashflow
- —
- DSCR
- —
- Eligible?
- —
Short-term bridge; refi at stabilization.
Rent comps 38 comps
| Address | Beds | Baths | Sqft | Rent | $/sqft | DOM | Units | Dist |
|---|---|---|---|---|---|---|---|---|
| 207 Islip Way Sun City Center, FL | 2.0 | 1.5 | 992 | $1,500 | $1.51 | 19d | 1 | 0.46mi |
| 1814 Foxhunt Dr Unit A Sun City Center, FL | 1.0 | 1.5 | 800 | $1,475 | $1.84 | 26d | 1 | 0.60mi |
| 1802 Bedford Ln Sun City Center, FL | 1.0–2.0 | 2.0 | 952 | $1,800 | $1.89 | 12d | 2 | 0.61mi |
| 1005 Rickenbacker Dr Sun City Center, FL | 2.0 | 1.0 | 1224 | $1,595 | $1.30 | 4d | 1 | 0.61mi |
| 1802 Bedford Ter #182 Sun City Center, FL | 1.0 | 1.5 | 960 | $1,375 | $1.43 | 23d | 1 | 0.63mi |
| 1802 Bedford Ter #182 Sun City Center, FL | 1.0 | 1.5 | 800 | $1,400 | $1.75 | 19d | 1 | 0.63mi |
| 306 Fowling Ct Sun City Center, FL | 2.0 | 2.0 | 960 | $1,700 | $1.77 | 26d | 1 | 0.65mi |
| 1301 Warwick Ct Unit 1301 Sun City Center, FL | 1.0 | 1.0 | 1102 | $1,575 | $1.43 | 26d | 1 | 0.66mi |
| 201 Bedford St #95 Sun City Center, FL | 1.0 | 1.5 | 800 | $1,450 | $1.81 | 16d | 1 | 0.70mi |
| 403 Finchley Ct Unit B Sun City Center, FL | 2.0 | 2.0 | 960 | $2,000 | $2.08 | 26d | 1 | 0.71mi |
| 202 Bedford Trl #99 Sun City Center, FL | 1.0 | 1.0 | 800 | $1,500 | $1.88 | 6d | 1 | 0.73mi |
| 201 Bedford Trl Unit F128 Sun City Center, FL | 2.0 | 2.0 | 960 | $1,275 | $1.33 | 26d | 1 | 0.75mi |
| 409 Feltham Trl Unit B Sun City Center, FL | 2.0 | 2.0 | 984 | $1,650 | $1.68 | 26d | 1 | 0.77mi |
| 201 Kings Blvd #19 Sun City Center, FL | 1.0 | 1.5 | 800 | $1,495 | $1.87 | 26d | 1 | 0.79mi |
| 1901 Andover Way #38 Sun City Center, FL | 1.0 | 1.5 | 800 | $1,495 | $1.87 | 26d | 1 | 0.83mi |
| 701 Cypress Pl Sun City Center, FL | 2.0 | 2.0 | 1425 | $1,700 | $1.19 | 26d | 1 | 0.87mi |
| 16705 Myrtle Sand Dr Wimauma, FL | 3.0 | 2.0 | 1253 | $2,350 | $1.88 | 26d | 1 | 0.91mi |
| 1104 Desert Hills Dr Sun City Center, FL | 2.0 | 2.0 | 1383 | $1,825 | $1.32 | 19d | 1 | 0.92mi |
| 301 Kings Blvd #138 Sun City Center, FL | 1.0 | 1.5 | 1020 | $1,800 | $1.76 | 23d | 1 | 0.94mi |
| 717 Indian Wells Ave Sun City Center, FL | 2.0 | 2.0 | 1264 | $1,595 | $1.26 | 26d | 1 | 0.94mi |
| 1528 Chevy Chase Dr Sun City Center, FL | 2.0 | 2.0 | 1346 | $2,000 | $1.49 | 26d | 1 | 0.96mi |
| 323 Knottwood Ct #1 Sun City Center, FL | 1.0 | 1.0 | 908 | $1,090 | $1.20 | 6d | 1 | 0.99mi |
| 323 Knottwood Ct Sun City Center, FL | 1.0 | 1.0 | 908 | $1,290 | $1.42 | 26d | 1 | 0.99mi |
| 101 Cambridge Trl Sun City Center, FL | 1.0–2.0 | 1.5–2.0 | 880 | $1,650 | $1.88 | 13d | 1 | 1.06mi |
| 1103 Villeroy Dr Sun City Center, FL | 3.0 | 2.0 | 1490 | $2,500 | $1.68 | 12d | 1 | 1.16mi |
| 302 Canton Ct #62 Sun City Center, FL | 1.0 | 1.5 | 800 | $1,575 | $1.97 | 19d | 1 | 1.16mi |
| 704 Tremont Greens Ln Unit 107 Sun City Center, FL | 2.0 | 2.0 | 974 | $1,700 | $1.75 | 26d | 1 | 1.19mi |
| 2202 Clubhouse Dr #169 Sun City Center, FL | 2.0 | 2.0 | 984 | $1,450 | $1.47 | 6d | 1 | 1.19mi |
| 2202 Clubhouse Dr #187 Sun City Center, FL | 1.0 | 1.5 | 800 | $1,550 | $1.94 | 26d | 1 | 1.19mi |
| 1902 Dandridge St #12 Sun City Center, FL | 1.0 | 1.5 | 800 | $1,495 | $1.87 | 16d | 1 | 1.23mi |
| 704 Torrey Pines Ave Sun City Center, FL | 2.0 | 1.0 | 981 | $1,675 | $1.71 | 26d | 1 | 1.23mi |
| 704 Torrey Pines Ave Sun City Center, FL | 2.0 | 1.0 | 981 | $1,700 | $1.73 | 16d | 1 | 1.23mi |
| 1906 Canterbury Ln #26 Sun City Center, FL | 2.0 | 2.0 | 1200 | $1,750 | $1.46 | 1d | 1 | 1.29mi |
| 810 Oakmont Ave Sun City Center, FL | 2.0 | 2.0 | 1266 | $2,100 | $1.66 | 26d | 1 | 1.32mi |
| 110 Gloucester Blvd Sun City Center, FL | 2.0 | 2.0 | 1136 | $1,950 | $1.72 | 0d | 1 | 1.39mi |
| 110 Gloucester Blvd Sun City Center, FL | 2.0 | 2.0 | 1136 | $1,950 | $1.72 | 26d | 1 | 1.39mi |
| 4902 Cosmos Cir Wimauma, FL | 3.0 | 1.0–3.5 | 1231 | $2,345 | $1.90 | 0d | 38 | 1.41mi |
| 2345 Glenmore Cir Unit 294 Sun City Center, FL | 2.0 | 2.0 | 984 | $1,500 | $1.52 | 26d | 1 | 1.43mi |
HOA detail condo
- Monthly dues
- $428 · $5,136/yr
- Likely covers
- water
- Assessments
- None detected in remarks — confirm with the listing agent.
Listing history 23 events
-
2026-06-21days on market $149,900 Active 214 DOM
-
2026-06-18days on market $149,900 Active 211 DOM
-
2026-06-17days on market $149,900 Active 210 DOM
-
2026-06-16days on market $149,900 Active 209 DOM
-
2026-06-15days on market $149,900 Active 208 DOM
-
2026-06-13days on market $149,900 Active 206 DOM
-
2026-06-13days on market $149,900 Active 205 DOM
-
2026-06-09days on market $149,900 Active 202 DOM
-
2026-06-08days on market $149,900 Active 201 DOM
-
2026-06-07days on market $149,900 Active 200 DOM
-
2026-06-04days on market $149,900 Active 197 DOM
-
2026-06-03days on market $149,900 Active 196 DOM
-
2026-06-02days on market $149,900 Active 195 DOM
-
2026-06-01days on market $149,900 Active 194 DOM
-
2026-05-31days on market $149,900 Active 193 DOM
-
2026-05-18status Active
-
2026-05-18price $149,900
-
2026-05-11status Pending
-
2026-01-23price $164,900
-
2025-11-12$169,900 Active
-
2016-05-03soldstatus $87,000
-
1998-02-24soldstatus $59,500
-
1992-09-01soldstatus $44,000
ⓘ Source: listings_history table (triggers on properties + properties_extension) + one-shot
backfill from property_details.listing_events for pre-trigger history.
Tax reassessment forecast FL · Resets to sale price
- Current annual tax
- $2,798 · $233/mo
- Projected year-2 tax
- $2,798 · $233/mo
- Expected delta
- $0/yr ($0/mo · 0.0%)
ⓘ Screening estimate from a state-policy table — verify with the county assessor before closing.
Climate risk First Street
- Flood 1/10 Low FEMA zone X (unshaded) · 0% chance over 30 yrs
- Wildfire 4/10 Moderate
- Heat 10/10 Extreme 7 d/yr ≥109°F today · 27 d/yr by 30 yrs out
- Wind 10/10 Extreme 99% chance of damaging wind over 30 yrs
- Air quality 3/10 Moderate 3 unhealthy d/yr today · 3 by 30 yrs out
Nearby sold comps map
Loading sold comps map…
Walkable amenities ~0.75 mi
Loading nearby amenities…
Taxation est. · year 1
- Rental income
- $21,199
- − Mortgage interest
- −$8,397
- − Property taxes
- −$2,798
- − Insurance
- −$750
- − Repairs & maintenance
- −$1,696
- − Management
- −$1,696
- − HOA
- −$5,136
- − Depreciation
- −$4,361
- Taxable loss
- −$3,634
- Est. tax savings @ 24.0%
- +$872
- After-tax cash flow
- $-498/yr
For passive investors: Depreciation is non-cash, so a rental often shows a tax loss while cash-flowing — sheltering income. Rental losses are passive: they offset passive income freely, and up to $25,000/yr can offset ordinary (W-2) income if you actively participate and your MAGI is under $100k (phasing out to $0 by $150k); unused losses carry forward. On sale, claimed depreciation is recaptured at up to 25%, and gains may owe capital-gains tax (a 1031 exchange can defer both). Figures are a year-1 estimate at your 24.0% rate — not tax advice; consult a CPA.
Schools (NCES district)
- District
- Hillsborough
- NCES district ID
- 1200870
- Math proficiency
- 47% ▼ -8.00%
- Reading proficiency
- 50% ▼ -4.00%
- Median HH income
- $50,622
- Composite
- 41.6/100
- National rank
- #3435
- State rank
- #41 of 73 in FL
Livability — Sun City Center
- Score
- 78/100
- State rank
- #178
- US rank
- #2736
Category grades
Schools grade is shown separately in the Schools card above.
Census & demographics
- Census place
- Sun City Center, FL
- County
- Hillsborough County · 1,540,968 people
- City population
- 35,362
- Metro
- Tampa-St. Petersburg-Clearwater, FL
- Population (ZIP)
- 35,362
- Household income
- $72,834
- Rent vs Own
- Severe rent burden
- 1382.0
Population outlook (Hillsborough County) Hauer SSP2
- Today (2025)
- 1,607,022 people
- By 2030
- 1,733,968 · +7.9%
- By 2040
- 1,979,565 · +23.2%
- By 2050
- 2,203,427 · +37.1%
- By 2075
- 2,667,893 · +66.0%
- By 2100
- 2,891,558 · +79.9%
Race, ethnicity, and origin ACS 2023
- Neighborhood character
- Predominantly White (73%)
- Race & ethnicity
- White 73% Hispanic / Latino 13% Two or more races 11% Black 10% Asian 1%
- Hispanic origin (detail)
- Mexican 1% Puerto Rican 6% Cuban 2%
- Common ancestry
- Romanian 3% Lithuanian 3% Slovak 2%
- Foreign-born
- 8% · Canada, Vietnam
- Languages at home
- 86% English-only · Spanish 10% French/Haitian/Cajun 1% German/W. Germanic 1%
Political lean MEDSL · Hillsborough
- 2024 margin
- Toss-up / Even · D 47.8% · R 50.9% · Other 1.3%
- 2008→2024 swing
- -10.2pp toward R · 2008: 7.1pp · 2024: -3.1pp
- All cycles
- 2024: R+3.1 2020: D+6.9 2016: D+6.8 2012: D+6.7 2008: D+7.1
Not yet ingested
- Civics
- —
Market trends
- HPI YoY
- ▼ -3.27%
- Current HPI
- 272.9767
- Rent YoY
- ▲ 2.65%
- Metro
- Tampa-St. Petersburg-Clearwater, FL
- State GDP YoY
- ▲ 3.28%
- F500 in state
- 36
Industry mix (Fortune 500 HQ in FL)
| Industry | F500 HQs | Revenue |
|---|---|---|
| Industrial Technology | 2 | $29B |
|
||
| Insurance | 2 | $17B |
|
||
| Retail | 1 | $60B |
|
||
| Technology Distribution | 1 | $58B |
|
||
| Homebuilding | 1 | $35B |
|
||
| Technology Manufacturing | 1 | $35B |
|
||
Price history
+240.7% since first listed8 events — show timeline
- 2026-05-18 Relisted — Stellar MLS as Distributed by MLS Grid
- 2026-05-18 Price Changed $149,900 Stellar MLS as Distributed by MLS Grid
- 2026-05-11 Pending — Stellar MLS as Distributed by MLS Grid
- 2026-01-23 Price Changed $164,900 Stellar MLS as Distributed by MLS Grid
- 2025-11-12 Listed $169,900 Stellar MLS as Distributed by MLS Grid
- 2016-05-03 Sold (Public Records) $87,000 Public Records
- 1998-02-24 Sold (Public Records) $59,500 Public Records
- 1992-09-01 Sold (Public Records) $44,000 Public Records
Property tax history
+9.4%/yrLatest (2025): $2,798 · +11.6% YoY. Source: county tax records.
Cash-flow waterfall
monthlySold comps — $/sqft
last 12 mo · ≤1 miLoading sold comps…