 6-Plex
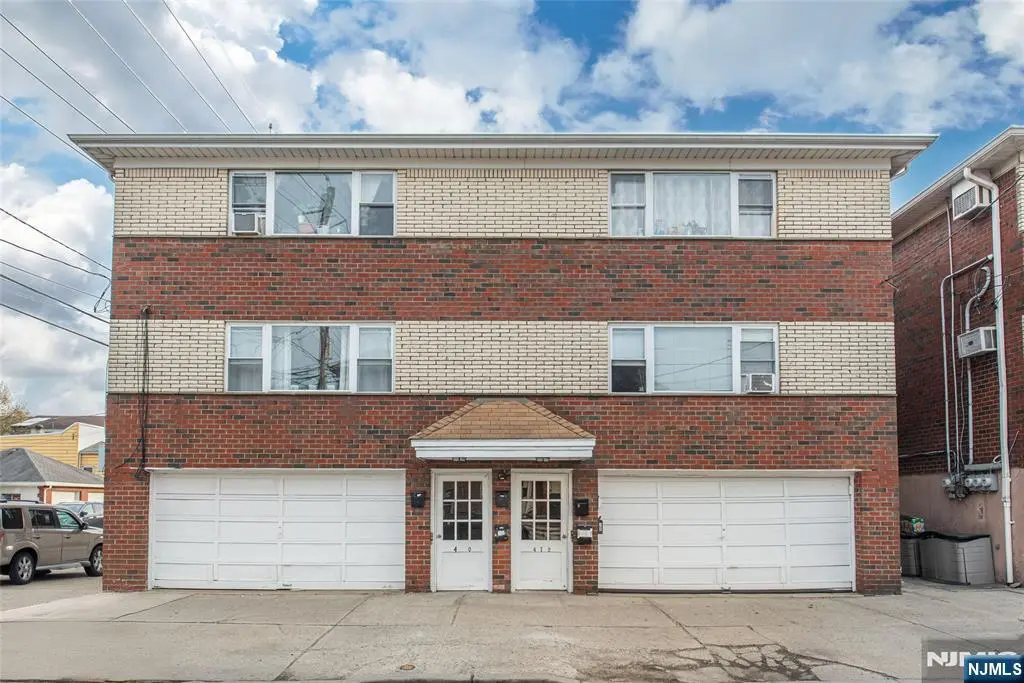
472 Walker St · Fairview, NJ
Flood risk 4/10 · Minor
- FEMA flood zone
- X (unshaded)
- Chance of flooding over 30 yrs
- 0.2%
- Est. flood insurance / yr
- $507 – $1,088
Fire risk 1/10 · Minimal
- Est. fire insurance / yr
- $526 – $976
Heat risk 7/10 · Major
- Hot days now (above 99°F)
- 7 days/yr
- Hot days in 30 yrs
- 15 days/yr
Wind risk 6/10 · Moderate
- Chance of severe wind over 30 yrs
- 27.0%
Air-quality risk 4/10 · Minor
- Unhealthy air days now
- 5 days/yr
- Unhealthy air days in 30 yrs
- 6 days/yr
Risk factors via First Street. Map © Google.
Why this score? — see what drove the D+ grade
The composite is a weighted blend of 9 inputs, each scored 0–100. Each bar is that input's sub-score; the figure is the points it added to the 100-point composite (weight × sub-score).
- Cash flow +17.7/30.0
- ARV discount +7.5/15.0
- DSCR +5.5/10.0
- 1% rule +4.8/10.0
- Appreciation +4.0/10.0
- Livability +3.7/5.0
- Rent growth +2.5/5.0
- Condition / age +2.2/5.0
- Schools +1.6/10.0
$1,650,000
🖨 Deal sheet 📄 Offer letter ✓ Due diligence
Multi-family units
County records classify this as Multi-Family (2-4 Unit). Listing-text estimate: 6 units. estimate disagrees with records
Listing remarks
Prime Investment Opportunity: Fully Leased 6-Unit Multifamily Looking for a "set it and forget it" addition to your portfolio or 1031 Exchange? This 6-unit walk-up offers immediate cash flow, long-term stability, and a layout that maximizes rental income. Situated in a high-demand area, this property is perfectly positioned for the savvy investor. This property offers a versatile unit mix designed to attract a wide range of residents: Four 4 Spacious 3-Bedroom Units: Each featuring 1 full bath. These generous layouts are the backbone of the building's revenue. Two 2 Efficient 1-Bedroom Units: Parking & Storage: Total of four garage spaces. Each side of the building features
Key facts
- Retail convenience
- High demand area
- Versatile unit mix
Tags
Property features AI
Exterior
- Home design: Residential Income property; Mixed-use
- Exterior features: Flat roof
Neighborhood map
What this means for you Summary
Snapshot
- This is a 4×3bd/1ba + 2×1bd/1ba units multifamily listed at $1.65M. Condition is rated fair.
Deal economics
- At list price, monthly cash flow is $1k ($16k/yr) — positive. Per door: $223/mo.
- The deal already cash-flows at list — no discount required.
- To meet the 1% rule (rent ≥ 1% of price), the offer needs to be $1.61M (2.3% below list).
- Recommended offer: $1.60M (3.0% below list) — sets the bar for market timing.
- Cap rate 7.3% vs local median 2.5% in Fairview — top-decile yield for the area; either an underpriced asset or a hidden risk that comps aren't pricing in. Stress-test before assuming the spread holds.
Location & tenants
- Location reads 74/100 on livability (#174 in NJ, #4,548 nationally) — a middle-class / working-renter tenant base. Strengths: crime A+, employment A+, housing A+; Watch: commute C-, schools D-, cost of living F.
- Fairview Public School District (suburban): math 6% / reading 30% proficiency, ranked #440 of 472 in NJ (top 93%) — low school quality limits family demand, transient renter base, plan for 1-2y turnover; 65% free/reduced lunch — lower-income household profile, screen leases tightly.
- Market conditions: 25 active listings in the ZIP; 40 comparable units currently listed for rent nearby; rentals at typical pace (median 25d on market — plan ~3-4 weeks tenant-placement turnaround); 3,488 units permitted in Bergen County in 2024 (1,610 in 5+ unit buildings).
- At $16,125/mo this rent would consume 304% of the median local household income ($64k/yr) (locally 1247% of renters already pay >50% of income on rent) — very limited rent-growth headroom before tenants either downsize or default.
Forward outlook
- Local home prices are declining (-2.1%/yr); year-one equity from $11k of loan paydown is wiped out by about $35k of value loss. Plan a longer hold.
- Bergen County population projected at +20% by 2050 — long-run rental-demand tailwind backs the buy-and-hold thesis.
Negotiation context
- It's been on market 50 days — a 3% lower offer ($1.60M) is reasonable based on typical stale-listing flexibility.
Risks & watch-outs
- Climate carrying-cost: major wind risk, 27% chance of damaging wind over 30y; extreme-heat days projected 7→15/yr by 2055 (HVAC capex compounding) — expect insurance premiums to compound above CPI over the hold.
Questions for the listing agent
- It's been on market 50 days. Have you received any prior offers? Is the seller open to a 3% concession, seller financing, or rate buy-down credit?
- Can we see the unit-by-unit rent roll, current vacancy, and any below-market leases? What's the average tenancy length?
- What capital expenditures (roof, boiler, parking lot, exteriors) have been made in the last 5 years, and what's planned in the next 2?
- Have any recent inspections been done? Can we get a copy of the seller's disclosures and any deferred-maintenance estimates?
- Is there a deadline driving the sale (1031 exchange, divorce, estate, relocation)? That informs how much negotiation room exists.
- Schools are D-rated, which usually means shorter tenancies and higher turnover. Who's the typical renter profile here, and what's been the actual vacancy rate?
- The area grade is low — what's the realistic commute time and amenity access for the typical tenant pool here? Any planned neighborhood developments (good or bad) we should know about?
- What's the average days-on-market for RENTAL listings here right now (not sales)? A rising rental-DOM trend means longer vacancies and softer asking-rent achievability than the comps imply.
- What's the recent tenant-quality profile in this submarket — average credit score on applications, eviction rate, late-payment / NSF rate, and stable-employment percentage? A property-management company in the area should have these aggregated.
- How much new apartment / multifamily construction is in the pipeline within 1–3 miles? Heavy new supply (>2% of stock underway) typically softens rents 12–24 months out; light construction supports rent growth.
Investment metrics
- 1% rule
- 0.98% ✗
- Cap rate
- 7.26%
- Cash-on-cash
- 3.47%
- DSCR
- 1.15
- GRM
- 8.5
CMA / ARV
No comps found within radius.
Show comp detail 12 sales within ~0.75 mi
| Address | Dist | Beds/Ba | Sqft | Sold | Price | $/sf | Match |
|---|---|---|---|---|---|---|---|
| 412 Walker St | 0.14mi | 7/3.5 | — | 1mo | $935,000 | — | 80 |
| 385A Roosevelt St | 0.26mi | 4/3.5 | — | 2mo | $860,000 | — | 74 |
| 423 8th St | 0.30mi | 4/2.0 | — | 1mo | $690,000 | — | 73 |
| 373 Jersey Ave | 0.28mi | 7/5.0 | — | 2mo | $1,170,000 | — | 73 |
| 174 Maple St | 0.33mi | 7/5.5 | — | 2mo | $1,200,000 | — | 70 |
| 677 Greeley Ave | 0.41mi | 4/2.0 | — | 1mo | $700,000 | — | 68 |
| 397 Oak St | 0.51mi | 5/3.0 | — | 0mo | $925,000 | — | 64 |
| 272 Wilson Ave | 0.55mi | 4/3.0 | — | 0mo | $800,000 | — | 62 |
| 214 Morris St | 0.53mi | 6/3.0 | 2,296 | 1mo | $930,000 | $405 | 62 |
| 579 Oregon Ave | 0.63mi | 3/3.0 | — | 0mo | $750,000 | — | 58 |
| 9005 Smith Ave | 0.68mi | 4/4.0 | — | 1mo | $825,000 | — | 55 |
| 800 De Lalla Ter | 0.72mi | 5/3.5 | — | 0mo | $1,150,000 | — | 54 |
Match score weights: distance 35% · size 25% · config 20% · recency 20%. Top-matched comps best support the ARV.
Projected returns pro-forma
-2.09% appreciation · 3.0% rent growth · sell at horizon
- IRR
- -6.4%
- Equity multiple
- 0.74×
- Total profit
- $-118,601
- Equity at exit
- $313,508
- IRR
- 1.7%
- Equity multiple
- 1.14×
- Total profit
- $63,585
- Equity at exit
- $261,329
Cash invested: $462,000 (down + closing). Projections, not guarantees.
Landlord ↔ Tenant lean methodology
- Overall (STATE)
- 21 Tenant-Leaning
- State New Jersey
- 21 Tenant-Leaning · D+6
- County
- — inherits STATE
- City
- — inherits STATE
ZIP-level market 07022
- Home prices YoY
- -0.6%
- Active inventory
- 25
- Price-to-rent
- 46.4×
Monthly cashflow live
- Estimated rent
- $16,125 high interval (Pro) →
- Mortgage (P&I)
- −$8,653
- Tax est. 1.5%
- −$2,062 /mo · $24,750/yr
- Insurance
- −$688
- HOA
- −$0
- Vacancy / Maint / Mgmt
- −$3,386
- Net cashflow
- $1,336
Break-even live
6-unit breakdown (identical units grouped — click to expand)
| Units | Beds | Baths | Est. rent |
|---|---|---|---|
| 4× units | 3 | 1 | $11,848 |
| #1 | 3 | 1 | $2,962 |
| #2 | 3 | 1 | $2,962 |
| #3 | 3 | 1 | $2,962 |
| #4 | 3 | 1 | $2,962 |
| 2× units | 1 | 1 | $4,278 |
| #5 | 1 | 1 | $2,139 |
| #6 | 1 | 1 | $2,139 |
| Total (6 units) | $16,125 | ||
UW: 25.0% down · 7.5% · 30yr · 1.5% tax · 5.0% vac · 8.0% maint · 8.0% mgmt
Financing live
Cash to close
- Down payment
- $412,500
- Closing costs
- $49,500
- Reserves months
- —
- Total cash needed
- —
Loan-product check · same deal, 3 products live
Conventional
25% down · 7.5% · 30yr
- Down + closing
- —
- Monthly P&I
- —
- Monthly cashflow
- —
- DSCR
- —
- Eligible?
- —
Personal DTI + credit; lowest rate.
DSCR
20% down · 8.5% · 30yr
- Down + closing
- —
- Monthly P&I
- —
- Monthly cashflow
- —
- DSCR
- —
- Eligible?
- —
No personal income docs; deal must DSCR.
Hard money
10% down · 12.0% · 12mo
- Down + closing
- —
- Monthly P&I
- —
- Monthly cashflow
- —
- DSCR
- —
- Eligible?
- —
Short-term bridge; refi at stabilization.
Rent comps 40 comps
| Address | Beds | Baths | Sqft | Rent | $/sqft | DOM | Units | Dist |
|---|---|---|---|---|---|---|---|---|
| 491 Walker St Unit 3C Fairview, NJ | 2.0 | 2.0 | — | $3,099 | — | 24d | 1 | 0.03mi |
| 208 Bergen Blvd Unit 3 Fairview, NJ | 1.0 | 1.0 | — | $1,750 | — | 24d | 1 | 0.06mi |
| 319 7th St Fairview, NJ | 3.0 | 2.0 | — | $3,500 | — | 21d | 1 | 0.14mi |
| 520 Cliff St Fairview, NJ | 1.0–2.0 | 1.0–2.0 | 900 | $3,000 | $3.33 | 3d | 1 | 0.14mi |
| 225 6th St #2 Fairview, NJ | 3.0 | 2.0 | — | $3,000 | — | 24d | 1 | 0.17mi |
| 333 Bergen Blvd Fairview, NJ | 1.0 | 1.0 | 723 | $2,675 | $3.70 | 7d | 1 | 0.17mi |
| 311 6th St Unit C Fairview, NJ | 2.0 | 1.0 | — | $2,200 | — | 7d | 1 | 0.17mi |
| 399 Walker St Unit 1B Fairview, NJ | 3.0 | 1.0 | — | $3,200 | — | 20d | 1 | 0.20mi |
| 440 Morningside Ave Fairview, NJ | 1.0 | 1.0 | 650 | $1,900 | $2.92 | 24d | 1 | 0.20mi |
| 311 5th St Unit 2 Fairview, NJ | 3.0 | 1.0 | — | $3,000 | — | 24d | 1 | 0.22mi |
| 311 5th St Unit B Fairview, NJ | 2.0 | 1.0 | — | $2,400 | — | 24d | 1 | 0.22mi |
| 371 Bergen Blvd Fairview, NJ | 1.0–2.0 | 1.0 | 900 | $3,000 | $3.33 | 3d | 5 | 0.26mi |
| 150 6th St Unit 3 Fairview, NJ | 1.0 | 1.0 | — | $1,750 | — | 20d | 1 | 0.27mi |
| 648 Fairview Ave Unit 2 Fairview, NJ | 3.0 | 1.0 | — | $3,000 | — | 24d | 1 | 0.28mi |
| 129 6th St #1 Fairview, NJ | 2.0 | 1.0 | — | $2,395 | — | 20d | 1 | 0.30mi |
| 2 Carlen Ct Unit 1 Fairview, NJ | 3.0 | 2.0 | — | $3,900 | — | 18d | 1 | 0.31mi |
| 174 Maple St Apt 3 Fairview, NJ | 3.0 | 2.0 | — | $3,400 | — | 2d | 1 | 0.31mi |
| 7 Luxoro Pl Unit 1 Fairview, NJ | 2.0 | 1.0 | — | $2,500 | — | 7d | 1 | 0.32mi |
| 380 Park Ave Unit 2 Fairview, NJ | 2.0 | 1.0 | — | $2,000 | — | 24d | 1 | 0.32mi |
| 322 Anderson Ave Fairview, NJ | 1.0 | 1.0 | — | $1,900 | — | 24d | 1 | 0.34mi |
| 182 Anderson Ave Unit 3A Fairview, NJ | 1.0 | 1.0 | — | $2,950 | — | 24d | 1 | 0.35mi |
| 261 Walker St Fairview, NJ | 1.0 | 1.0 | — | $1,812 | — | 24d | 1 | 0.36mi |
| 261 Walker St Unit 6 Fairview, NJ | 1.0 | 1.0 | — | $1,775 | — | 3d | 1 | 0.36mi |
| 470 Bergen Blvd Unit 2nd Fl Ridgefield, NJ | 3.0 | 1.0 | — | $2,900 | — | 24d | 1 | 0.36mi |
| 4 Burdette Pl Fairview, NJ | 2.0 | 1.0 | — | $1,950 | — | 21d | 1 | 0.37mi |
| 166 Sedore Ave Unit 1 Fairview, NJ | 1.0 | 1.0 | — | $1,500 | — | 7d | 1 | 0.38mi |
| 455 Fairview Ave Fairview, NJ | 1.0 | 1.0 | 900 | $1,822 | $2.02 | 1d | 4 | 0.38mi |
| 403 Anderson Ave Unit 4 B Fairview, NJ | 2.0 | 1.0 | — | $1,900 | — | 3d | 1 | 0.39mi |
| 370 Henry St Apt 2 Fairview, NJ | 3.0 | 2.0 | — | $2,900 | — | 24d | 1 | 0.39mi |
| 282-284 Washington St Unit 284 Fairview, NJ | 3.0 | 1.5 | — | $4,000 | — | 24d | 1 | 0.43mi |
| 248 Clark Ter Cliffside Park, NJ | 3.0 | 2.5 | — | $4,750 | — | 24d | 1 | 0.44mi |
| 307 Henry St #2 Fairview, NJ | 2.0 | 1.0 | — | $2,500 | — | 24d | 1 | 0.45mi |
| 505 Westview Ave Unit 1st Floor Ridgefield, NJ | 3.0 | 1.0 | — | $3,000 | — | 2d | 1 | 0.45mi |
| 44 Bergen Blvd Unit 9 Fairview, NJ | 1.0 | 1.0 | — | $1,850 | — | 24d | 1 | 0.45mi |
| 509 Saint Pauls Ave Unit Second Floor Cliffside Park, NJ | 1.0 | 1.0 | — | $2,000 | — | 24d | 1 | 0.45mi |
| 44 Bergen Blvd #4 Fairview, NJ | 1.0 | 1.0 | — | $1,900 | — | 24d | 1 | 0.46mi |
| 284 John St Unit 1 Cliffside Park, NJ | 1.0 | 1.0 | — | $2,000 | — | 24d | 1 | 0.46mi |
| 234 Kamena St Unit 3 Fairview, NJ | 3.0 | 1.0 | — | $2,800 | — | 24d | 1 | 0.46mi |
| 238 Clark Ter Unit 2nd floor Cliffside Park, NJ | 3.0 | 1.0 | — | $3,000 | — | 24d | 1 | 0.46mi |
| 365 Commercial Ave Unit 2 Cliffside Park, NJ | 1.0 | 1.0 | — | $1,750 | — | 24d | 1 | 0.46mi |
Listing history 15 events
-
2026-06-18days on market $1,650,000 Active 50 DOM
-
2026-06-17days on market $1,650,000 Active 49 DOM
-
2026-06-16days on market $1,650,000 Active 48 DOM
-
2026-06-15days on market $1,650,000 Active 47 DOM
-
2026-06-13days on market $1,650,000 Active 45 DOM
-
2026-06-13days on market $1,650,000 Active 44 DOM
-
2026-06-09days on market $1,650,000 Active 41 DOM
-
2026-06-08days on market $1,650,000 Active 40 DOM
-
2026-06-07days on market $1,650,000 Active 39 DOM
-
2026-06-04days on market $1,650,000 Active 36 DOM
-
2026-06-03days on market $1,650,000 Active 35 DOM
-
2026-06-02days on market $1,650,000 Active 34 DOM
-
2026-06-01days on market $1,650,000 Active 33 DOM
-
2026-05-31days on market $1,650,000 Active 32 DOM
-
2026-04-27$1,650,000 Active
ⓘ Source: listings_history table (triggers on properties + properties_extension) + one-shot
backfill from property_details.listing_events for pre-trigger history.
Climate risk First Street
- Flood 4/10 Moderate FEMA zone X (unshaded) · 20% chance over 30 yrs
- Wildfire 1/10 Low
- Heat 7/10 Severe 7 d/yr ≥99°F today · 15 d/yr by 30 yrs out
- Wind 6/10 Major 27% chance of damaging wind over 30 yrs
- Air quality 4/10 Moderate 5 unhealthy d/yr today · 6 by 30 yrs out
Nearby sold comps map
Loading sold comps map…
Walkable amenities ~0.75 mi
Loading nearby amenities…
Taxation est. · year 1
- Rental income
- $193,500
- − Mortgage interest
- −$92,426
- − Property taxes
- −$24,750
- − Insurance
- −$8,250
- − Repairs & maintenance
- −$15,480
- − Management
- −$15,480
- − Depreciation
- −$48,000
- Taxable loss
- −$10,886
- Est. tax savings @ 24.0%
- +$2,613
- After-tax cash flow
- $18,644/yr
For passive investors: Depreciation is non-cash, so a rental often shows a tax loss while cash-flowing — sheltering income. Rental losses are passive: they offset passive income freely, and up to $25,000/yr can offset ordinary (W-2) income if you actively participate and your MAGI is under $100k (phasing out to $0 by $150k); unused losses carry forward. On sale, claimed depreciation is recaptured at up to 25%, and gains may owe capital-gains tax (a 1031 exchange can defer both). Figures are a year-1 estimate at your 24.0% rate — not tax advice; consult a CPA.
Condition & rehab AI · 12 photos
This 6-unit multifamily property presents as needing moderate renovations to improve its condition and value. Immediate updates to the kitchen and bathrooms, along with a new HVAC system, would significantly enhance its resale and rental potential.
Repairs flagged
- Moderate kitchen cabinets — dated and worn
- Moderate kitchen countertops — dated and worn
- Major bathroom fixtures — dated and in poor condition
- Major bathroom tile — dated and in poor condition
- Unknown HVAC system — photos do not show HVAC
Value-add opportunities
- Both update kitchen cabinets and countertops — modernizing kitchen will appeal to buyers and renters
- Both replace bathroom fixtures and tile — modernizing bathrooms will appeal to buyers and renters
- Both install new HVAC system — modernizing HVAC will improve comfort and energy efficiency
Renovation cost estimate screening
| Repair item | Severity | Est. cost |
|---|---|---|
| kitchen cabinets · dated and worn | Moderate | $3,000–15,000 |
| kitchen countertops · dated and worn | Moderate | $3,000–15,000 |
| bathroom fixtures · dated and in poor condition | Major | $15,000–50,000 |
| bathroom tile · dated and in poor condition | Major | $15,000–50,000 |
| HVAC system · photos do not show HVAC | Unknown | $500–3,000 |
| Total estimated repair cost · 5 items | $36,500–133,000 |
Value-add ROI direction
- Both update kitchen cabinets and countertops — modernizing kitchen will appeal to buyers and renters ↑
- Both replace bathroom fixtures and tile — modernizing bathrooms will appeal to buyers and renters ↑
- Both install new HVAC system — modernizing HVAC will improve comfort and energy efficiency ↑
ⓘ Cost ranges are severity-bucket heuristics (US national rule-of-thumb). Get contractor quotes + a written scope before underwriting a rehab budget.
Schools (NCES district)
- District
- Fairview Public School District
- NCES district ID
- 3405070
- Math proficiency
- 6% ▼ -20.00%
- Reading proficiency
- 30% ▼ -4.00%
- Median HH income
- $49,155
- Composite
- 16.08/100
- National rank
- #9236
- State rank
- #440 of 472 in NJ
Livability — Fairview
- Score
- 74/100
- State rank
- #174
- US rank
- #4548
Category grades
Schools grade is shown separately in the Schools card above.
Census & demographics
- Census place
- Fairview, NJ
- County
- Bergen County · 586,961 people
- City population
- 15,099
- Metro
- New York-Newark-Jersey City, NY-NJ-PA
- Population (ZIP)
- 15,099
- Household income
- $63,606
- Rent vs Own
- Severe rent burden
- 1247.0
Population outlook (Bergen County) Hauer SSP2
- Today (2025)
- 1,021,896 people
- By 2030
- 1,063,119 · +4.0%
- By 2040
- 1,146,566 · +12.2%
- By 2050
- 1,229,132 · +20.3%
- By 2075
- 1,429,694 · +39.9%
- By 2100
- 1,547,614 · +51.4%
Race, ethnicity, and origin ACS 2023
- Neighborhood character
- Majority Hispanic (63%)
- Race & ethnicity
- Hispanic / Latino 63% White 29% Two or more races 16% Asian 4% Native American 1% Black 1%
- Hispanic origin (detail)
- Puerto Rican 5% Cuban 4% Dominican 7%
- Common ancestry
- Lithuanian 2% Iranian 1% Italian 1%
- Foreign-born
- 48% · Canada, Jamaica, South Korea
- Languages at home
- 29% English-only · Spanish 56% Arabic 4% Other Indo-European 4%
Political lean MEDSL · Bergen
- 2024 margin
- Toss-up / Even · D 50.7% · R 47.3% · Other 2.0%
- 2008→2024 swing
- -6.1pp toward R · 2008: 9.5pp · 2024: 3.4pp
- All cycles
- 2024: D+3.4 2020: D+16.4 2016: D+12.0 2012: D+10.8 2008: D+9.5
Not yet ingested
- Civics
- —
Market trends
- HPI YoY
- ▼ -2.09%
- Current HPI
- 342.7225
- Rent YoY
- —
- Metro
- New York-Newark-Jersey City, NY-NJ-PA
- State GDP YoY
- ▲ 2.05%
- F500 in state
- 34
Industry mix (Fortune 500 HQ in NJ)
| Industry | F500 HQs | Revenue |
|---|---|---|
| Consumer Goods | 3 | $31B |
|
||
| Pharmaceuticals | 2 | $153B |
|
||
| Technology | 2 | $21B |
|
||
| Insurance | 2 | $20B |
|
||
| Healthcare | 2 | $19B |
|
||
| Financial Services | 1 | $70B |
|
||
Price history
1 event — show timeline
- 2026-04-27 Listed $1,650,000 NJMLS
Cash-flow waterfall
monthlySold comps — $/sqft
last 12 mo · ≤1 miLoading sold comps…