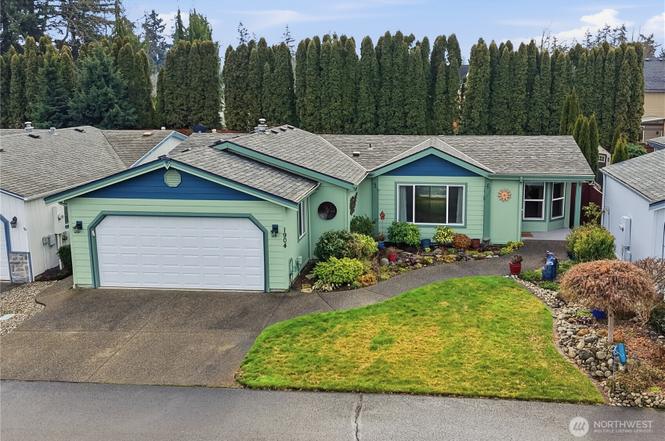
1904 177th Street Ct E #32 · Spanaway, WA
Flood risk 1/10 · Minimal
- FEMA flood zone
- X (unshaded)
- Chance of flooding over 30 yrs
- 0.0%
- Est. flood insurance / yr
- $507 – $1,088
Fire risk 2/10 · Minimal
- Est. fire insurance / yr
- $604 – $1,122
Heat risk 3/10 · Minor
- Hot days now (above 87°F)
- 7 days/yr
- Hot days in 30 yrs
- 15 days/yr
Wind risk 1/10 · Minimal
- Chance of severe wind over 30 yrs
- —
Air-quality risk 7/10 · Major
- Unhealthy air days now
- 9 days/yr
- Unhealthy air days in 30 yrs
- 10 days/yr
Risk factors via First Street. Map © Google.
Why this score? — see what drove the C+ grade
The composite is a weighted blend of 9 inputs, each scored 0–100. Each bar is that input's sub-score; the figure is the points it added to the 100-point composite (weight × sub-score).
- Cash flow +26.1/30.0
- DSCR +8.8/10.0
- ARV discount +8.8/15.0
- 1% rule +6.4/10.0
- Schools +4.9/10.0
- Livability +3.7/5.0
- Rent growth +3.6/5.0
- Condition / age +2.5/5.0
- Appreciation +0.0/10.0
$229,000
🖨 Deal sheet 📄 Offer letter ✓ Due diligence
Listing remarks
Gated 55+ Living at its Finest! This immaculate, rambler-style manufactured home in desirable Park Lane Court is truly turn-key. Experience a light-filled and open floor plan featuring all-new paint, beautiful laminate flooring, and updated bathrooms. Boasting a new roof, new furnace, new A/C, new gas water heater and new washer and dryer, all major systems are updated for total peace of mind. The chef-inspired kitchen includes granite counters and new high-end stainless appliances that all stay. Retreat to the spacious primary suite or step outside to your private back yard. Exterior highlights include an attached finished two car garage with an insulated door and stunning landscaping. Gar
Key facts
- Rambler style
- Turn-key
- Updated bathrooms
Tags
Property features AI
Finance
- Other: Directions: From 176th St, turn South on 22nd Ave, then right into Park Lane Court. Enter code at first gate and proceed through second gate and turn left. Rd veers to the right. Follow to home on the left.
- Financial info: Listing terms: Cash
- HOA & community: Park Lane Ct with 94 homes; Senior community; Park amenities: clubhouse, common area, exercise room, recreational area, RV parking, security gate; Land lease (park lot rent): $824
Exterior
- Parking: Individual garage; Has garage; RV parking available in the park
- Security: Security gate (park)
- Utilities: Public water; Water billed through park (sewer); Electric and natural gas service; TPU electric company; Water company: WA Water; Xfinity cable and internet
- Home design: Manufactured double-wide home; One level; North-facing; Has a view; Very good condition; Make: KARST, Model: DEVELOPER
- Construction: Wood construction; Composition roof; Slab foundation with tie downs; Manufactured after 6/15/1976; Mobile home remains
- Exterior features: Wood products siding; Awnings; Patio/porch/deck; Landscaped; Paved lot
Interior
- Kitchen: Dishwasher; Garbage disposal; Microwave; Refrigerator; Stove/Range
- Bedrooms: 2 bedrooms
- Flooring: Laminate; Vinyl; Carpet
- Bathrooms: 2 full bathrooms (2 tubs, 2 showers)
- Heating & cooling: Forced air heating; Central air conditioning
- Interior features: Water heater (gas) in closet; Vaulted ceilings; Walk-in closet; Drapes
- Laundry & utility: Washer; Dryer; Utility room
Neighborhood map
What this means for you Summary
Snapshot
- This is a 2-bed/2.0-bath manufactured listed at $229k.
Deal economics
- At list price, monthly cash flow is $574 ($7k/yr) — positive.
- The deal already cash-flows at list — no discount required.
- Meets the 1% rule at list price ($3k rent vs $229k).
- Recommended offer: $202k (12.0% below list) — sets the bar for market timing.
- Cap rate 9.3% vs local median 3.5% in Spanaway — top-decile yield for the area; either an underpriced asset or a hidden risk that comps aren't pricing in. Stress-test before assuming the spread holds.
Location & tenants
- Location reads 74/100 on livability (#184 in WA, #4,891 nationally) — a middle-class / working-renter tenant base. Strengths: housing A+, employment A, commute A-; Watch: cost of living C-, health & safety C-, crime D-.
- Bethel School District (suburban): math 47% / reading 59% proficiency, ranked #103 of 291 in WA (top 35%) — acceptable for families but not a draw, mixed tenant base, ~2y average lease.
- Market conditions: Rents rising fast (+4.2%/yr); 383 active listings in the ZIP; 12 comparable units currently listed for rent nearby; rentals at typical pace (median 24d on market — plan ~3-4 weeks tenant-placement turnaround); solid renter incomes; 3,209 units permitted in Pierce County in 2024 (1,269 in 5+ unit buildings).
Forward outlook
- Local home prices are declining (-3.0%/yr); year-one equity from $2k of loan paydown is wiped out by about $7k of value loss. Plan a longer hold.
- Pierce County population projected at +26% by 2050 — long-run rental-demand tailwind backs the buy-and-hold thesis.
- At projected returns (-3.0% appreciation + 4.2% rent growth), your $64k cash investment doubles in ~9 years — after that, you're playing with house money.
Negotiation context
- It's been on market 135 days — a 12% lower offer ($202k) is reasonable based on typical stale-listing flexibility.
- 2 sale attempts; this cycle's ask has dropped $16k (7%) from the opening price — seller is motivated, your offer sets the floor, not the list.
Questions for the listing agent
- It's been on market 135 days. Have you received any prior offers? Is the seller open to a 12% concession, seller financing, or rate buy-down credit?
- Why hasn't it sold? Are there any deal-killer items the seller is aware of (foundation, flood, title, zoning, code violations)?
- Is there a deadline driving the sale (1031 exchange, divorce, estate, relocation)? That informs how much negotiation room exists.
- Schools are B-rated — typically a magnet for longer-tenancy family renters. What's the average tenant stay here, and is there a school-zone premium baked into asking?
- Crime grade is D in this area — have there been break-ins, vandalism, or insurance claims at this property in the last 3 years? What carrier currently insures it and at what premium?
- What's the average days-on-market for RENTAL listings here right now (not sales)? A rising rental-DOM trend means longer vacancies and softer asking-rent achievability than the comps imply.
- What's the recent tenant-quality profile in this submarket — average credit score on applications, eviction rate, late-payment / NSF rate, and stable-employment percentage? A property-management company in the area should have these aggregated.
- How much new for-sale + rental construction is in the pipeline within 1–3 miles? Heavy new supply typically softens prices + rents 12–24 months out; constrained supply supports both.
Investment metrics
- 1% rule
- 1.14% ✓
- Cap rate
- 9.30%
- Cash-on-cash
- 10.75%
- DSCR
- 1.48
- GRM
- 7.3
CMA / ARV
- ARV (on-the-fly)
- $235,922
- Comps found
- 3
Show comp detail 3 sales within ~0.75 mi
| Address | Dist | Beds/Ba | Sqft | Sold | Price | $/sf | Match |
|---|---|---|---|---|---|---|---|
| 2008 177th Street Ct E | 0.07mi | 2/2.0 | 1,452 (+10%) | 8mo | $259,950 | $179 | 73 |
| 17628 20th Ave E #61 | 0.09mi | 3/2.0 (+1) | 1,396 (+6%) | 20mo | $235,000 | $168 | 65 |
| 2315 172nd St E | 0.47mi | 3/2.0 (+1) | 1,440 (+9%) | 1mo | $450,000 | $313 | 57 |
Match score weights: distance 35% · size 25% · config 20% · recency 20%. Top-matched comps best support the ARV.
Projected returns pro-forma
-3.0% appreciation · 4.24% rent growth · sell at horizon
- IRR
- 1.1%
- Equity multiple
- 1.04×
- Total profit
- $2,760
- Equity at exit
- $34,145
- IRR
- 11.9%
- Equity multiple
- 1.99×
- Total profit
- $63,320
- Equity at exit
- $19,800
Cash invested: $64,120 (down + closing). Projections, not guarantees.
Landlord ↔ Tenant lean methodology
- Overall (STATE)
- 28 Tenant-Leaning
- State Washington
- 28 Tenant-Leaning · D+8
- County
- — inherits STATE
- City
- — inherits STATE
ZIP-level market 98387
- Rents YoY
- 4.2%
- Active inventory
- 383
- Price-to-rent
- 7.3×
Monthly cashflow live
- Estimated rent
- $2,611 high interval (Pro) →
- Mortgage (P&I)
- −$1,201
- Tax from tax record
- −$192 /mo · $2,302/yr
- Insurance
- −$95
- HOA
- −$0
- Vacancy / Maint / Mgmt
- −$548
- Net cashflow
- $574
Break-even live
UW: 25.0% down · 7.5% · 30yr · 1.5% tax · 5.0% vac · 8.0% maint · 8.0% mgmt
Financing live
Cash to close
- Down payment
- $57,250
- Closing costs
- $6,870
- Reserves months
- —
- Total cash needed
- —
Loan-product check · same deal, 3 products live
Conventional
25% down · 7.5% · 30yr
- Down + closing
- —
- Monthly P&I
- —
- Monthly cashflow
- —
- DSCR
- —
- Eligible?
- —
Personal DTI + credit; lowest rate.
DSCR
20% down · 8.5% · 30yr
- Down + closing
- —
- Monthly P&I
- —
- Monthly cashflow
- —
- DSCR
- —
- Eligible?
- —
No personal income docs; deal must DSCR.
Hard money
10% down · 12.0% · 12mo
- Down + closing
- —
- Monthly P&I
- —
- Monthly cashflow
- —
- DSCR
- —
- Eligible?
- —
Short-term bridge; refi at stabilization.
Rent comps 12 comps
| Address | Beds | Baths | Sqft | Rent | $/sqft | DOM | Units | Dist |
|---|---|---|---|---|---|---|---|---|
| 17724 17th Ave E Spanaway, WA | 3.0 | 2.5 | 1761 | $2,550 | $1.45 | 24d | 1 | 0.16mi |
| 17813 22nd Ave E Tacoma, WA | 3.0–4.0 | 2.5 | 1800 | $2,895 | $1.61 | 24d | 1 | 0.20mi |
| 18610 29th Ave E Tacoma, WA | 3.0 | 2.5 | 1384 | $2,750 | $1.99 | 18d | 1 | 0.79mi |
| 619 187th St E Spanaway, WA | 3.0 | 2.0 | 1430 | $2,779 | $1.94 | 24d | 1 | 1.05mi |
| 19316 Twinkle Dr E Spanaway, WA | 3.0 | 1.0 | 975 | $1,975 | $2.03 | 24d | 1 | 1.16mi |
| 15909 18th Avenue Ct E Tacoma, WA | 2.0 | 1.5 | 1050 | $2,050 | $1.95 | 24d | 1 | 1.21mi |
| 17121 B St E Spanaway, WA | 2.0 | 1.0 | 1000 | $2,400 | $2.40 | 24d | 1 | 1.24mi |
| 16007 29th Avenue Ct E Unit 16007 Tacoma, WA | 3.0 | 2.5 | 1510 | $2,550 | $1.69 | 24d | 1 | 1.29mi |
| 19906 18th Avenue Ct E Spanaway, WA | 3.0 | 2.5 | 1393 | $2,800 | $2.01 | 18d | 1 | 1.30mi |
| 19606 9th Avenue Ct E Spanaway, WA | 2.0 | 1.5 | 1026 | $2,000 | $1.95 | 5d | 1 | 1.37mi |
| 814 196th St E Spanaway, WA | 2.0 | 1.5 | 1026 | $2,095 | $2.04 | 24d | 1 | 1.40mi |
| 17412 44th Ave E Tacoma, WA | 1.0–3.0 | 1.0–2.5 | 1012 | $2,108 | $2.08 | 2d | 18 | 1.42mi |
Listing history 19 events
-
2026-06-18days on market $229,000 Active 135 DOM
-
2026-06-17days on market $229,000 Active 134 DOM
-
2026-06-16days on market $229,000 Active 133 DOM
-
2026-06-15pricedays on market $229,000 Active 132 DOM
-
2026-06-13days on market $234,950 Active 130 DOM
-
2026-06-13days on market $234,950 Active 129 DOM
-
2026-06-09days on market $234,950 Active 126 DOM
-
2026-06-08days on market $234,950 Active 125 DOM
-
2026-06-07days on market $234,950 Active 124 DOM
-
2026-06-04days on market $234,950 Active 121 DOM
-
2026-06-03days on market $234,950 Active 120 DOM
-
2026-06-02days on market $234,950 Active 119 DOM
-
2026-06-01days on market $234,950 Active 118 DOM
-
2026-05-31days on market $234,950 Active 117 DOM
-
2026-05-07price $234,950
-
2026-05-04status Active
-
2026-05-04historical
-
2026-03-08price $239,950
-
2026-02-03$245,000 Active
ⓘ Source: listings_history table (triggers on properties + properties_extension) + one-shot
backfill from property_details.listing_events for pre-trigger history.
Tax reassessment forecast WA · Resets to sale price
- Current annual tax
- $2,302 · $192/mo
- Projected year-2 tax
- $2,302 · $192/mo
- Expected delta
- $0/yr ($0/mo · 0.0%)
ⓘ Screening estimate from a state-policy table — verify with the county assessor before closing.
Climate risk First Street
- Flood 1/10 Low FEMA zone X (unshaded) · 0% chance over 30 yrs
- Wildfire 2/10 Low
- Heat 3/10 Moderate 7 d/yr ≥87°F today · 15 d/yr by 30 yrs out
- Wind 1/10 Low
- Air quality 7/10 Severe 9 unhealthy d/yr today · 10 by 30 yrs out
Nearby sold comps map
Loading sold comps map…
Walkable amenities ~0.75 mi
Loading nearby amenities…
Taxation est. · year 1
- Rental income
- $31,332
- − Mortgage interest
- −$12,828
- − Property taxes
- −$2,302
- − Insurance
- −$1,145
- − Repairs & maintenance
- −$2,507
- − Management
- −$2,507
- − Depreciation
- −$6,662
- Taxable income
- $3,382
- Est. tax owed @ 24.0%
- −$812
- After-tax cash flow
- $6,082/yr
For passive investors: Depreciation is non-cash, so a rental often shows a tax loss while cash-flowing — sheltering income. Rental losses are passive: they offset passive income freely, and up to $25,000/yr can offset ordinary (W-2) income if you actively participate and your MAGI is under $100k (phasing out to $0 by $150k); unused losses carry forward. On sale, claimed depreciation is recaptured at up to 25%, and gains may owe capital-gains tax (a 1031 exchange can defer both). Figures are a year-1 estimate at your 24.0% rate — not tax advice; consult a CPA.
Schools (NCES district)
- District
- Bethel School District
- NCES district ID
- 5300480
- Math proficiency
- 47% ▬ 0.00%
- Reading proficiency
- 59% ▲ 2.00%
- Median HH income
- $65,872
- Composite
- 48.66/100
- National rank
- #4568
- State rank
- #103 of 291 in WA
Livability — Spanaway
- Score
- 74/100
- State rank
- #184
- US rank
- #4891
Category grades
Schools grade is shown separately in the Schools card above.
Census & demographics
- Census place
- Spanaway, WA
- County
- Pierce County · 788,257 people
- City population
- 50,774
- Metro
- Seattle-Tacoma-Bellevue, WA
- Population (ZIP)
- 50,774
- Household income
- $106,872
- Rent vs Own
- Severe rent burden
- 807.0
Population outlook (Pierce County) Hauer SSP2
- Today (2025)
- 956,648 people
- By 2030
- 1,010,862 · +5.7%
- By 2040
- 1,113,170 · +16.4%
- By 2050
- 1,206,524 · +26.1%
- By 2075
- 1,436,425 · +50.2%
- By 2100
- 1,563,654 · +63.5%
Race, ethnicity, and origin ACS 2023
- Neighborhood character
- Diverse neighborhood (Simpson 0.68)
- Race & ethnicity
- White 53% Two or more races 18% Hispanic / Latino 16% Black 10% Asian 6% Pacific Islander 4%
- Hispanic origin (detail)
- Mexican 10% Puerto Rican 2%
- Common ancestry
- Portuguese 3% Italian 3% Slovak 2%
- Foreign-born
- 11% · Canada, South Korea
- Languages at home
- 82% English-only · Spanish 7% Russian/Polish/Slavic 2% Other Asian/Pacific 2%
Political lean MEDSL · Pierce
- 2024 margin
- D (+10.8) · D 53.9% · R 43.1% · Other 3.0%
- 2008→2024 swing
- -1.4pp toward R · 2008: 12.2pp · 2024: 10.8pp
- All cycles
- 2024: D+10.8 2020: D+11.2 2016: D+7.5 2012: D+11.0 2008: D+12.2
Not yet ingested
- Civics
- —
Market trends
- HPI YoY
- ▼ -208.94%
- Current HPI
- 308.0462
- Rent YoY
- ▲ 4.24%
- Metro
- Seattle-Tacoma-Bellevue, WA
- State GDP YoY
- ▲ 4.65%
- F500 in state
- 22
Industry mix (Fortune 500 HQ in WA)
| Industry | F500 HQs | Revenue |
|---|---|---|
| Retail | 2 | $269B |
|
||
| Technology / Retail | 1 | $638B |
|
||
| Technology | 1 | $245B |
|
||
| Telecommunications | 1 | $38B |
|
||
| Food / Beverage | 1 | $36B |
|
||
| Automotive / Trucks | 1 | $34B |
|
||
Price history
-4.1% since first listed5 events — show timeline
- 2026-05-07 Price Changed $234,950 NWMLS as Distributed by MLS Grid
- 2026-05-04 Relisted — NWMLS as Distributed by MLS Grid
- 2026-05-04 Delisted — NWMLS as Distributed by MLS Grid
- 2026-03-08 Price Changed $239,950 NWMLS as Distributed by MLS Grid
- 2026-02-03 Listed $245,000 NWMLS as Distributed by MLS Grid
Property tax history
+2.2%/yrLatest (2026): $2,302 · -3.3% YoY. Source: county tax records.
Cash-flow waterfall
monthlySold comps — $/sqft
last 12 mo · ≤1 miLoading sold comps…