22616 S Remington Dr #186 · Channahon, IL
Flood risk No data
- FEMA flood zone
- —
- Chance of flooding over 30 yrs
- —
- Est. flood insurance / yr
- —
Fire risk No data
- Est. fire insurance / yr
- —
Heat risk No data
- Hot days now (above threshold)
- —
- Hot days in 30 yrs
- —
Wind risk No data
- Chance of severe wind over 30 yrs
- —
Air-quality risk No data
- Unhealthy air days now
- —
- Unhealthy air days in 30 yrs
- —
Risk factors via First Street. Map © Google.
Why this score? — see what drove the B grade
The composite is a weighted blend of 9 inputs, each scored 0–100. Each bar is that input's sub-score; the figure is the points it added to the 100-point composite (weight × sub-score).
- Cash flow +30.0/30.0
- 1% rule +10.0/10.0
- DSCR +10.0/10.0
- ARV discount +7.5/15.0
- Condition / age +4.8/5.0
- Livability +3.9/5.0
- Schools +3.1/10.0
- Rent growth +2.5/5.0
- Appreciation +1.2/10.0
$135,000
🖨 Deal sheet 📄 Offer letter ✓ Due diligence
Listing remarks
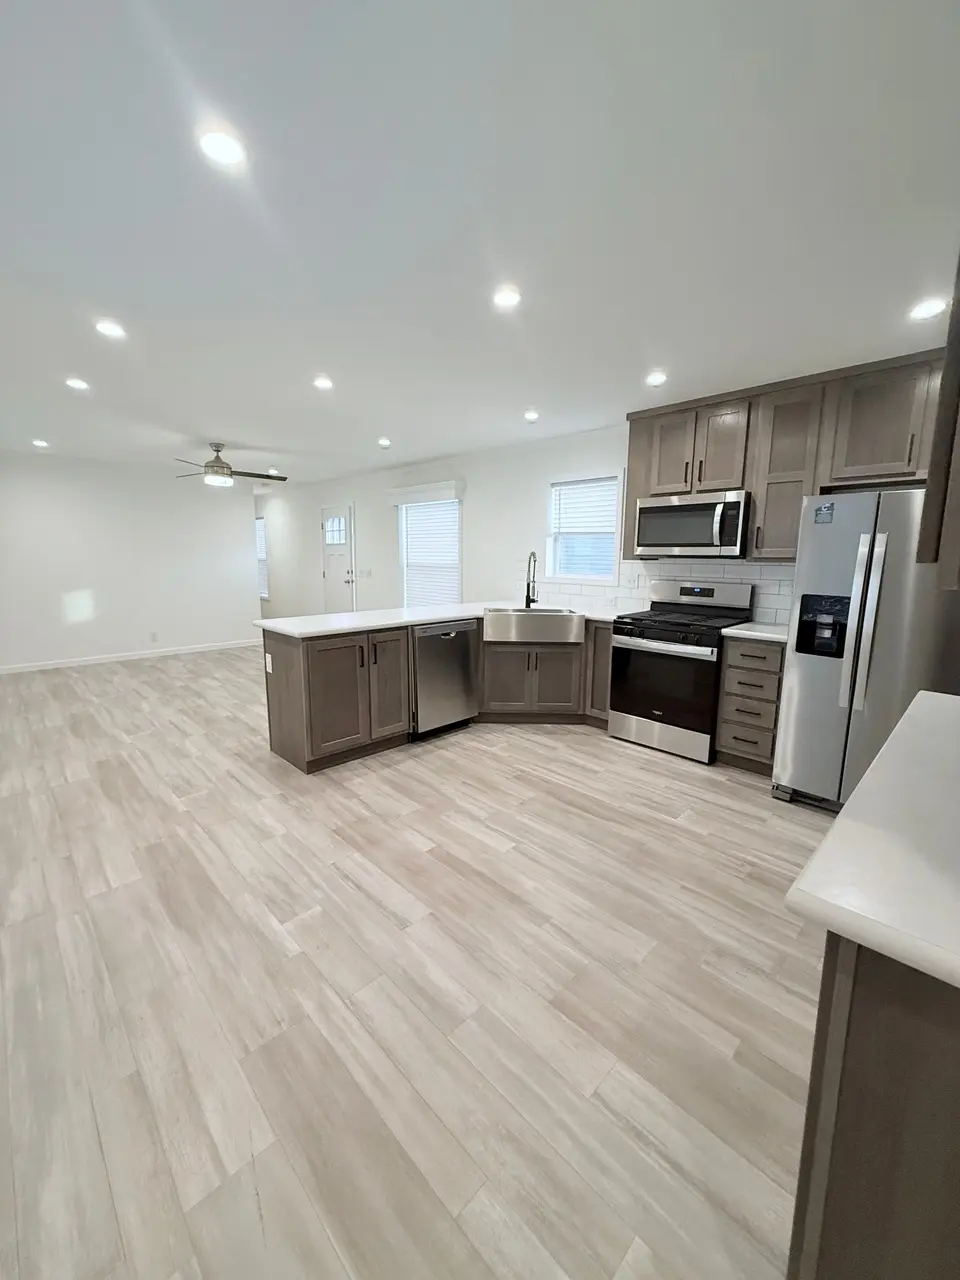
Welcome to * * 22616 S Remington Dr in Remington Woods * * , a beautifully designed * * 2026 Dutch Aspire * * home offering elegant comfort in one of Channahon's most peaceful 55+ communities. This * * 3 bedroom, 2 bathroom * * home sits on a desirable * * wooded lot * * with space to add a future * * 14x24 garage * * , giving you the privacy, storage, and lifestyle flexibility buyers are looking for. Inside, the home features a bright open layout, upgraded cabinetry, a stylish kitchen with stainless appliances, a stainless farmhouse sink, gas range, dishwasher, microwave, and refrigerator. The primary suite includes a beautiful upgraded shower with a ceramic surround and
Key facts
- Wooded lot
- Energy star home
- 7-year warranty
Tags
Property features AI
Finance
- Financial info: List price: $135,000
Exterior
- Utilities: Electric and natural gas available; Forced air heating; Central air conditioning
- Home design: Single-level manufactured/home plan: Remington Woods; Spec inventory
- Exterior features: Asphalt roof
Interior
- Kitchen: Includes dishwasher, microwave, and refrigerator
- Bedrooms: 3 bedrooms
- Bathrooms: 2 full bathrooms
- Heating & cooling: Forced air heating (electric and natural gas); Central air conditioning; Ceiling fans
- Interior features: Dishwasher, Microwave, Refrigerator
Neighborhood map
What this means for you Summary
Snapshot
- This is a 3-bed/2.0-bath manufactured listed at $135k. Condition is rated excellent.
Deal economics
- At list price, monthly cash flow is $805 ($10k/yr) — positive.
- The deal already cash-flows at list — no discount required.
- Meets the 1% rule at list price ($2k rent vs $135k).
- Cap rate 13.4% vs local median 2.4% in Channahon — top-decile yield for the area; either an underpriced asset or a hidden risk that comps aren't pricing in. Stress-test before assuming the spread holds.
Location & tenants
- Location reads 78/100 on livability (#143 in IL, #2,614 nationally) — a middle-class / working-renter tenant base. Strengths: crime A+, employment A+, housing A+; Watch: amenities F, commute F.
- Minooka Chsd 111 (suburban): math 28% / reading 36% proficiency, ranked #187 of 620 in IL (top 30%) — families likely to look elsewhere, expect single-tenant / working-renter base with shorter leases.
- Market conditions: 103 active listings in the ZIP; 1 comparable units currently listed for rent nearby; 2,028 units permitted in Will County in 2024 (530 in 5+ unit buildings).
Forward outlook
- Local home prices are declining (-3.0%/yr); year-one equity from $933 of loan paydown is wiped out by about $4k of value loss. Plan a longer hold.
- Will County population projected to shrink 4% by 2050 — rents likely to lag national; underwrite the cash flow, not the appreciation.
- At projected returns (-3.0% appreciation + 3.0% rent growth), your $38k cash investment doubles in ~5 years — after that, you're playing with house money.
Negotiation context
- Only 7 days on market — expect competitive offers; lowballing is unlikely to land.
Questions for the listing agent
- Is there a deadline driving the sale (1031 exchange, divorce, estate, relocation)? That informs how much negotiation room exists.
- What's the average days-on-market for RENTAL listings here right now (not sales)? A rising rental-DOM trend means longer vacancies and softer asking-rent achievability than the comps imply.
- What's the recent tenant-quality profile in this submarket — average credit score on applications, eviction rate, late-payment / NSF rate, and stable-employment percentage? A property-management company in the area should have these aggregated.
- How much new for-sale + rental construction is in the pipeline within 1–3 miles? Heavy new supply typically softens prices + rents 12–24 months out; constrained supply supports both.
Investment metrics
- 1% rule
- 1.63% ✓
- Cap rate
- 13.45%
- Cash-on-cash
- 25.56%
- DSCR
- 2.14
- GRM
- 5.1
CMA / ARV
No comps found within radius.
Projected returns pro-forma
-3.0% appreciation · 3.0% rent growth · sell at horizon
- IRR
- 19.2%
- Equity multiple
- 1.78×
- Total profit
- $29,431
- Equity at exit
- $20,129
- IRR
- 27.5%
- Equity multiple
- 3.43×
- Total profit
- $91,786
- Equity at exit
- $11,672
Cash invested: $37,800 (down + closing). Projections, not guarantees.
Landlord ↔ Tenant lean methodology
- Overall (STATE)
- 43 Moderately Tenant-Leaning
- State Illinois
- 43 Moderately Tenant-Leaning · D+7
- County
- — inherits STATE
- City
- — inherits STATE
ZIP-level market 60410
- Home prices YoY
- -3.2%
- Active inventory
- 103
- Price-to-rent
- 5.1×
Monthly cashflow live
- Estimated rent
- $2,200 medium interval (Pro) →
- Mortgage (P&I)
- −$708
- Tax est. 1.5%
- −$169 /mo · $2,025/yr
- Insurance
- −$56
- HOA
- −$0
- Vacancy / Maint / Mgmt
- −$462
- Net cashflow
- $805
Break-even live
UW: 25.0% down · 7.5% · 30yr · 1.5% tax · 5.0% vac · 8.0% maint · 8.0% mgmt
Financing live
Cash to close
- Down payment
- $33,750
- Closing costs
- $4,050
- Reserves months
- —
- Total cash needed
- —
Loan-product check · same deal, 3 products live
Conventional
25% down · 7.5% · 30yr
- Down + closing
- —
- Monthly P&I
- —
- Monthly cashflow
- —
- DSCR
- —
- Eligible?
- —
Personal DTI + credit; lowest rate.
DSCR
20% down · 8.5% · 30yr
- Down + closing
- —
- Monthly P&I
- —
- Monthly cashflow
- —
- DSCR
- —
- Eligible?
- —
No personal income docs; deal must DSCR.
Hard money
10% down · 12.0% · 12mo
- Down + closing
- —
- Monthly P&I
- —
- Monthly cashflow
- —
- DSCR
- —
- Eligible?
- —
Short-term bridge; refi at stabilization.
Rent comps 1 comps
| Address | Beds | Baths | Sqft | Rent | $/sqft | DOM | Units | Dist |
|---|---|---|---|---|---|---|---|---|
| 22451 S Carrie Ave Channahon, IL | 3.0 | 1.0 | 1176 | $2,200 | $1.87 | 7d | 1 | 0.94mi |
Listing history 4 events
-
2026-06-03days on market $135,000 Active 7 DOM
-
2026-06-02days on market $135,000 Active 6 DOM
-
2026-06-01days on market $135,000 Active 5 DOM
-
2026-05-31days on market $135,000 Active 4 DOM
ⓘ Source: listings_history table (triggers on properties + properties_extension) + one-shot
backfill from property_details.listing_events for pre-trigger history.
Nearby sold comps map
Loading sold comps map…
Walkable amenities ~0.75 mi
Loading nearby amenities…
Taxation est. · year 1
- Rental income
- $26,400
- − Mortgage interest
- −$7,562
- − Property taxes
- −$2,025
- − Insurance
- −$675
- − Repairs & maintenance
- −$2,112
- − Management
- −$2,112
- − Depreciation
- −$3,927
- Taxable income
- $7,987
- Est. tax owed @ 24.0%
- −$1,917
- After-tax cash flow
- $7,744/yr
For passive investors: Depreciation is non-cash, so a rental often shows a tax loss while cash-flowing — sheltering income. Rental losses are passive: they offset passive income freely, and up to $25,000/yr can offset ordinary (W-2) income if you actively participate and your MAGI is under $100k (phasing out to $0 by $150k); unused losses carry forward. On sale, claimed depreciation is recaptured at up to 25%, and gains may owe capital-gains tax (a 1031 exchange can defer both). Figures are a year-1 estimate at your 24.0% rate — not tax advice; consult a CPA.
Condition & rehab AI · 13 photos
This home is in excellent condition with a bright and open layout, upgraded kitchen and bathrooms, and a well-maintained exterior. Landscaping and curb appeal improvements would further enhance its value.
Value-add opportunities
- Both Landscaping and curb appeal — Enhancing the landscaping and curb appeal can attract more buyers and renters, improving both resale and rental value.
Renovation cost estimate screening
Value-add ROI direction
- Both Landscaping and curb appeal — Enhancing the landscaping and curb appeal can attract more buyers and renters, improving both resale and rental value. ↑
ⓘ Cost ranges are severity-bucket heuristics (US national rule-of-thumb). Get contractor quotes + a written scope before underwriting a rehab budget.
Schools (NCES district)
- District
- Minooka Chsd 111
- NCES district ID
- 1726340
- Math proficiency
- 28% ▼ -8.00%
- Reading proficiency
- 36% ▼ -7.00%
- Median HH income
- $81,260
- Composite
- 30.82/100
- National rank
- #6138
- State rank
- #187 of 620 in IL
Livability — Channahon
- Score
- 78/100
- State rank
- #143
- US rank
- #2614
Category grades
Schools grade is shown separately in the Schools card above.
Census & demographics
- Census place
- Channahon, IL
- City population
- 14,027
- Population (ZIP)
- 14,027
Population outlook (Will County) Hauer SSP2
- Today (2025)
- 705,368 people
- By 2030
- 708,154 · +0.4%
- By 2040
- 702,692 · -0.4%
- By 2050
- 680,249 · -3.6%
- By 2075
- 611,990 · -13.2%
- By 2100
- 516,215 · -26.8%
Race, ethnicity, and origin ACS 2023
- Neighborhood character
- Predominantly White (82%)
- Race & ethnicity
- White 82% Hispanic / Latino 14% Two or more races 5%
- Hispanic origin (detail)
- Mexican 7% Puerto Rican 4% Cuban 2%
- Common ancestry
- Romanian 10% Lithuanian 2% Iranian 2%
- Foreign-born
- 3% · Canada
- Languages at home
- 94% English-only · Spanish 5% Other Indo-European 1%
Political lean MEDSL · Will
- 2024 margin
- Toss-up / Even · D 50.1% · R 48.5% · Other 1.4%
- 2008→2024 swing
- -11.6pp toward R · 2008: 13.2pp · 2024: 1.6pp
- All cycles
- 2024: D+1.6 2020: D+8.3 2016: D+5.7 2012: D+3.7 2008: D+13.2
Not yet ingested
- Civics
- —
Market trends
- HPI YoY
- ▼ -7.58%
- Current HPI
- 227.2488
- Rent YoY
- —
- Metro
- —
- State GDP YoY
- ▲ 1.59%
- F500 in state
- 60
Industry mix (Fortune 500 HQ in IL)
| Industry | F500 HQs | Revenue |
|---|---|---|
| Insurance | 4 | $201B |
|
||
| Consumer Goods | 4 | $87B |
|
||
| Industrial Machinery | 3 | $64B |
|
||
| Healthcare | 2 | $55B |
|
||
| Retail / Pharmacy | 1 | $148B |
|
||
| Agriculture / Food | 1 | $86B |
|
||
Cash-flow waterfall
monthlySold comps — $/sqft
last 12 mo · ≤1 miLoading sold comps…