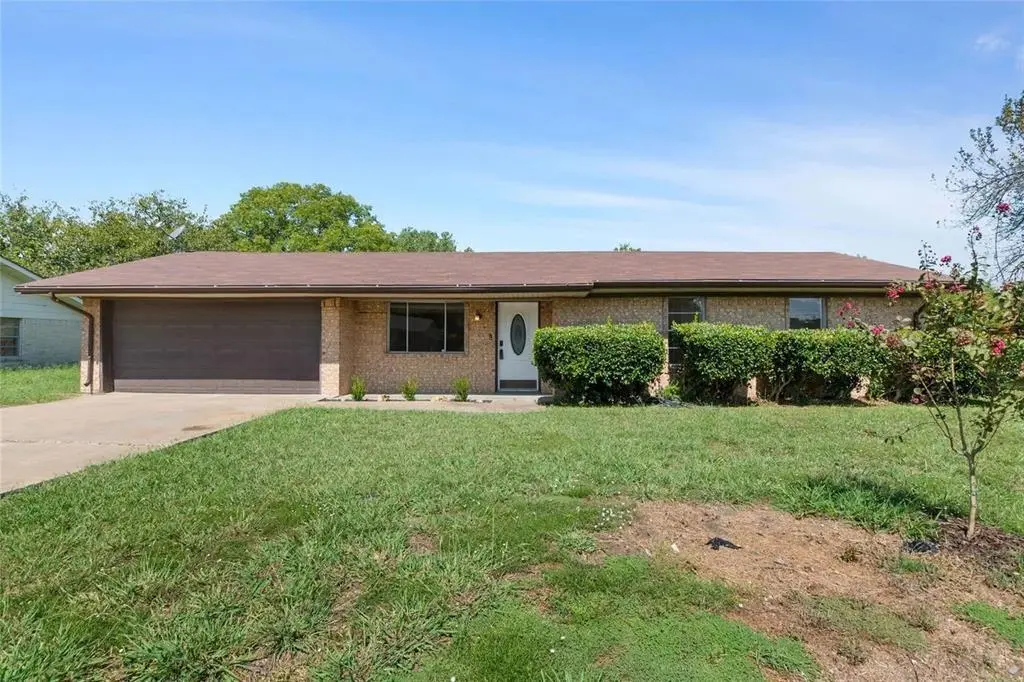
500 Bonnie View Dr · Princeton, TX
Flood risk 1/10 · Minimal
- FEMA flood zone
- X (unshaded)
- Chance of flooding over 30 yrs
- 0.0%
- Est. flood insurance / yr
- $507 – $1,088
Fire risk 5/10 · Moderate
- Est. fire insurance / yr
- $1,222 – $2,270
Heat risk 7/10 · Major
- Hot days now (above 110°F)
- 7 days/yr
- Hot days in 30 yrs
- 23 days/yr
Wind risk 6/10 · Moderate
- Chance of severe wind over 30 yrs
- 27.0%
Air-quality risk 3/10 · Minor
- Unhealthy air days now
- 3 days/yr
- Unhealthy air days in 30 yrs
- 3 days/yr
Risk factors via First Street. Map © Google.
Why this score? — see what drove the D grade
The composite is a weighted blend of 9 inputs, each scored 0–100. Each bar is that input's sub-score; the figure is the points it added to the 100-point composite (weight × sub-score).
- ARV discount +14.0/15.0
- Cash flow +11.0/30.0
- Schools +4.2/10.0
- 1% rule +3.4/10.0
- DSCR +3.2/10.0
- Livability +3.1/5.0
- Condition / age +2.5/5.0
- Rent growth +2.2/5.0
- Appreciation +0.0/10.0
$209,000
🖨 Deal sheet (PDF) 📄 Offer letter ✓ Due diligence
Listing remarks MLS
This three-bedroom, one-and-a-half-bathroom house sits on approximately 0.3 acres of land. The home offers approximately 1,021 square feet of living space. The updated kitchen features modern appliances and cabinetry, providing ample storage and preparation space. The updated bathroom includes contemporary fixtures and finishes, creating a comfortable and functional space. The large lot allows for ample outdoor space and potential for landscaping or other enhancements. The property's location and size may appeal to those seeking additional living or recreation areas.
Key facts
- Spacious lot
- Updated bathroom
- Shopping and dining
Tags
Property features AI
Finance
- Other: Directions to property available; Listing is active and for sale
- Financial info: Loan type: Treat As Clear; No second mortgage
- HOA & community: No homeowners association
Exterior
- Parking: Attached garage (1 car); One covered parking space; No carport spaces
- Security: No specific security features provided
- Utilities: City water; City sewer; Not in a municipal utility district
- Home design: Single-family residence; Residential property; One-story home; Built in 1975; Entry level and facing direction not specified
- Construction: Slab foundation; Roof: Other
- Exterior features: Lot in Princeton Estates Subdivision; Lot under 0.5 acre (about 0.29 acres)
Interior
- Kitchen: Kitchen approximately 14 x 15; Appliances: Other
- Bedrooms: Three bedrooms (all on the first floor); Primary bedroom approximately 12 x 12; Two additional bedrooms approximately 10 x 10
- Flooring: No flooring details provided
- Bathrooms: One full bathroom (primary) approximately 8 x 9; One half bathroom approximately 7 x 6; Two total bathrooms (1 full, 1 half)
- Heating & cooling: Central heating (electric); Central air conditioning (electric)
- Interior features: Seven total rooms; One living area; One-level layout; Brick fireplace
- Laundry & utility: No specific laundry or utility details provided
Neighborhood map
What this means for you Summary
Snapshot
- This is a 2-bed/1.0-bath single-family listed at $209k.
Deal economics
- At list price, monthly cash flow is $-89 ($-1k/yr) — negative.
- To cash-flow at today's rent, offer at most $193k (7.5% below list).
- To meet the 1% rule (rent ≥ 1% of price), the offer needs to be $175k (16.4% below list).
- Recommended offer: $175k (16.4% below list) — sets the bar for 1% rule.
- Cap rate 5.8% vs local median 4.5% in Princeton — meaningfully above typical; check what's discounted (condition, days-on-market, listing class) to confirm the premium yield is real.
Location & tenants
- Location reads 62/100 on livability (#969 in TX) — a middle-class / working-renter tenant base. Strengths: employment A+, housing A+, cost of living A; Watch: amenities F, commute F, health & safety F.
- Princeton ISD (suburban): math 51% / reading 47% proficiency, ranked #188 of 826 in TX (top 23%) — families likely to look elsewhere, expect single-tenant / working-renter base with shorter leases.
- Zoned schools: Godwin El (math 33% / reading 35%, grade F, #2,149 of 4,322 statewide, top 50%, 587 students, 65% FRL); Clark Middle (math 53% / reading 42%, grade C-, #408 of 1,662 statewide, top 25%, 707 students, 66% FRL); Princeton H S (math 52% / reading 54%, grade C-, #437 of 1,632 statewide, top 27%, 1,521 students, 57% FRL).
- Market conditions: Rents soft (-1.0%/yr); 1410 active listings in the ZIP; 40 comparable units currently listed for rent nearby; rentals at typical pace (median 26d on market — plan ~3-4 weeks tenant-placement turnaround); 40% of comp listings sitting > 30 days — soft ceiling on asking rent; solid renter incomes; 19,194 units permitted in Collin County in 2024 (3,988 in 5+ unit buildings).
Forward outlook
- Local home prices are declining (-3.0%/yr); year-one equity from $1k of loan paydown is wiped out by about $6k of value loss. Plan a longer hold.
- Collin County population projected at +60% by 2050 — long-run rental-demand tailwind backs the buy-and-hold thesis.
Negotiation context
- It's been on market 59 days — a 3% lower offer ($203k) is reasonable based on typical stale-listing flexibility.
- 6 sale attempts since 21y ago with the ask held roughly flat each time — persistent listings suggest the price (not the market) is what's stuck; bring a comps-based counter.
Risks & watch-outs
- Climate carrying-cost: major wind risk, 27% chance of damaging wind over 30y; moderate wildfire risk; extreme-heat days projected 7→23/yr by 2055 (HVAC capex compounding) — expect insurance premiums to compound above CPI over the hold.
Questions for the listing agent
- What do current leases actually rent for vs. the listed asking? Can we see a recent rent roll and the last 12 months of T-12 income?
- It's been on market 59 days. Have you received any prior offers? Is the seller open to a 16% concession, seller financing, or rate buy-down credit?
- Built in 1975 — when were the roof, HVAC, electrical panel, plumbing, and water heater last replaced?
- Is there a deadline driving the sale (1031 exchange, divorce, estate, relocation)? That informs how much negotiation room exists.
- The area grade is low — what's the realistic commute time and amenity access for the typical tenant pool here? Any planned neighborhood developments (good or bad) we should know about?
- What's the average days-on-market for RENTAL listings here right now (not sales)? A rising rental-DOM trend means longer vacancies and softer asking-rent achievability than the comps imply.
- What's the recent tenant-quality profile in this submarket — average credit score on applications, eviction rate, late-payment / NSF rate, and stable-employment percentage? A property-management company in the area should have these aggregated.
- How much new for-sale + rental construction is in the pipeline within 1–3 miles? Heavy new supply typically softens prices + rents 12–24 months out; constrained supply supports both.
Investment metrics
- 1% rule
- 0.84% ✗
- Cap rate
- 5.78%
- Cash-on-cash
- -1.83%
- DSCR
- 0.92
- GRM
- 10.0
CMA / ARV
- ARV (median comp)
- $244,237
- List price
- $209,000
- Delta
- -14.43%
- Verdict
- UNDERPRICED
- Comps
- 20 within 1.0 mi
Show comp detail 8 sales within ~0.75 mi
| Address | Dist | Beds/Ba | Sqft | Sold | Price | $/sf | Match |
|---|---|---|---|---|---|---|---|
| 204 E Willow Ln | 0.22mi | 3/1.5 (+1) | 1,066 (+4%) | 10mo | $241,900 | $227 | 67 |
| 815 Wilson Dr | 0.50mi | 3/1.5 (+1) | 1,048 (+3%) | 3mo | $150,000 | $143 | 63 |
| 806 Mckinney Ave | 0.37mi | 3/2.0 (+1) | 1,013 (-1%) | 12mo | $245,000 | $242 | 62 |
| 413 N 2nd St | 0.50mi | 2/2.0 | 1,100 (+8%) | 7mo | $215,000 | $195 | 54 |
| 413 E College St | 0.18mi | 3/2.0 (+1) | 1,120 (+10%) | 18mo | $239,000 | $213 | 51 |
| 422 Bois D Arc Ave | 0.64mi | 2/1.0 | 900 (-12%) | 2mo | $175,000 | $194 | 49 |
| 1004 Weiss Ave | 0.30mi | 3/1.0 (+1) | 1,114 (+9%) | 21mo | $185,000 | $166 | 48 |
| 806 Dalton Dr | 0.55mi | 3/1.5 (+1) | 1,118 (+10%) | 6mo | $154,000 | $138 | 46 |
Match score weights: distance 35% · size 25% · config 20% · recency 20%. Top-matched comps best support the ARV.
Projected returns pro-forma
-3.0% appreciation · 0.0% rent growth · sell at horizon
- IRR
- -22.8%
- Equity multiple
- 0.24×
- Total profit
- $-44,624
- Equity at exit
- $31,163
- IRR
- -27.8%
- Equity multiple
- -0.12×
- Total profit
- $-65,793
- Equity at exit
- $18,071
Cash invested: $58,520 (down + closing). Projections, not guarantees.
Landlord ↔ Tenant lean methodology
- Overall (STATE)
- 87 Strongly Landlord-Friendly
- State Texas
- 87 Strongly Landlord-Friendly · R+5
- County
- — inherits STATE
- City
- — inherits STATE
ZIP-level market 75407
- Home prices YoY
- -30.3%
- Rents YoY
- -1.0%
- Active inventory
- 1410
- Price-to-rent
- 10.0×
Monthly cashflow live
- Estimated rent
- $1,748 high interval (Pro) →
- Mortgage (P&I)
- −$1,096
- Tax from tax record
- −$287 /mo · $3,443/yr
- Insurance
- −$87
- HOA
- −$0
- Vacancy / Maint / Mgmt
- −$367
- Net cashflow
- $-89
Break-even live
Sensitivity live
| Price | -10% $29 | -5% $-30 | +0% $-89 | +5% $-148 | +10% $-207 |
|---|---|---|---|---|---|
| Rent | -10% $-227 | -5% $-158 | +0% $-89 | +5% $-20 | +10% $49 |
| Rate | -1.0pp $16 | -0.5pp $-36 | base $-89 | +0.5pp $-143 | +1.0pp $-198 |
UW: 25.0% down · 7.5% · 30yr · 1.5% tax · 5.0% vac · 8.0% maint · 8.0% mgmt
Financing live
Cash to close
- Down payment
- $52,250
- Closing costs
- $6,270
- Reserves months
- —
- Total cash needed
- —
Loan-product check · same deal, 3 products live
Conventional
25% down · 7.5% · 30yr
- Down + closing
- —
- Monthly P&I
- —
- Monthly cashflow
- —
- DSCR
- —
- Eligible?
- —
Personal DTI + credit; lowest rate.
DSCR
20% down · 8.5% · 30yr
- Down + closing
- —
- Monthly P&I
- —
- Monthly cashflow
- —
- DSCR
- —
- Eligible?
- —
No personal income docs; deal must DSCR.
Hard money
10% down · 12.0% · 12mo
- Down + closing
- —
- Monthly P&I
- —
- Monthly cashflow
- —
- DSCR
- —
- Eligible?
- —
Short-term bridge; refi at stabilization.
Rent comps 40 comps
| Address | Beds | Baths | Sqft | Rent | $/sqft | DOM | Units | Dist |
|---|---|---|---|---|---|---|---|---|
| 1008 N 4th St Princeton, TX | 3.0 | 2.0 | 1245 | $1,761 | $1.41 | 0d | 1 | 0.13mi |
| 604 Princeton Hts Princeton, TX | 3.0–5.0 | 2.0–2.5 | 1882 | $2,045 | $1.09 | 0d | 1 | 0.16mi |
| 1001 Weiss Ave Princeton, TX | 3.0 | 2.0 | 1209 | $1,595 | $1.32 | 45d | 1 | 0.33mi |
| 1106 Princeton Hts Princeton, TX | 3.0 | 2.0 | 1399 | $1,795 | $1.28 | 3d | 1 | 0.38mi |
| 600 Jefferson Ave Princeton, TX | 3.0 | 2.0 | 1300 | $1,800 | $1.38 | 20d | 1 | 0.40mi |
| 1605 Fox DR Princeton, TX | 3.0 | 2.0 | 1435 | $2,208 | $1.54 | 0d | 11 | 0.42mi |
| 1106 Parkway Trl Princeton, TX | 3.0 | 2.5 | 1404 | $1,500 | $1.07 | 45d | 1 | 0.42mi |
| 1211 Princeton Hts Princeton, TX | 3.0 | 2.0 | 1401 | $1,995 | $1.42 | 45d | 1 | 0.46mi |
| 1211 Princeton Hts Princeton, TX | 3.0 | 2.0 | 1401 | $1,770 | $1.26 | 19d | 1 | 0.46mi |
| 114 Prairie Creek Cir Princeton, TX | 3.0 | 1.0 | 1043 | $1,550 | $1.49 | 45d | 1 | 0.47mi |
| 1105 Butler Ave Princeton, TX | 3.0 | 2.0 | 1399 | $1,749 | $1.25 | 18d | 1 | 0.52mi |
| 724 Prairie Creek Dr Princeton, TX | 2.0 | 1.0 | 914 | $1,250 | $1.37 | 45d | 1 | 0.53mi |
| 742 Prairie Creek Dr Princeton, TX | 2.0 | 1.0 | 935 | $1,350 | $1.44 | 14d | 1 | 0.54mi |
| 1710 Washington St Princeton, TX | 3.0 | 2.0 | 1437 | $1,770 | $1.23 | 3d | 1 | 0.56mi |
| 228 N 4th St Princeton, TX | 3.0 | 2.0 | 1466 | $1,450 | $0.99 | 45d | 1 | 0.59mi |
| 1805 Washington St Princeton, TX | 3.0 | 2.0 | 1437 | $1,775 | $1.24 | 45d | 1 | 0.59mi |
| 617 Delaware Ave Princeton, TX | 3.0 | 2.0 | 1407 | $1,749 | $1.24 | 7d | 1 | 0.61mi |
| 1650 Palladio Loop Unit 1 Princeton, TX | 1.0 | 1.5 | 852 | $900 | $1.06 | 26d | 1 | 0.66mi |
| 1819 Chapel Hill Rd Princeton, TX | 3.0 | 2.0 | 1437 | $1,700 | $1.18 | 45d | 1 | 0.67mi |
| 100 E Brown St Princeton, TX | 3.0 | 1.0 | 1196 | $2,870 | $2.40 | 3d | 1 | 0.69mi |
| 410 Forest St Princeton, TX | 3.0 | 2.0 | 1412 | $1,800 | $1.27 | 9d | 1 | 0.73mi |
| 133 S 4th St Princeton, TX | 2.0 | 1.0 | 850 | $1,253 | $1.47 | 45d | 2 | 0.86mi |
| 325 Allenwood Dr Princeton, TX | 3.0 | 1.5 | 1008 | $1,900 | $1.88 | 45d | 1 | 0.88mi |
| 414 E Hazelwood St Princeton, TX | 3.0 | 2.0 | 1328 | $1,595 | $1.20 | 26d | 1 | 0.91mi |
| 512 E Hazelwood St Unit A Princeton, TX | 3.0 | 2.0 | 1295 | $1,349 | $1.04 | 45d | 1 | 0.92mi |
| 502 E Hazelwood St Princeton, TX | 3.0 | 2.0 | 1295 | $1,550 | $1.20 | 45d | 1 | 0.93mi |
| 514 E Hazelwood St Unit B Princeton, TX | 3.0 | 2.0 | 1380 | $1,495 | $1.08 | 45d | 1 | 0.93mi |
| 514 E Hazelwood St Princeton, TX | 3.0 | 2.0 | 1380 | $1,475 | $1.07 | 26d | 1 | 0.93mi |
| 514 E Hazelwood St Unit B Princeton, TX | 3.0 | 2.0 | 1380 | $1,475 | $1.07 | 9d | 1 | 0.93mi |
| 514 E Hazelwood St Princeton, TX | 3.0 | 2.0 | 1380 | $1,475 | $1.07 | 0d | 1 | 0.93mi |
| 2207 Pioneer Dr Unit 2207 Princeton, TX | 3.0 | 2.0 | 1412 | $2,100 | $1.49 | 14d | 1 | 0.94mi |
| 2301 States St Princeton, TX | 3.0 | 2.0 | 1443 | $1,770 | $1.23 | 45d | 1 | 0.99mi |
| 596 N Beauchamp Blvd Princeton, TX | 1.0–2.0 | 1.0–2.0 | 1009 | $2,070 | $2.05 | 0d | 40 | 1.01mi |
| 2307 States St Princeton, TX | 3.0 | 2.0 | 1412 | $1,800 | $1.27 | 45d | 1 | 1.01mi |
| 226 Griffith Dr Princeton, TX | 3.0 | 2.5 | 1339 | $1,675 | $1.25 | 26d | 1 | 1.01mi |
| 600 W Monte Carlo Blvd Princeton, TX | 1.0–3.0 | 1.0–2.0 | 1245 | $1,386 | $1.11 | 0d | 30 | 1.04mi |
| 899 E Hazelwood St Princeton, TX | 1.0–3.0 | 1.0–2.0 | 989 | $1,438 | $1.45 | 0d | 13 | 1.04mi |
| 200 Cole St Princeton, TX | 1.0–2.0 | 1.0–2.0 | 838 | $1,263 | $1.51 | 0d | 8 | 1.05mi |
| 200 Cole St Princeton, TX | 1.0–3.0 | 1.0–2.0 | 960 | $1,447 | $1.51 | 45d | 23 | 1.05mi |
| 713 Cedar Cove Dr Princeton, TX | 3.0 | 2.0 | 1366 | $1,840 | $1.35 | 0d | 1 | 1.11mi |
Listing history 41 events
-
2026-06-21days on market $209,000 Active 59 DOM
-
2026-06-18days on market $209,000 Active 56 DOM
-
2026-06-17days on market $209,000 Active 55 DOM
-
2026-06-16days on market $209,000 Active 54 DOM
-
2026-06-15days on market $209,000 Active 53 DOM
-
2026-06-13days on market $209,000 Active 51 DOM
-
2026-06-13days on market $209,000 Active 50 DOM
-
2026-06-09days on market $209,000 Active 47 DOM
-
2026-06-08days on market $209,000 Active 46 DOM
-
2026-06-07days on market $209,000 Active 45 DOM
-
2026-06-04pricedays on market $209,000 Active 42 DOM
-
2026-06-03days on market $219,000 Active 41 DOM
-
2026-06-02days on market $219,000 Active 40 DOM
-
2026-06-01days on market $219,000 Active 39 DOM
-
2026-05-31days on market $219,000 Active 38 DOM
-
2026-04-23$219,000 Active 517-char remark
-
2026-01-08soldstatus
-
2026-01-07soldstatus Closed 580-char remark
Show marketing remark (580 chars)
This three-bedroom, one-and-a-half-bathroom house sits on approximately 0.3 acres of land. The home offers approximately 1,021 square feet of living space. The updated kitchen features modern appliances and cabinetry, providing ample storage and preparation space. The updated bathroom includes contemporary fixtures and finishes, creating a comfortable and functional space. The large lot allows for ample outdoor space and potential for landscaping or other enhancements. The property's location and size may appeal to those seeking additional living or recreation areas.
-
2025-12-30status Pending 580-char remark
Show marketing remark (580 chars)
This three-bedroom, one-and-a-half-bathroom house sits on approximately 0.3 acres of land. The home offers approximately 1,021 square feet of living space. The updated kitchen features modern appliances and cabinetry, providing ample storage and preparation space. The updated bathroom includes contemporary fixtures and finishes, creating a comfortable and functional space. The large lot allows for ample outdoor space and potential for landscaping or other enhancements. The property's location and size may appeal to those seeking additional living or recreation areas.
-
2025-11-14price $244,900 580-char remark
Show marketing remark (580 chars)
This three-bedroom, one-and-a-half-bathroom house sits on approximately 0.3 acres of land. The home offers approximately 1,021 square feet of living space. The updated kitchen features modern appliances and cabinetry, providing ample storage and preparation space. The updated bathroom includes contemporary fixtures and finishes, creating a comfortable and functional space. The large lot allows for ample outdoor space and potential for landscaping or other enhancements. The property's location and size may appeal to those seeking additional living or recreation areas.
-
2025-09-29$249,900 Active 580-char remark
Show marketing remark (580 chars)
This three-bedroom, one-and-a-half-bathroom house sits on approximately 0.3 acres of land. The home offers approximately 1,021 square feet of living space. The updated kitchen features modern appliances and cabinetry, providing ample storage and preparation space. The updated bathroom includes contemporary fixtures and finishes, creating a comfortable and functional space. The large lot allows for ample outdoor space and potential for landscaping or other enhancements. The property's location and size may appeal to those seeking additional living or recreation areas.
-
2025-04-29historical
-
2025-03-25price $249,000
-
2025-01-20price $256,000
-
2024-12-05price $264,000
-
2024-11-06price $269,999
-
2024-10-14$274,999 Active
-
2019-03-14soldstatus
-
2019-03-13soldstatus Sold
-
2019-02-20status Pending
-
2019-02-19status Active
-
2019-02-13historical Active Option Contract
-
2019-02-09$144,000 Active
-
2018-04-27soldstatus
-
2018-04-23soldstatus
-
2018-04-23soldstatus
-
2018-04-23soldstatus
-
2005-12-01soldstatus
-
2005-11-21soldstatus
-
2005-10-12historical
-
2005-08-10$76,000
ⓘ Source: listings_history table (triggers on properties + properties_extension) + one-shot
backfill from property_details.listing_events for pre-trigger history.
Tax reassessment forecast TX · Resets to sale price
- Current annual tax
- $3,443 · $287/mo
- Projected year-2 tax
- $3,825 · $319/mo
- Expected delta
- +$382/yr (+$32/mo · 11.1%)
ⓘ Screening estimate from a state-policy table — verify with the county assessor before closing.
Climate risk First Street
- Flood 1/10 Low FEMA zone X (unshaded) · 0% chance over 30 yrs
- Wildfire 5/10 Major
- Heat 7/10 Severe 7 d/yr ≥110°F today · 23 d/yr by 30 yrs out
- Wind 6/10 Major 27% chance of damaging wind over 30 yrs
- Air quality 3/10 Moderate 3 unhealthy d/yr today · 3 by 30 yrs out
Nearby sold comps map
Loading sold comps map…
Walkable amenities ~0.75 mi
Loading nearby amenities…
Taxation est. · year 1
- Rental income
- $20,975
- − Mortgage interest
- −$11,707
- − Property taxes
- −$3,443
- − Insurance
- −$1,045
- − Repairs & maintenance
- −$1,678
- − Management
- −$1,678
- − Depreciation
- −$6,080
- Taxable loss
- −$4,656
- Est. tax savings @ 24.0%
- +$1,117
- After-tax cash flow
- $48/yr
For passive investors: Depreciation is non-cash, so a rental often shows a tax loss while cash-flowing — sheltering income. Rental losses are passive: they offset passive income freely, and up to $25,000/yr can offset ordinary (W-2) income if you actively participate and your MAGI is under $100k (phasing out to $0 by $150k); unused losses carry forward. On sale, claimed depreciation is recaptured at up to 25%, and gains may owe capital-gains tax (a 1031 exchange can defer both). Figures are a year-1 estimate at your 24.0% rate — not tax advice; consult a CPA.
Schools (NCES district)
- District
- Princeton ISD
- NCES district ID
- 4835850
- Math proficiency
- 51% ▼ -8.00%
- Reading proficiency
- 47% ▬ 0.00%
- Median HH income
- $54,827
- Composite
- 42.44/100
- National rank
- #3226
- State rank
- #188 of 826 in TX
Livability — Princeton
- Score
- 62/100
- State rank
- #969
- US rank
- #17215
Category grades
Schools grade is shown separately in the Schools card above.
Census & demographics
- Census place
- Princeton, TX
- County
- Collin County · 1,159,394 people
- City population
- 34,171
- Metro
- Dallas-Fort Worth-Arlington, TX
- Population (ZIP)
- 34,171
- Household income
- $100,037
- Rent vs Own
- Severe rent burden
- 368.0
Population outlook (Collin County) Hauer SSP2
- Today (2025)
- 1,210,074 people
- By 2030
- 1,358,201 · +12.2%
- By 2040
- 1,654,061 · +36.7%
- By 2050
- 1,937,359 · +60.1%
- By 2075
- 2,567,039 · +112.1%
- By 2100
- 2,952,048 · +144.0%
Race, ethnicity, and origin ACS 2023
- Neighborhood character
- Diverse neighborhood (Simpson 0.66)
- Race & ethnicity
- White 47% Hispanic / Latino 30% Black 17% Two or more races 10% Asian 4% Native American 1%
- Hispanic origin (detail)
- Mexican 26%
- Common ancestry
- Lithuanian 2% Romanian 1% Russian 1%
- Foreign-born
- 15% · Canada, China, Mexico
- Languages at home
- 70% English-only · Spanish 22% Other Indo-European 2% Other Asian/Pacific 1%
Political lean MEDSL · Collin
- 2024 margin
- R (+11.1) · D 43.1% · R 54.3% · Other 2.6%
- 2008→2024 swing
- +14.4pp toward D · 2008: -25.6pp · 2024: -11.1pp
- All cycles
- 2024: R+11.1 2020: R+4.3 2016: R+17.0 2012: R+31.6 2008: R+25.6
Not yet ingested
- Civics
- —
Market trends
- HPI YoY
- ▼ -103.99%
- Current HPI
- 238.9373
- Rent YoY
- ▼ -1.02%
- Metro
- Dallas-Fort Worth-Arlington, TX
- State GDP YoY
- ▲ 3.95%
- F500 in state
- 110
Industry mix (Fortune 500 HQ in TX)
| Industry | F500 HQs | Revenue |
|---|---|---|
| Energy | 16 | $1,198B |
|
||
| Technology | 5 | $198B |
|
||
| Engineering / Construction | 4 | $72B |
|
||
| Energy Services | 3 | $60B |
|
||
| Utilities | 3 | $41B |
|
||
| Healthcare | 2 | $330B |
|
||
Price history
+175.0% since first listed27 events — show timeline
- 2026-06-03 Price Changed $209,000 NTREIS
- 2026-04-23 Listed $219,000 NTREIS
- 2026-01-08 Sold (Public Records) — Public Records
- 2026-01-07 Sold (MLS) — NTREIS
- 2025-12-30 Pending — NTREIS
- 2025-11-14 Price Changed $244,900 NTREIS
- 2025-09-29 Listed $249,900 NTREIS
- 2025-04-29 Listing Removed — NTREIS
- 2025-03-25 Price Changed $249,000 NTREIS
- 2025-01-20 Price Changed $256,000 NTREIS
- 2024-12-05 Price Changed $264,000 NTREIS
- 2024-11-06 Price Changed $269,999 NTREIS
- 2024-10-14 Listed $274,999 NTREIS
- 2019-03-14 Sold (Public Records) — Public Records
- 2019-03-13 Sold (MLS) — NTREIS
- 2019-02-20 Pending — NTREIS
- 2019-02-19 Relisted — NTREIS
- 2019-02-13 Contingent — NTREIS
- 2019-02-09 Listed $144,000 NTREIS
- 2018-04-27 Sold (Public Records) — Public Records
- 2018-04-23 Sold (Public Records) — Public Records
- 2018-04-23 Sold (Public Records) — Public Records
- 2018-04-23 Sold (Public Records) — Public Records
- 2005-12-01 Sold (Public Records) — Public Records
- 2005-11-21 Sold (MLS) — NTREIS
- 2005-10-12 Listing Removed — NTREIS
- 2005-08-10 Listed $76,000 NTREIS
Property tax history
+4.6%/yrLatest (2025): $3,443 · -9.0% YoY. Source: county tax records.
Cash-flow waterfall
monthlySold comps — $/sqft
last 12 mo · ≤1 miLoading sold comps…