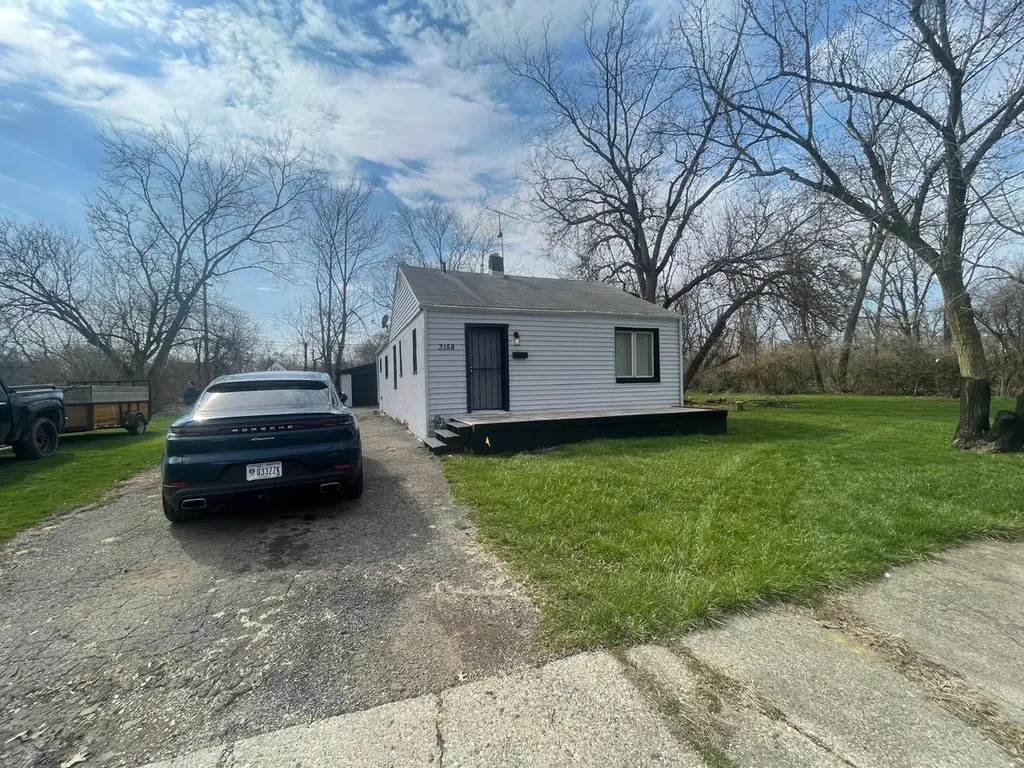
3158 Hickory St · Inkster, MI
Flood risk 6/10 · Moderate
- FEMA flood zone
- X (unshaded)
- Chance of flooding over 30 yrs
- 0.68%
- Est. flood insurance / yr
- $507 – $1,088
Fire risk 1/10 · Minimal
- Est. fire insurance / yr
- $784 – $1,456
Heat risk 3/10 · Minor
- Hot days now (above 98°F)
- 7 days/yr
- Hot days in 30 yrs
- 15 days/yr
Wind risk 2/10 · Minimal
- Chance of severe wind over 30 yrs
- —
Air-quality risk 2/10 · Minimal
- Unhealthy air days now
- 1 days/yr
- Unhealthy air days in 30 yrs
- 2 days/yr
Risk factors via First Street. Map © Google.
Why this score? — see what drove the C grade
The composite is a weighted blend of 9 inputs, each scored 0–100. Each bar is that input's sub-score; the figure is the points it added to the 100-point composite (weight × sub-score).
- Cash flow +28.9/30.0
- 1% rule +10.0/10.0
- DSCR +10.0/10.0
- Livability +3.4/5.0
- Rent growth +3.2/5.0
- Condition / age +2.5/5.0
- Schools +1.8/10.0
- ARV discount +0.0/15.0
- Appreciation +0.0/10.0
$89,800
🖨 Deal sheet 📄 Offer letter ✓ Due diligence
Listing remarks
Fully remodeled 3-bedroom, 1-bath home at This move-in ready property features updated flooring, fresh paint, and a modern kitchenn , new plumbing and a new furnace Bright living spaces and a spacious yard make it perfect for comfortable living or investment. Conveniently located near schools, shopping, and major roads--don't miss this great opportunity! priced to sell
Key facts
- Remodeled
- New furnace
- New plumbing
Tags
Neighborhood map
What this means for you Summary
Snapshot
- This is a 3-bed/1.0-bath single-family listed at $90k.
Deal economics
- At list price, monthly cash flow is $303 ($4k/yr) — positive.
- The deal already cash-flows at list — no discount required.
- Meets the 1% rule at list price ($1k rent vs $90k).
Location & tenants
- Location reads 67/100 on livability (#406 in MI) — a middle-class / working-renter tenant base. Strengths: commute A+, cost of living A+, housing A+; Watch: health & safety D, schools F, crime F.
- Taylor School District (urban): math 14% / reading 27% proficiency, ranked #462 of 540 in MI (top 86%) — low school quality limits family demand, transient renter base, plan for 1-2y turnover; 68% free/reduced lunch — lower-income household profile, screen leases tightly.
- Market conditions: Rents rising (+3.0%/yr); 142 active listings in the ZIP; 19 comparable units currently listed for rent nearby; rentals at typical pace (median 17d on market — plan ~3-4 weeks tenant-placement turnaround); lower-income renter base — watch delinquency; 2,639 units permitted in Wayne County in 2024 (1,216 in 5+ unit buildings).
- This rent runs 43% of the median local income ($39k/yr) — at the standard rent-burdened threshold; future hikes will face affordability resistance.
Forward outlook
- Local home prices are declining (-3.0%/yr); year-one equity from $621 of loan paydown is wiped out by about $3k of value loss. Plan a longer hold.
- Wayne County population projected at -17% by 2050 — secular population decline; favor cash flow + early exit over multi-decade hold.
- At projected returns (-3.0% appreciation + 3.0% rent growth), your $25k cash investment doubles in ~9 years — after that, you're playing with house money.
Negotiation context
- Only 6 days on market — expect competitive offers; lowballing is unlikely to land.
- 9 sale attempts since 19y ago with the ask held roughly flat each time — persistent listings suggest the price (not the market) is what's stuck; bring a comps-based counter.
- Current owner paid $16k; list at $90k implies a 461% gain — meaningful room to come down on a strong offer.
Risks & watch-outs
- Watch-outs: property tax is 4.0% of price; built in 1953 — expect roof / HVAC / electrical / plumbing capex.
- Climate carrying-cost: major flood risk — expect insurance premiums to compound above CPI over the hold.
Questions for the listing agent
- Built in 1953 — when were the roof, HVAC, electrical panel, plumbing, and water heater last replaced?
- Property tax is high relative to price — has the assessment been appealed recently, and will the sale trigger a re-assessment?
- Is there a deadline driving the sale (1031 exchange, divorce, estate, relocation)? That informs how much negotiation room exists.
- Schools are F-rated, which usually means shorter tenancies and higher turnover. Who's the typical renter profile here, and what's been the actual vacancy rate?
- Crime grade is F in this area — have there been break-ins, vandalism, or insurance claims at this property in the last 3 years? What carrier currently insures it and at what premium?
- What's the average days-on-market for RENTAL listings here right now (not sales)? A rising rental-DOM trend means longer vacancies and softer asking-rent achievability than the comps imply.
- What's the recent tenant-quality profile in this submarket — average credit score on applications, eviction rate, late-payment / NSF rate, and stable-employment percentage? A property-management company in the area should have these aggregated.
- How much new for-sale + rental construction is in the pipeline within 1–3 miles? Heavy new supply typically softens prices + rents 12–24 months out; constrained supply supports both.
Investment metrics
- 1% rule
- 1.57% ✓
- Cap rate
- 10.34%
- Cash-on-cash
- 14.47%
- DSCR
- 1.64
- GRM
- 5.3
CMA / ARV
- ARV (median comp)
- $72,725
- List price
- $89,800
- Delta
- 23.62%
- Verdict
- OVERPRICED
- Comps
- 20 within 1.0 mi
Show comp detail 12 sales within ~0.75 mi
| Address | Dist | Beds/Ba | Sqft | Sold | Price | $/sf | Match |
|---|---|---|---|---|---|---|---|
| 3543 Spring Hill Ave | 0.38mi | 3/1.0 | 1,097 (-0%) | 3mo | $108,000 | $98 | 79 |
| 3135 Harrison St | 0.14mi | 2/1.0 (-1) | 1,049 (-5%) | 4mo | $47,000 | $45 | 78 |
| 3579 Ash St | 0.27mi | 4/1.0 (+1) | 1,050 (-4%) | 1mo | $140,000 | $133 | 74 |
| 3033 Williams St | 0.19mi | 3/1.0 | 1,200 (+9%) | 3mo | $120,000 | $100 | 74 |
| 3514 Spruce St | 0.21mi | 4/1.0 (+1) | 1,148 (+4%) | 7mo | $71,000 | $62 | 72 |
| 3829 Walnut St | 0.47mi | 3/1.0 | 1,070 (-3%) | 2mo | $128,000 | $120 | 72 |
| 4005 Moore St | 0.59mi | 3/1.0 | 1,100 (0%) | 2mo | $46,000 | $42 | 71 |
| 27018 Kitch St | 0.65mi | 3/1.0 | 1,112 (+1%) | 7mo | $116,000 | $104 | 62 |
| 2500 Weithoff Ct | 0.61mi | 3/1.0 | 1,050 (-4%) | 3mo | $125,000 | $119 | 61 |
| 4135 Allen St | 0.70mi | 3/1.0 | 972 (-12%) | 1mo | $40,000 | $41 | 47 |
| 27848 Rosewood St | 0.72mi | 3/1.0 | 1,000 (-9%) | 7mo | $127,000 | $127 | 46 |
| 1909 Justine St | 0.54mi | 3/2.0 | 1,256 (+14%) | 6mo | $38,000 | $30 | 43 |
Match score weights: distance 35% · size 25% · config 20% · recency 20%. Top-matched comps best support the ARV.
Projected returns pro-forma
-3.0% appreciation · 2.95% rent growth · sell at horizon
- IRR
- 4.9%
- Equity multiple
- 1.19×
- Total profit
- $4,827
- Equity at exit
- $13,389
- IRR
- 14.4%
- Equity multiple
- 2.17×
- Total profit
- $29,338
- Equity at exit
- $7,764
Cash invested: $25,144 (down + closing). Projections, not guarantees.
Landlord ↔ Tenant lean methodology
- Overall (STATE)
- 62 Landlord-Friendly
- State Michigan
- 62 Landlord-Friendly · EVEN
- County
- — inherits STATE
- City
- — inherits STATE
ZIP-level market 48141
- Home prices YoY
- -2.9%
- Rents YoY
- 3.0%
- Active inventory
- 142
- Price-to-rent
- 5.3×
Monthly cashflow live
- Estimated rent
- $1,409 high interval (Pro) →
- Mortgage (P&I)
- −$471
- Tax from tax record
- −$302 /mo · $3,620/yr
- Insurance
- −$37
- HOA
- −$0
- Vacancy / Maint / Mgmt
- −$296
- Net cashflow
- $303
Break-even live
UW: 25.0% down · 7.5% · 30yr · 1.5% tax · 5.0% vac · 8.0% maint · 8.0% mgmt
Financing live
Cash to close
- Down payment
- $22,450
- Closing costs
- $2,694
- Reserves months
- —
- Total cash needed
- —
Loan-product check · same deal, 3 products live
Conventional
25% down · 7.5% · 30yr
- Down + closing
- —
- Monthly P&I
- —
- Monthly cashflow
- —
- DSCR
- —
- Eligible?
- —
Personal DTI + credit; lowest rate.
DSCR
20% down · 8.5% · 30yr
- Down + closing
- —
- Monthly P&I
- —
- Monthly cashflow
- —
- DSCR
- —
- Eligible?
- —
No personal income docs; deal must DSCR.
Hard money
10% down · 12.0% · 12mo
- Down + closing
- —
- Monthly P&I
- —
- Monthly cashflow
- —
- DSCR
- —
- Eligible?
- —
Short-term bridge; refi at stabilization.
Rent comps 19 comps
| Address | Beds | Baths | Sqft | Rent | $/sqft | DOM | Units | Dist |
|---|---|---|---|---|---|---|---|---|
| 3236 Walnut St Inkster, MI | 3.0 | 1.0 | 1096 | $1,495 | $1.36 | 2d | 1 | 0.12mi |
| 27139 Penn St Inkster, MI | 3.0 | 1.0 | 832 | $675 | $0.81 | 17d | 1 | 0.59mi |
| 4080 Isabelle St Inkster, MI | 4.0 | 1.0 | 975 | $1,150 | $1.18 | 14d | 1 | 0.67mi |
| 4167 Isabelle St Inkster, MI | 2.0 | 1.0 | 900 | $1,295 | $1.44 | 17d | 1 | 0.72mi |
| 4301 Harriet St Unit A-1 Inkster, MI | 2.0 | 1.5 | 1000 | $1,300 | $1.30 | 43d | 1 | 0.75mi |
| 26742 Penn St Inkster, MI | 3.0 | 1.0 | 1000 | $1,300 | $1.30 | 16d | 1 | 0.80mi |
| 26707 Penn St Inkster, MI | 3.0 | 1.0 | 900 | $1,400 | $1.56 | 4d | 1 | 0.83mi |
| 1150 Magnolia Dr Inkster, MI | 3.0 | 1.0 | 900 | $1,300 | $1.44 | 24d | 1 | 1.02mi |
| 27184 Lucerne Dr Inkster, MI | 3.0 | 1.0 | 1100 | $1,250 | $1.14 | 43d | 1 | 1.10mi |
| 29971 Brooklane St Inkster, MI | 3.0 | 1.0 | 974 | $1,450 | $1.49 | 43d | 1 | 1.11mi |
| 26382 Colgate St Inkster, MI | 2.0 | 1.0 | 850 | $935 | $1.10 | 24d | 1 | 1.11mi |
| 29203 Oakwood St Inkster, MI | 3.0 | 1.5 | 912 | $1,600 | $1.75 | 1d | 1 | 1.20mi |
| 26159 Stanford St Inkster, MI | 4.0 | 1.0 | 1056 | $1,350 | $1.28 | 4d | 1 | 1.32mi |
| 30010 Hazelwood St Inkster, MI | 3.0 | 1.0 | 1044 | $1,300 | $1.25 | 43d | 1 | 1.34mi |
| 29800 Oakwood St Inkster, MI | 3.0 | 1.0 | 1040 | $1,400 | $1.35 | 12d | 1 | 1.36mi |
| 26274 McDonald St Dearborn Heights, MI | 3.0 | 1.0 | 1365 | $1,575 | $1.15 | 1d | 1 | 1.39mi |
| 25745 Princeton St Dearborn Heights, MI | 3.0 | 1.0 | 1080 | $1,500 | $1.39 | 10d | 1 | 1.41mi |
| 26089 Lehigh St Inkster, MI | 2.0 | 1.0 | 900 | $1,295 | $1.44 | 17d | 1 | 1.42mi |
| 25722 Carlysle St Dearborn Heights, MI | 3.0 | 1.0 | 1040 | $1,450 | $1.39 | 17d | 1 | 1.47mi |
Listing history 28 events
-
2026-06-04pricedays on market $89,800 Active 6 DOM
-
2026-06-03days on market $89,900 Active 5 DOM
-
2026-06-02days on market $89,900 Active 4 DOM
-
2026-06-01days on market $89,900 Active 3 DOM
-
2026-05-31days on market $89,900 Active 2 DOM
-
2026-05-13price $89,900 371-char remark
-
2026-05-13price $89,900 371-char remark
-
2026-05-13price $89,900
-
2026-04-16price $99,900 371-char remark
-
2026-04-16price $99,900 371-char remark
-
2026-04-16price $99,900
-
2026-04-09$104,900 Active 371-char remark
-
2026-04-09$104,900 Active
-
2026-04-09$104,900 Active 371-char remark
-
2026-04-09historical $104,900 371-char remark
-
2026-04-09historical $104,900
-
2026-04-07historical
-
2026-04-07historical
-
2026-03-23$119,900 Active
-
2026-03-23$119,900 Active
-
2018-03-27soldstatus $16,000 Sold
-
2018-03-27soldstatus $16,000 Closed
-
2018-03-24status Pending
-
2018-03-24status Pending
-
2018-03-23$16,000 Active
-
2018-03-23$16,000 Active
-
2007-12-02historical
-
2007-01-02$2,900
ⓘ Source: listings_history table (triggers on properties + properties_extension) + one-shot
backfill from property_details.listing_events for pre-trigger history.
Tax reassessment forecast MI · Partial reset (capped growth)
- Current annual tax
- $3,620 · $302/mo
- Projected year-2 tax
- $3,620 · $302/mo
- Expected delta
- $0/yr ($0/mo · 0.0%)
ⓘ Screening estimate from a state-policy table — verify with the county assessor before closing.
Climate risk First Street
- Flood 6/10 Major FEMA zone X (unshaded) · 68% chance over 30 yrs
- Wildfire 1/10 Low
- Heat 3/10 Moderate 7 d/yr ≥98°F today · 15 d/yr by 30 yrs out
- Wind 2/10 Low
- Air quality 2/10 Low 1 unhealthy d/yr today · 2 by 30 yrs out
Nearby sold comps map
Loading sold comps map…
Walkable amenities ~0.75 mi
Loading nearby amenities…
Taxation est. · year 1
- Rental income
- $16,909
- − Mortgage interest
- −$5,030
- − Property taxes
- −$3,620
- − Insurance
- −$449
- − Repairs & maintenance
- −$1,353
- − Management
- −$1,353
- − Depreciation
- −$2,612
- Taxable income
- $2,492
- Est. tax owed @ 24.0%
- −$598
- After-tax cash flow
- $3,040/yr
For passive investors: Depreciation is non-cash, so a rental often shows a tax loss while cash-flowing — sheltering income. Rental losses are passive: they offset passive income freely, and up to $25,000/yr can offset ordinary (W-2) income if you actively participate and your MAGI is under $100k (phasing out to $0 by $150k); unused losses carry forward. On sale, claimed depreciation is recaptured at up to 25%, and gains may owe capital-gains tax (a 1031 exchange can defer both). Figures are a year-1 estimate at your 24.0% rate — not tax advice; consult a CPA.
Schools (NCES district)
- District
- Taylor School District
- NCES district ID
- 2633540
- Math proficiency
- 14% ▼ -7.00%
- Reading proficiency
- 27% ▼ -4.00%
- Median HH income
- $43,062
- Composite
- 17.62/100
- National rank
- #9034
- State rank
- #462 of 540 in MI
Livability — Inkster
- Score
- 67/100
- State rank
- #406
- US rank
- #11087
Category grades
Schools grade is shown separately in the Schools card above.
Census & demographics
- Census place
- Inkster, MI
- County
- Wayne County · 1,562,939 people
- City population
- 25,428
- Metro
- Detroit-Warren-Dearborn, MI
- Population (ZIP)
- 25,428
- Household income
- $39,252
- Rent vs Own
- Severe rent burden
- 1558.0
Population outlook (Wayne County) Hauer SSP2
- Today (2025)
- 1,675,273 people
- By 2030
- 1,620,300 · -3.3%
- By 2040
- 1,502,341 · -10.3%
- By 2050
- 1,384,039 · -17.4%
- By 2075
- 1,124,592 · -32.9%
- By 2100
- 881,193 · -47.4%
Race, ethnicity, and origin ACS 2023
- Neighborhood character
- Predominantly Black (72%)
- Race & ethnicity
- Black 72% White 17% Two or more races 7% Hispanic / Latino 2% Asian 1%
- Common ancestry
- Romanian 3% Slovak 1% Italian 1%
- Foreign-born
- 5% · Canada, China
- Languages at home
- 92% English-only · Arabic 3% Other Asian/Pacific 1% Spanish 1%
Political lean MEDSL · Wayne
- 2024 margin
- Strong D (+29.0) · D 62.7% · R 33.7% · Other 3.6%
- 2008→2024 swing
- -20.5pp toward R · 2008: 49.5pp · 2024: 29.0pp
- All cycles
- 2024: D+29.0 2020: D+38.1 2016: D+37.3 2012: D+46.9 2008: D+49.5
Not yet ingested
- Civics
- —
Market trends
- HPI YoY
- ▼ -11.74%
- Current HPI
- 390.2139
- Rent YoY
- ▲ 2.95%
- Metro
- Detroit-Warren-Dearborn, MI
- State GDP YoY
- ▲ 1.37%
- F500 in state
- 28
Industry mix (Fortune 500 HQ in MI)
| Industry | F500 HQs | Revenue |
|---|---|---|
| Automotive Parts | 3 | $48B |
|
||
| Automotive | 2 | $372B |
|
||
| Chemicals | 1 | $45B |
|
||
| Automotive Retail | 1 | $29B |
|
||
| Healthcare / Medical Devices | 1 | $23B |
|
||
| Automotive Technology | 1 | $20B |
|
||
Price history
+2996.6% since first listed30 events — show timeline
- 2026-06-06 Listing Removed — MiRealSource-MiMLS
- 2026-06-05 Listing Removed — REALCOMP
- 2026-06-03 Price Changed $89,800 MiRealSource-MiMLS
- 2026-06-03 Price Changed $89,800 REALCOMP
- 2026-06-03 Price Changed $89,800 SW Michigan MLS
- 2026-05-29 Listing Removed — MiRealSource-MiMLS
- 2026-05-29 Listing Removed — REALCOMP
- 2026-05-29 Listed $89,900 REALCOMP
- 2026-05-29 Listed $89,900 MiRealSource-MiMLS
- 2026-05-13 Price Changed $89,900 MiRealSource-MiMLS
- 2026-05-13 Price Changed $89,900 REALCOMP
- 2026-05-13 Price Changed $89,900 SW Michigan MLS
- 2026-04-16 Price Changed $99,900 MiRealSource-MiMLS
- 2026-04-16 Price Changed $99,900 REALCOMP
- 2026-04-16 Price Changed $99,900 SW Michigan MLS
- 2026-04-09 Listed $104,900 REALCOMP
- 2026-04-09 Listed $104,900 MiRealSource-MiMLS
- 2026-04-09 Coming Soon — MiRealSource-MiMLS
- 2026-04-07 Listing Removed — REALCOMP
- 2026-04-07 Listing Removed — MiRealSource-MiMLS
- 2026-03-23 Listed $119,900 REALCOMP
- 2026-03-23 Listed $119,900 MiRealSource-MiMLS
- 2018-03-27 Sold (MLS) $16,000 MiRealSource-MiMLS
- 2018-03-27 Sold (MLS) $16,000 REALCOMP
- 2018-03-24 Pending — MiRealSource-MiMLS
- 2018-03-24 Pending — REALCOMP
- 2018-03-23 Listed $16,000 MiRealSource-MiMLS
- 2018-03-23 Listed $16,000 REALCOMP
- 2007-12-02 Listing Removed — REALCOMP
- 2007-01-02 Listed $2,900 REALCOMP
Property tax history
+4.6%/yrLatest (2025): $3,620 · +11.2% YoY. Source: county tax records.
Cash-flow waterfall
monthlySold comps — $/sqft
last 12 mo · ≤1 miLoading sold comps…