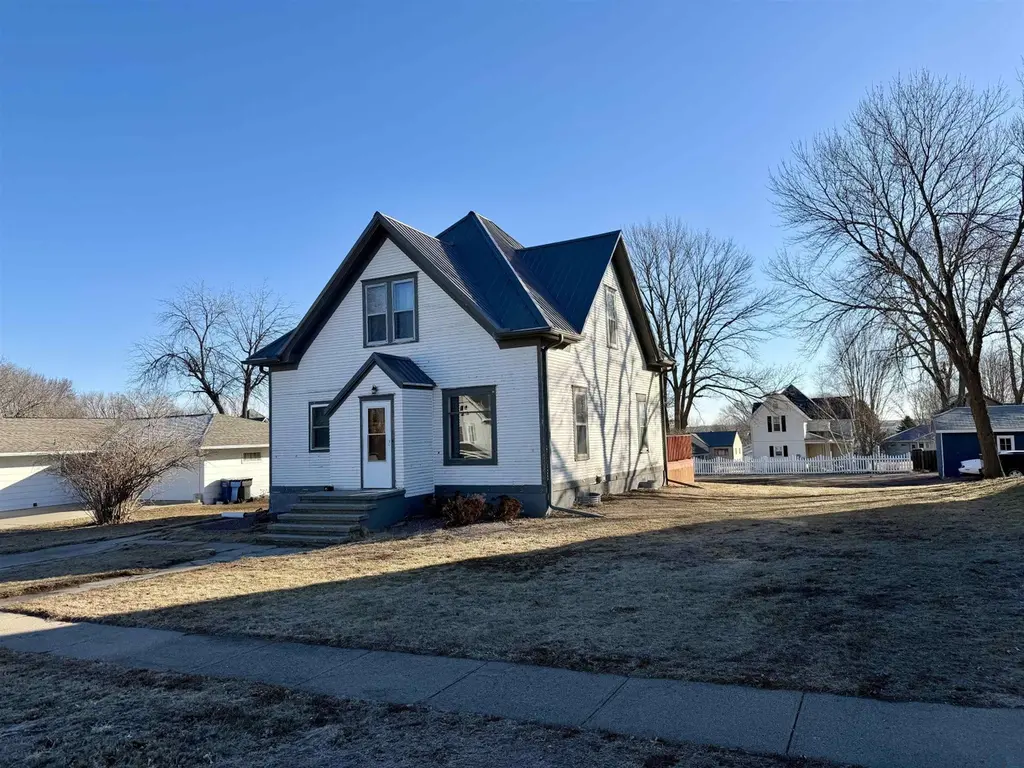
621 Harrison St · Remsen, IA
Flood risk 1/10 · Minimal
- FEMA flood zone
- X (unshaded)
- Chance of flooding over 30 yrs
- 0.0%
- Est. flood insurance / yr
- $473 – $860
Fire risk 1/10 · Minimal
- Est. fire insurance / yr
- $902 – $1,676
Heat risk 3/10 · Minor
- Hot days now (above 100°F)
- 7 days/yr
- Hot days in 30 yrs
- 15 days/yr
Wind risk 2/10 · Minimal
- Chance of severe wind over 30 yrs
- —
Air-quality risk 1/10 · Minimal
- Unhealthy air days now
- 0 days/yr
- Unhealthy air days in 30 yrs
- 0 days/yr
Risk factors via First Street. Map © Google.
Why this score? — see what drove the C+ grade
The composite is a weighted blend of 9 inputs, each scored 0–100. Each bar is that input's sub-score; the figure is the points it added to the 100-point composite (weight × sub-score).
- Cash flow +14.7/30.0
- ARV discount +14.7/15.0
- Appreciation +10.0/10.0
- Schools +6.5/10.0
- DSCR +4.5/10.0
- Livability +4.0/5.0
- 1% rule +3.5/10.0
- Rent growth +2.5/5.0
- Condition / age +2.5/5.0
$150,000
🖨 Deal sheet 📄 Offer letter ✓ Due diligence
Listing remarks MLS
Welcome to this 4-bedroom, 2-bath home located on a large lot in Remsen. This property offers plenty of space both inside and out, making it a great opportunity for homeowners or investors alike. The home is move-in ready, with solid bones and functional layout, while still offering room for cosmetic updates to truly make it your own. Having previously been used as a rental, it presents excellent potential as a primary residence, investment property, or value-add project. Additional features include a single-car garage accessed from the alley, ample yard space, and a convenient location close to town amenities. 4 Bedrooms 2 Bathrooms Large lot Alley-access garage Former rental Selling AS-IS If you’re looking for space, potential, and value in a small-town setting, this one is worth a look! Owner has never lived in this home only used as rental.
Key facts
- Large lot
- Convenient location
- Ample yard space
Tags
Neighborhood map
What this means for you Summary
Snapshot
- This is a 4-bed/1.0-bath single-family listed at $150k.
Deal economics
- At list price, monthly cash flow is $39 ($473/yr) — positive.
- The deal already cash-flows at list — no discount required.
- To meet the 1% rule (rent ≥ 1% of price), the offer needs to be $127k (15.0% below list).
- Recommended offer: $127k (15.0% below list) — sets the bar for 1% rule.
Location & tenants
- Location reads 80/100 on livability (#78 in IA, #1,646 nationally) — a professional / high-income tenant draw. Strengths: schools A+, crime A+, cost of living A+; Watch: amenities F, commute F.
- Remsen-Union Community School District (rural): math 72% / reading 79% proficiency, ranked #59 of 289 in IA (top 20%) — strong family-tenant draw, lease renewals of 3-5y typical; only 20% free/reduced lunch — higher-income household profile.
- Market conditions: 7 active listings in the ZIP; 147 units permitted in Plymouth County in 2024 (112 in 5+ unit buildings).
Forward outlook
- In year one you build about $16k of equity ($1k loan paydown + $15k appreciation (10.0% local appreciation)).
- At projected returns (10.0% appreciation + 3.0% rent growth), your $42k cash investment doubles in ~3 years — after that, you're playing with house money.
- By year 3, paydown + projected appreciation supports a ~$41k cash-out refi (75% LTV) — recoverable capital for the next deal without selling this one.
Negotiation context
- It's been on market 83 days — a 6% lower offer ($141k) is reasonable based on typical stale-listing flexibility.
Risks & watch-outs
- Watch-outs: built in 1920 — expect roof / HVAC / electrical / plumbing capex.
Questions for the listing agent
- It's been on market 83 days. Have you received any prior offers? Is the seller open to a 15% concession, seller financing, or rate buy-down credit?
- Built in 1920 — when were the roof, HVAC, electrical panel, plumbing, and water heater last replaced?
- Why hasn't it sold? Are there any deal-killer items the seller is aware of (foundation, flood, title, zoning, code violations)?
- Is there a deadline driving the sale (1031 exchange, divorce, estate, relocation)? That informs how much negotiation room exists.
- Schools are A-rated — typically a magnet for longer-tenancy family renters. What's the average tenant stay here, and is there a school-zone premium baked into asking?
- What's the average days-on-market for RENTAL listings here right now (not sales)? A rising rental-DOM trend means longer vacancies and softer asking-rent achievability than the comps imply.
- What's the recent tenant-quality profile in this submarket — average credit score on applications, eviction rate, late-payment / NSF rate, and stable-employment percentage? A property-management company in the area should have these aggregated.
- How much new for-sale + rental construction is in the pipeline within 1–3 miles? Heavy new supply typically softens prices + rents 12–24 months out; constrained supply supports both.
Investment metrics
- 1% rule
- 0.85% ✗
- Cap rate
- 6.61%
- Cash-on-cash
- 1.13%
- DSCR
- 1.05
- GRM
- 9.8
CMA / ARV
- ARV (median comp)
- $178,553
- List price
- $150,000
- Delta
- -15.99%
- Verdict
- UNDERPRICED
- Comps
- 20 within 1.0 mi
Show comp detail 12 sales within ~0.75 mi
| Address | Dist | Beds/Ba | Sqft | Sold | Price | $/sf | Match |
|---|---|---|---|---|---|---|---|
| 621 Harrison St | 0.00mi | 4/2.0 | 1,701 (+3%) | 1mo | $115,000 | $68 | 90 |
| 622 S Washington St | 0.17mi | 3/2.0 (-1) | 1,705 (+3%) | 2mo | $259,000 | $152 | 76 |
| 405 W 6th St | 0.38mi | 5/2.0 (+1) | 1,667 (+1%) | 7mo | $232,000 | $139 | 66 |
| 640 Fulton St | 0.12mi | 3/2.0 (-1) | 1,680 (+2%) | 23mo | $195,000 | $116 | 63 |
| 402 Madison St | 0.21mi | 4/1.8 | 1,759 (+6%) | 21mo | $165,000 | $94 | 58 |
| 401 S Washington St | 0.25mi | 3/1.8 (-1) | 1,735 (+5%) | 19mo | $150,000 | $86 | 56 |
| 619 S Marion St | 0.32mi | 3/2.0 (-1) | 1,521 (-8%) | 10mo | $195,000 | $128 | 55 |
| 138 Madison St | 0.40mi | 4/2.0 | 1,429 (-13%) | 5mo | $105,000 | $73 | 51 |
| 211 Jackson St | 0.44mi | 4/1.0 | 1,459 (-12%) | 12mo | $170,000 | $117 | 50 |
| 117 Franklin St | 0.44mi | 3/3.0 (-1) | 1,678 (+2%) | 23mo | $250,000 | $149 | 45 |
| 513 E 2nd St | 0.47mi | 3/1.0 (-1) | 1,476 (-11%) | 24mo | $177,000 | $120 | 36 |
| 203 E Nothem Ave | 0.58mi | 3/1.5 (-1) | 1,512 (-8%) | 24mo | $155,000 | $103 | 32 |
Match score weights: distance 35% · size 25% · config 20% · recency 20%. Top-matched comps best support the ARV.
Projected returns pro-forma
10.0% appreciation · 3.0% rent growth · sell at horizon
- IRR
- 25.1%
- Equity multiple
- 3.00×
- Total profit
- $84,180
- Equity at exit
- $135,132
- IRR
- 22.1%
- Equity multiple
- 6.85×
- Total profit
- $245,878
- Equity at exit
- $291,417
Cash invested: $42,000 (down + closing). Projections, not guarantees.
Landlord ↔ Tenant lean methodology
- Overall (STATE)
- 83 Strongly Landlord-Friendly
- State Iowa
- 83 Strongly Landlord-Friendly · R+6
- County
- — inherits STATE
- City
- — inherits STATE
ZIP-level market 51050
- Home prices YoY
- 8.1%
- Active inventory
- 7
- Price-to-rent
- 9.8×
Monthly cashflow live
- Estimated rent
- $1,274 medium interval (Pro) →
- Mortgage (P&I)
- −$787
- Tax from tax record
- −$118 /mo · $1,420/yr
- Insurance
- −$62
- HOA
- −$0
- Vacancy / Maint / Mgmt
- −$268
- Net cashflow
- $39
Break-even live
UW: 25.0% down · 7.5% · 30yr · 1.5% tax · 5.0% vac · 8.0% maint · 8.0% mgmt
Financing live
Cash to close
- Down payment
- $37,500
- Closing costs
- $4,500
- Reserves months
- —
- Total cash needed
- —
Loan-product check · same deal, 3 products live
Conventional
25% down · 7.5% · 30yr
- Down + closing
- —
- Monthly P&I
- —
- Monthly cashflow
- —
- DSCR
- —
- Eligible?
- —
Personal DTI + credit; lowest rate.
DSCR
20% down · 8.5% · 30yr
- Down + closing
- —
- Monthly P&I
- —
- Monthly cashflow
- —
- DSCR
- —
- Eligible?
- —
No personal income docs; deal must DSCR.
Hard money
10% down · 12.0% · 12mo
- Down + closing
- —
- Monthly P&I
- —
- Monthly cashflow
- —
- DSCR
- —
- Eligible?
- —
Short-term bridge; refi at stabilization.
Listing history 2 events
-
2026-05-11status Pending 879-char remark
Show marketing remark (879 chars)
Welcome to this 4-bedroom, 2-bath home located on a large lot in Remsen. This property offers plenty of space both inside and out, making it a great opportunity for homeowners or investors alike. The home is move-in ready, with solid bones and functional layout, while still offering room for cosmetic updates to truly make it your own. Having previously been used as a rental, it presents excellent potential as a primary residence, investment property, or value-add project. Additional features include a single-car garage accessed from the alley, ample yard space, and a convenient location close to town amenities. 4 Bedrooms 2 Bathrooms Large lot Alley-access garage Former rental Selling AS-IS If you’re looking for space, potential, and value in a small-town setting, this one is worth a look! Owner has never lived in this home only used as rental.
-
2026-02-17$150,000 Active 879-char remark
Show marketing remark (879 chars)
Welcome to this 4-bedroom, 2-bath home located on a large lot in Remsen. This property offers plenty of space both inside and out, making it a great opportunity for homeowners or investors alike. The home is move-in ready, with solid bones and functional layout, while still offering room for cosmetic updates to truly make it your own. Having previously been used as a rental, it presents excellent potential as a primary residence, investment property, or value-add project. Additional features include a single-car garage accessed from the alley, ample yard space, and a convenient location close to town amenities. 4 Bedrooms 2 Bathrooms Large lot Alley-access garage Former rental Selling AS-IS If you’re looking for space, potential, and value in a small-town setting, this one is worth a look! Owner has never lived in this home only used as rental.
ⓘ Source: listings_history table (triggers on properties + properties_extension) + one-shot
backfill from property_details.listing_events for pre-trigger history.
Tax reassessment forecast IA · Partial reset (capped growth)
- Current annual tax
- $1,420 · $118/mo
- Projected year-2 tax
- $1,888 · $157/mo
- Expected delta
- +$468/yr (+$39/mo · 32.9%)
ⓘ Screening estimate from a state-policy table — verify with the county assessor before closing.
Climate risk First Street
- Flood 1/10 Low FEMA zone X (unshaded) · 0% chance over 30 yrs
- Wildfire 1/10 Low
- Heat 3/10 Moderate 7 d/yr ≥100°F today · 15 d/yr by 30 yrs out
- Wind 2/10 Low
- Air quality 1/10 Low 0 unhealthy d/yr today · 0 by 30 yrs out
Nearby sold comps map
Loading sold comps map…
Walkable amenities ~0.75 mi
Loading nearby amenities…
Taxation est. · year 1
- Rental income
- $15,294
- − Mortgage interest
- −$8,402
- − Property taxes
- −$1,420
- − Insurance
- −$750
- − Repairs & maintenance
- −$1,224
- − Management
- −$1,224
- − Depreciation
- −$4,364
- Taxable loss
- −$2,089
- Est. tax savings @ 24.0%
- +$501
- After-tax cash flow
- $974/yr
For passive investors: Depreciation is non-cash, so a rental often shows a tax loss while cash-flowing — sheltering income. Rental losses are passive: they offset passive income freely, and up to $25,000/yr can offset ordinary (W-2) income if you actively participate and your MAGI is under $100k (phasing out to $0 by $150k); unused losses carry forward. On sale, claimed depreciation is recaptured at up to 25%, and gains may owe capital-gains tax (a 1031 exchange can defer both). Figures are a year-1 estimate at your 24.0% rate — not tax advice; consult a CPA.
Schools (NCES district)
- District
- Remsen-Union Community School District
- NCES district ID
- 1924120
- Math proficiency
- 72% ▲ 8.00%
- Reading proficiency
- 79% ▲ 14.00%
- Median HH income
- $57,017
- Composite
- 64.57/100
- National rank
- #534
- State rank
- #59 of 289 in IA
Livability — Remsen
- Score
- 80/100
- State rank
- #78
- US rank
- #1646
Category grades
Schools grade is shown separately in the Schools card above.
Census & demographics
- Census place
- Remsen, IA
- Population (ZIP)
- 2,909
Population outlook (Plymouth County) Hauer SSP2
- Today (2025)
- 25,214 people
- By 2030
- 25,257 · +0.2%
- By 2040
- 25,304 · +0.4%
- By 2050
- 25,421 · +0.8%
- By 2075
- 26,820 · +6.4%
- By 2100
- 27,604 · +9.5%
Race, ethnicity, and origin ACS 2023
- Neighborhood character
- Predominantly White (90%)
- Race & ethnicity
- White 90% Hispanic / Latino 6% Two or more races 5%
- Hispanic origin (detail)
- Mexican 2%
- Common ancestry
- Iranian 3% Italian 2% Slovak 1%
- Foreign-born
- 4% · Canada
- Languages at home
- 93% English-only · Spanish 4% Other Asian/Pacific 3%
Political lean MEDSL · Plymouth
- 2024 margin
- Solid R (+54.2) · D 22.3% · R 76.5% · Other 1.2%
- 2008→2024 swing
- -29.2pp toward R · 2008: -25.1pp · 2024: -54.2pp
- All cycles
- 2024: R+54.2 2020: R+49.3 2016: R+51.9 2012: R+34.3 2008: R+25.1
Not yet ingested
- Civics
- —
Market trends
- HPI YoY
- ▲ 19.38%
- Current HPI
- 259.7886
- Rent YoY
- —
- Metro
- —
- State GDP YoY
- ▲ 2.48%
- F500 in state
- 4
Industry mix (Fortune 500 HQ in IA)
| Industry | F500 HQs | Revenue |
|---|---|---|
| Financial Services | 1 | $16B |
|
||
| Retail / Convenience | 1 | $15B |
|
||
Price history
2 events — show timeline
- 2026-05-11 Pending — NWIA
- 2026-02-17 Listed $150,000 NWIA
Property tax history
+20.2%/yrLatest (2025): $1,420 · +50.4% YoY. Source: county tax records.
Cash-flow waterfall
monthlySold comps — $/sqft
last 12 mo · ≤1 miLoading sold comps…