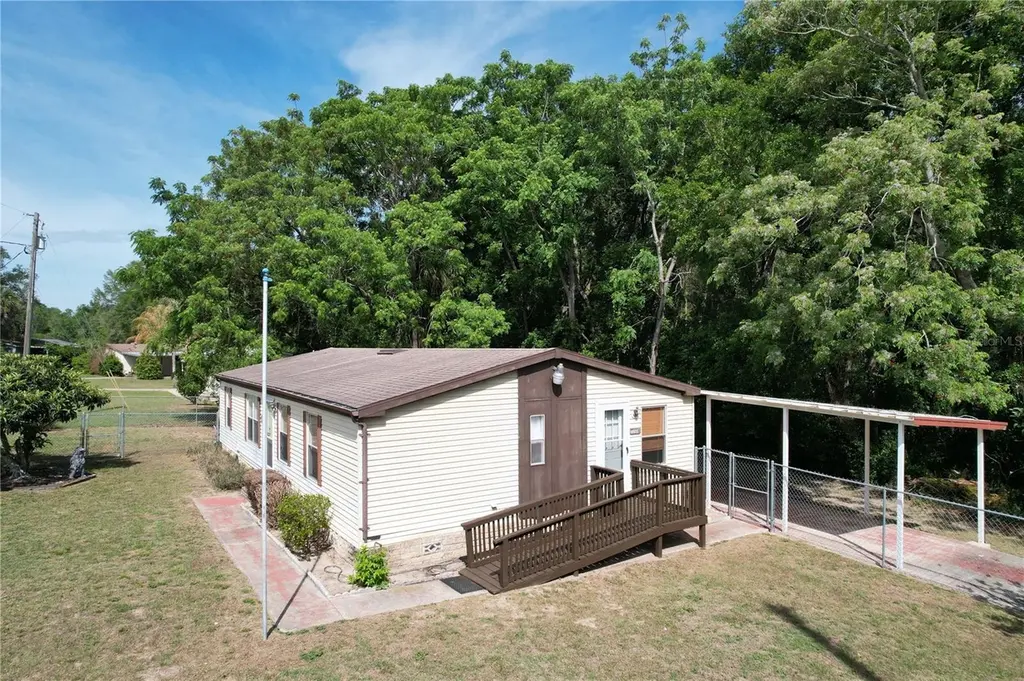
36833 Shadow Hill Dr · Fruitland Park, FL
Flood risk 1/10 · Minimal
- FEMA flood zone
- X (unshaded)
- Chance of flooding over 30 yrs
- 0.0%
- Est. flood insurance / yr
- $507 – $1,088
Fire risk 5/10 · Moderate
- Est. fire insurance / yr
- $947 – $1,759
Heat risk 8/10 · Major
- Hot days now (above 108°F)
- 7 days/yr
- Hot days in 30 yrs
- 21 days/yr
Wind risk 9/10 · Severe
- Chance of severe wind over 30 yrs
- 99.0%
Air-quality risk 3/10 · Minor
- Unhealthy air days now
- 2 days/yr
- Unhealthy air days in 30 yrs
- 4 days/yr
Risk factors via First Street. Map © Google.
Why this score? — see what drove the B- grade
The composite is a weighted blend of 9 inputs, each scored 0–100. Each bar is that input's sub-score; the figure is the points it added to the 100-point composite (weight × sub-score).
- Cash flow +24.7/30.0
- ARV discount +15.0/15.0
- DSCR +8.0/10.0
- 1% rule +5.5/10.0
- Schools +4.2/10.0
- Livability +3.5/5.0
- Rent growth +2.5/5.0
- Condition / age +2.5/5.0
- Appreciation +0.0/10.0
$184,500
🖨 Deal sheet (PDF) 📄 Offer letter ✓ Due diligence
Listing remarks
Under contract-accepting backup offers. Seller to put on NEW Architectural ROOF prior to closing! Explore this inviting home with 1,296 sq ft of functional living space, featuring 3 bedrooms and 2 bathrooms. Equipped with an HVAC system from 2010 as well as a water heater installed in 2019, this home is ready for comfortable living. Enjoy the benefits of no HOA fees, giving you the freedom of homeownership without added restrictions. Nestled in a quiet neighborhood, the property boasts a private backyard enhanced by a natural tree line providing a serene outdoor space for relaxation and gatherings. A convenient carport accommodates 2 vehicles, and the roof was updated in 2014 with an archit
Key facts
- Natural tree line
- Private backyard
- Water heater
Tags
Property features AI
Finance
- Other: Unfurnished; Homestead exempt; No lease restrictions; RM zoning; Lot size approximately 0.29 acres (quarter to less than half acre); Number of rooms: 9; Building area total reported as 1,800 square feet; living area reported as 1,296 square feet; Listing contact phone: 352-728-2121; Directions: From Fruitland Park drive north on Hwy 441/27, right on Eagles Nest, right onto Shadow Hill Drive; first house on the right.
- HOA & community: Community mailbox; Pets allowed
Exterior
- Parking: Covered parking; 2-space carport
- Security: Smoke detectors
- Utilities: Public water; Public sewer; Electricity connected; Cable connected; Water connected; Sewer connected
- Home design: Manufactured double-wide home; Single-story (one level); South-facing
- Construction: Frame construction; Shingle roof; Pillar/post/pier foundation; Built/Completed condition
- Exterior features: Enclosed patio; Patio; Side porch; Rain gutters; Sliding doors; Exterior storage shed(s); Chain link fence; Mature landscaping; Paved lot with asphalt road access; Publicly maintained road
Interior
- Kitchen: Built-in oven; Dishwasher; Refrigerator
- Bedrooms: 3 bedrooms
- Flooring: Laminate flooring; Vinyl flooring
- Bathrooms: 2 full bathrooms
- Heating & cooling: Central heating; Central air conditioning
- Interior features: Ceiling fans; Eat-in kitchen; Living room/dining room combo; Split bedroom layout; Thermostat; Vaulted ceilings; Aluminum-framed windows with blinds and curtain rods
- Laundry & utility: Washer hookup; Dryer hookup (electric); Laundry located inside with laundry closet; Electric water heater
Neighborhood map
What this means for you Summary
Snapshot
- This is a 3-bed/2.0-bath manufactured listed at $184k.
Deal economics
- At list price, monthly cash flow is $387 ($5k/yr) — positive.
- The deal already cash-flows at list — no discount required.
- Meets the 1% rule at list price ($2k rent vs $184k).
- Recommended offer: $173k (6.0% below list) — sets the bar for market timing.
- Cap rate 8.8% vs local median 4.0% in Fruitland Park — top-decile yield for the area; either an underpriced asset or a hidden risk that comps aren't pricing in. Stress-test before assuming the spread holds.
Location & tenants
- Location reads 70/100 on livability (#447 in FL) — a middle-class / working-renter tenant base. Strengths: housing A+, crime A, health & safety A-; Watch: schools D, amenities F, commute F.
- Lake (suburban): math 49% / reading 50% proficiency, ranked #37 of 73 in FL (top 51%) — families likely to look elsewhere, expect single-tenant / working-renter base with shorter leases.
- Market conditions: 165 active listings in the ZIP; 9 comparable units currently listed for rent nearby; rentals leasing fast (median 6d on market — plan ~1-2 weeks tenant-placement turnaround); 4,799 units permitted in Lake County in 2024 (814 in 5+ unit buildings).
- This rent runs 35% of the median local income ($66k/yr) — at the standard rent-burdened threshold; future hikes will face affordability resistance.
Forward outlook
- Local home prices are declining (-3.0%/yr); year-one equity from $1k of loan paydown is wiped out by about $6k of value loss. Plan a longer hold.
- Lake County population projected at +37% by 2050 — long-run rental-demand tailwind backs the buy-and-hold thesis.
Negotiation context
- It's been on market 64 days — a 6% lower offer ($173k) is reasonable based on typical stale-listing flexibility.
- Current owner paid $55k; list at $184k implies a 235% gain — meaningful room to come down on a strong offer.
Risks & watch-outs
- Climate carrying-cost: severe wind risk, 99% chance of damaging wind over 30y; moderate wildfire risk; extreme-heat days projected 7→21/yr by 2055 (HVAC capex compounding) — expect insurance premiums to compound above CPI over the hold.
Questions for the listing agent
- It's been on market 64 days. Have you received any prior offers? Is the seller open to a 6% concession, seller financing, or rate buy-down credit?
- Why hasn't it sold? Are there any deal-killer items the seller is aware of (foundation, flood, title, zoning, code violations)?
- Is there a deadline driving the sale (1031 exchange, divorce, estate, relocation)? That informs how much negotiation room exists.
- Schools are D-rated, which usually means shorter tenancies and higher turnover. Who's the typical renter profile here, and what's been the actual vacancy rate?
- What's the average days-on-market for RENTAL listings here right now (not sales)? A rising rental-DOM trend means longer vacancies and softer asking-rent achievability than the comps imply.
- What's the recent tenant-quality profile in this submarket — average credit score on applications, eviction rate, late-payment / NSF rate, and stable-employment percentage? A property-management company in the area should have these aggregated.
- How much new for-sale + rental construction is in the pipeline within 1–3 miles? Heavy new supply typically softens prices + rents 12–24 months out; constrained supply supports both.
Investment metrics
- 1% rule
- 1.05% ✓
- Cap rate
- 8.81%
- Cash-on-cash
- 8.98%
- DSCR
- 1.40
- GRM
- 8.0
CMA / ARV
- ARV (on-the-fly)
- $234,576
- Comps found
- 1
Show comp detail 1 sale within ~0.75 mi
| Address | Dist | Beds/Ba | Sqft | Sold | Price | $/sf | Match |
|---|---|---|---|---|---|---|---|
| 36812 Skycrest Blvd | 0.10mi | 3/2.0 | 1,188 (-8%) | 10mo | $215,000 | $181 | 73 |
Match score weights: distance 35% · size 25% · config 20% · recency 20%. Top-matched comps best support the ARV.
Projected returns pro-forma
-3.0% appreciation · 3.0% rent growth · sell at horizon
- IRR
- -2.7%
- Equity multiple
- 0.90×
- Total profit
- $-5,321
- Equity at exit
- $27,510
- IRR
- 6.9%
- Equity multiple
- 1.52×
- Total profit
- $26,859
- Equity at exit
- $15,952
Cash invested: $51,660 (down + closing). Projections, not guarantees.
Landlord ↔ Tenant lean methodology
- Overall (STATE)
- 87 Strongly Landlord-Friendly
- State Florida
- 87 Strongly Landlord-Friendly · R+3
- County
- — inherits STATE
- City
- — inherits STATE
ZIP-level market 34731
- Home prices YoY
- -10.1%
- Active inventory
- 165
- Price-to-rent
- 8.0×
Monthly cashflow live
- Estimated rent
- $1,930 high interval (Pro) →
- Mortgage (P&I)
- −$968
- Tax from tax record
- −$94 /mo · $1,123/yr
- Insurance
- −$77
- HOA
- −$0
- Vacancy / Maint / Mgmt
- −$405
- Net cashflow
- $387
Break-even live
Sensitivity live
| Price | -10% $491 | -5% $439 | +0% $387 | +5% $335 | +10% $282 |
|---|---|---|---|---|---|
| Rent | -10% $234 | -5% $310 | +0% $387 | +5% $463 | +10% $539 |
| Rate | -1.0pp $480 | -0.5pp $434 | base $387 | +0.5pp $339 | +1.0pp $290 |
UW: 25.0% down · 7.5% · 30yr · 1.5% tax · 5.0% vac · 8.0% maint · 8.0% mgmt
Financing live
Cash to close
- Down payment
- $46,125
- Closing costs
- $5,535
- Reserves months
- —
- Total cash needed
- —
Loan-product check · same deal, 3 products live
Conventional
25% down · 7.5% · 30yr
- Down + closing
- —
- Monthly P&I
- —
- Monthly cashflow
- —
- DSCR
- —
- Eligible?
- —
Personal DTI + credit; lowest rate.
DSCR
20% down · 8.5% · 30yr
- Down + closing
- —
- Monthly P&I
- —
- Monthly cashflow
- —
- DSCR
- —
- Eligible?
- —
No personal income docs; deal must DSCR.
Hard money
10% down · 12.0% · 12mo
- Down + closing
- —
- Monthly P&I
- —
- Monthly cashflow
- —
- DSCR
- —
- Eligible?
- —
Short-term bridge; refi at stabilization.
Rent comps 9 comps
| Address | Beds | Baths | Sqft | Rent | $/sqft | DOM | Units | Dist |
|---|---|---|---|---|---|---|---|---|
| 207 Shannon Ln Lady Lake, FL | 3.0 | 2.0 | 1744 | $1,991 | $1.14 | 5d | 1 | 0.78mi |
| 316 E Primrose Ln Lady Lake, FL | 3.0 | 1.5 | 1000 | $1,295 | $1.29 | 24d | 1 | 0.78mi |
| 1508 Spring Lake Cove Ln Fruitland Park, FL | 2.0–3.0 | 1.0–2.0 | 971 | $1,509 | $1.55 | 2d | 9 | 0.85mi |
| 735 S Highway 27/441 Lady Lake, FL | 1.0–4.0 | 1.0–3.0 | 1022 | $1,493 | $1.46 | 4d | 36 | 1.10mi |
| 1252 Vanderway Ln Lady Lake, FL | 3.0–4.0 | 2.0 | 1698 | $2,050 | $1.21 | 5d | 1 | 1.14mi |
| 36338 W Spring Lake Blvd Fruitland Park, FL | 3.0 | 2.5 | 1539 | $2,100 | $1.36 | 24d | 1 | 1.38mi |
| 606 Second Ave Lady Lake, FL | 2.0 | 2.0 | 1230 | $1,800 | $1.46 | 5d | 1 | 1.38mi |
| 1639 Spring Lake Rd Fruitland Park, FL | 3.0 | 2.0 | 1455 | $1,995 | $1.37 | 5d | 1 | 1.39mi |
| 36832 Wilmington Rd Fruitland Park, FL | 3.0 | 3.0 | 1452 | $1,800 | $1.24 | 4d | 1 | 1.48mi |
Listing history 14 events
-
2026-06-15status $184,500 Pending 64 DOM
-
2026-06-13days on market $184,500 Active 64 DOM
-
2026-06-09days on market $184,500 Active 60 DOM
-
2026-06-08days on market $184,500 Active 59 DOM
-
2026-06-07days on market $184,500 Active 58 DOM
-
2026-06-04days on market $184,500 Active 55 DOM
-
2026-06-03days on market $184,500 Active 54 DOM
-
2026-06-02days on market $184,500 Active 53 DOM
-
2026-06-01days on market $184,500 Active 52 DOM
-
2026-05-31days on market $184,500 Active 51 DOM
-
2026-04-30price $184,500
-
2026-04-10$189,900 Active
-
2004-07-08soldstatus $55,000
-
1994-05-27soldstatus $42,000
ⓘ Source: listings_history table (triggers on properties + properties_extension) + one-shot
backfill from property_details.listing_events for pre-trigger history.
Tax reassessment forecast FL · Resets to sale price
- Current annual tax
- $1,123 · $94/mo
- Projected year-2 tax
- $1,531 · $128/mo
- Expected delta
- +$408/yr (+$34/mo · 36.3%)
ⓘ Screening estimate from a state-policy table — verify with the county assessor before closing.
Climate risk First Street
- Flood 1/10 Low FEMA zone X (unshaded) · 0% chance over 30 yrs
- Wildfire 5/10 Major
- Heat 8/10 Severe 7 d/yr ≥108°F today · 21 d/yr by 30 yrs out
- Wind 9/10 Extreme 99% chance of damaging wind over 30 yrs
- Air quality 3/10 Moderate 2 unhealthy d/yr today · 4 by 30 yrs out
Nearby sold comps map
Loading sold comps map…
Walkable amenities ~0.75 mi
Loading nearby amenities…
Taxation est. · year 1
- Rental income
- $23,161
- − Mortgage interest
- −$10,335
- − Property taxes
- −$1,123
- − Insurance
- −$922
- − Repairs & maintenance
- −$1,853
- − Management
- −$1,853
- − Depreciation
- −$5,367
- Taxable income
- $1,707
- Est. tax owed @ 24.0%
- −$410
- After-tax cash flow
- $4,231/yr
For passive investors: Depreciation is non-cash, so a rental often shows a tax loss while cash-flowing — sheltering income. Rental losses are passive: they offset passive income freely, and up to $25,000/yr can offset ordinary (W-2) income if you actively participate and your MAGI is under $100k (phasing out to $0 by $150k); unused losses carry forward. On sale, claimed depreciation is recaptured at up to 25%, and gains may owe capital-gains tax (a 1031 exchange can defer both). Figures are a year-1 estimate at your 24.0% rate — not tax advice; consult a CPA.
Schools (NCES district)
- District
- Lake
- NCES district ID
- 1201050
- Math proficiency
- 49% ▼ -7.00%
- Reading proficiency
- 50% ▼ -4.00%
- Median HH income
- $46,632
- Composite
- 42.05/100
- National rank
- #3327
- State rank
- #37 of 73 in FL
Livability — Fruitland Park
- Score
- 70/100
- State rank
- #447
- US rank
- #8098
Category grades
Schools grade is shown separately in the Schools card above.
Census & demographics
- County
- Lake County · 364,602 people
- City population
- 12,196
- Metro
- Orlando-Kissimmee-Sanford, FL
- Population (ZIP)
- 12,196
- Household income
- $66,300
- Rent vs Own
- Severe rent burden
- 269.0
Population outlook (Lake County) Hauer SSP2
- Today (2025)
- 386,640 people
- By 2030
- 417,107 · +7.9%
- By 2040
- 476,676 · +23.3%
- By 2050
- 531,296 · +37.4%
- By 2075
- 648,303 · +67.7%
- By 2100
- 698,530 · +80.7%
Race, ethnicity, and origin ACS 2023
- Neighborhood character
- Predominantly White (76%)
- Race & ethnicity
- White 76% Black 11% Two or more races 11% Hispanic / Latino 3%
- Common ancestry
- Romanian 3% Serbian 2% Iranian 2%
- Foreign-born
- 5% · Canada
- Languages at home
- 98% English-only · Spanish 1% German/W. Germanic 1%
Political lean MEDSL · Lake
- 2024 margin
- Strong R (+24.7) · D 37.3% · R 62.0%
- 2008→2024 swing
- -11.2pp toward R · 2008: -13.5pp · 2024: -24.7pp
- All cycles
- 2024: R+24.7 2020: R+20.0 2016: R+23.1 2012: R+17.1 2008: R+13.5
Not yet ingested
- Civics
- —
Market trends
- HPI YoY
- ▼ -35.91%
- Current HPI
- 318.8206
- Rent YoY
- —
- Metro
- Orlando-Kissimmee-Sanford, FL
- State GDP YoY
- ▲ 3.28%
- F500 in state
- 36
Industry mix (Fortune 500 HQ in FL)
| Industry | F500 HQs | Revenue |
|---|---|---|
| Industrial Technology | 2 | $29B |
|
||
| Insurance | 2 | $17B |
|
||
| Retail | 1 | $60B |
|
||
| Technology Distribution | 1 | $58B |
|
||
| Homebuilding | 1 | $35B |
|
||
| Technology Manufacturing | 1 | $35B |
|
||
Price history
+339.3% since first listed4 events — show timeline
- 2026-04-30 Price Changed $184,500 Stellar MLS as Distributed by MLS Grid
- 2026-04-10 Listed $189,900 Stellar MLS as Distributed by MLS Grid
- 2004-07-08 Sold (Public Records) $55,000 Public Records
- 1994-05-27 Sold (Public Records) $42,000 Public Records
Property tax history
+9.0%/yrLatest (2025): $1,123 · +3.1% YoY. Source: county tax records.
Cash-flow waterfall
monthlySold comps — $/sqft
last 12 mo · ≤1 miLoading sold comps…