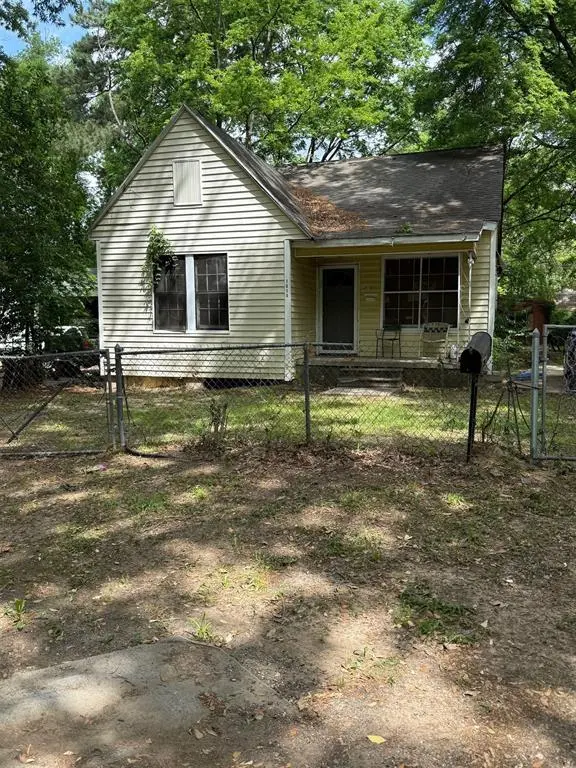
1518 Camille St · Shreveport, LA
Flood risk 1/10 · Minimal
- FEMA flood zone
- X (unshaded)
- Chance of flooding over 30 yrs
- 0.0%
- Est. flood insurance / yr
- $507 – $1,088
Fire risk 1/10 · Minimal
- Est. fire insurance / yr
- $1,269 – $2,357
Heat risk 7/10 · Major
- Hot days now (above 110°F)
- 7 days/yr
- Hot days in 30 yrs
- 20 days/yr
Wind risk 6/10 · Moderate
- Chance of severe wind over 30 yrs
- 69.0%
Air-quality risk 2/10 · Minimal
- Unhealthy air days now
- 1 days/yr
- Unhealthy air days in 30 yrs
- 1 days/yr
Risk factors via First Street. Map © Google.
Why this score? — see what drove the B- grade
The composite is a weighted blend of 9 inputs, each scored 0–100. Each bar is that input's sub-score; the figure is the points it added to the 100-point composite (weight × sub-score).
- Cash flow +30.0/30.0
- 1% rule +10.0/10.0
- DSCR +10.0/10.0
- ARV discount +9.1/15.0
- Rent growth +3.1/5.0
- Livability +3.0/5.0
- Condition / age +2.5/5.0
- Schools +2.2/10.0
- Appreciation +0.0/10.0
$30,000
🖨 Deal sheet 📄 Offer letter ✓ Due diligence
Listing remarks MLS
Check out this great investment opportunity in the Caddo Heights subdivision! This 3-bedroom, 1-bath home offers approximately 1,120 square feet and is full of potential for the right investor with vision. Whether you're looking to renovate and flip or add to your rental portfolio, this property is a promising find. Schedule your showing today! Property Sold As- Is, No Repairs Will be Made!! Seller Will have items removed from property.
Key facts
- 6,752 sq ft lot
- 2 parking spots
- Built 1993
Neighborhood map
What this means for you Summary
Snapshot
- This is a 2-bed/1.0-bath single-family listed at $30k.
Deal economics
- At list price, monthly cash flow is $501 ($6k/yr) — positive.
- The deal already cash-flows at list — no discount required.
- Meets the 1% rule at list price ($889 rent vs $30k).
- Recommended offer: $29k (3.0% below list) — sets the bar for market timing.
- Cap rate 26.3% vs local median 5.7% in Shreveport — top-decile yield for the area; either an underpriced asset or a hidden risk that comps aren't pricing in. Stress-test before assuming the spread holds.
Location & tenants
- Location reads 59/100 on livability (#270 in LA) — a working-class tenant base; expect higher turnover. Strengths: cost of living A+, housing A; Watch: schools D+, crime F, amenities F.
- Caddo Parish (urban): math 21% / reading 32% proficiency, ranked #53 of 98 in LA (top 54%) — low school quality limits family demand, transient renter base, plan for 1-2y turnover; 64% free/reduced lunch — lower-income household profile, screen leases tightly.
- Market conditions: Rents rising (+2.4%/yr); 138 active listings in the ZIP; 25 comparable units currently listed for rent nearby; rentals at typical pace (median 21d on market — plan ~3-4 weeks tenant-placement turnaround); 48% of comp listings sitting > 30 days — soft ceiling on asking rent; lower-income renter base — watch delinquency; 221 units permitted in Caddo Parish in 2024 (0 in 5+ unit buildings).
- This rent runs 33% of the median local income ($32k/yr) — at the standard rent-burdened threshold; future hikes will face affordability resistance.
Forward outlook
- Local home prices are declining (-3.0%/yr); year-one equity from $207 of loan paydown is wiped out by about $900 of value loss. Plan a longer hold.
- Caddo County population projected at -15% by 2050 — secular population decline; favor cash flow + early exit over multi-decade hold.
- At projected returns (-3.0% appreciation + 2.4% rent growth), your $8k cash investment doubles in ~2 years — after that, you're playing with house money.
Negotiation context
- It's been on market 49 days — a 3% lower offer ($29k) is reasonable based on typical stale-listing flexibility.
Risks & watch-outs
- Climate carrying-cost: major wind risk, 69% chance of damaging wind over 30y; extreme-heat days projected 7→20/yr by 2055 (HVAC capex compounding) — expect insurance premiums to compound above CPI over the hold.
Questions for the listing agent
- It's been on market 49 days. Have you received any prior offers? Is the seller open to a 3% concession, seller financing, or rate buy-down credit?
- Is there a deadline driving the sale (1031 exchange, divorce, estate, relocation)? That informs how much negotiation room exists.
- Schools are D-rated, which usually means shorter tenancies and higher turnover. Who's the typical renter profile here, and what's been the actual vacancy rate?
- Crime grade is F in this area — have there been break-ins, vandalism, or insurance claims at this property in the last 3 years? What carrier currently insures it and at what premium?
- What's the average days-on-market for RENTAL listings here right now (not sales)? A rising rental-DOM trend means longer vacancies and softer asking-rent achievability than the comps imply.
- What's the recent tenant-quality profile in this submarket — average credit score on applications, eviction rate, late-payment / NSF rate, and stable-employment percentage? A property-management company in the area should have these aggregated.
- How much new for-sale + rental construction is in the pipeline within 1–3 miles? Heavy new supply typically softens prices + rents 12–24 months out; constrained supply supports both.
Investment metrics
- 1% rule
- 2.96% ✓
- Cap rate
- 26.35%
- Cash-on-cash
- 71.62%
- DSCR
- 4.19
- GRM
- 2.8
CMA / ARV
- ARV (median comp)
- $31,072
- List price
- $30,000
- Delta
- -3.45%
- Verdict
- FAIR
- Comps
- 20 within 1.0 mi
Show comp detail 12 sales within ~0.75 mi
| Address | Dist | Beds/Ba | Sqft | Sold | Price | $/sf | Match |
|---|---|---|---|---|---|---|---|
| 4332 Magazine St | 0.21mi | 3/1.0 (+1) | 1,134 (+1%) | 13mo | $75,000 | $66 | 73 |
| 5820 2nd St | 0.51mi | 2/1.0 | 1,144 (+2%) | 2mo | $16,000 | $14 | 71 |
| 1503 Doris St | 0.22mi | 3/1.0 (+1) | 1,194 (+7%) | 13mo | $53,000 | $44 | 63 |
| 1534 Summers St | 0.36mi | 3/1.0 (+1) | 981 (-12%) | 1mo | $21,000 | $21 | 57 |
| 1439 Belwood St | 0.59mi | 3/1.0 (+1) | 1,092 (-2%) | 11mo | $79,000 | $72 | 54 |
| 1831 Hickory St | 0.40mi | 3/1.0 (+1) | 1,036 (-8%) | 12mo | $55,000 | $53 | 54 |
| 5918 Henderson Ave | 0.69mi | 3/1.0 (+1) | 1,144 (+2%) | 13mo | $45,000 | $39 | 48 |
| 559 Woodrow St | 0.46mi | 3/1.0 (+1) | 1,281 (+14%) | 4mo | $64,500 | $50 | 46 |
| 6000 Henderson Ave | 0.73mi | 3/1.0 (+1) | 1,080 (-4%) | 13mo | $45,000 | $42 | 44 |
| 6002 Henderson Ave | 0.73mi | 3/1.0 (+1) | 1,080 (-4%) | 13mo | $45,000 | $42 | 44 |
| 5203 Bienville Ave | 0.64mi | 2/1.0 | 987 (-12%) | 7mo | $24,900 | $25 | 44 |
| 2026 Murray St | 0.73mi | 3/1.0 (+1) | 982 (-12%) | 12mo | $29,900 | $30 | 30 |
Match score weights: distance 35% · size 25% · config 20% · recency 20%. Top-matched comps best support the ARV.
Projected returns pro-forma
-3.0% appreciation · 2.37% rent growth · sell at horizon
- IRR
- 70.6%
- Equity multiple
- 4.16×
- Total profit
- $26,518
- Equity at exit
- $4,473
- IRR
- 74.4%
- Equity multiple
- 8.38×
- Total profit
- $61,975
- Equity at exit
- $2,594
Cash invested: $8,400 (down + closing). Projections, not guarantees.
Landlord ↔ Tenant lean methodology
- Overall (STATE)
- 90 Strongly Landlord-Friendly
- State Louisiana
- 90 Strongly Landlord-Friendly · R+12
- County
- — inherits STATE
- City
- — inherits STATE
ZIP-level market 71108
- Rents YoY
- 2.4%
- Active inventory
- 138
- Price-to-rent
- 2.8×
Monthly cashflow live
- Estimated rent
- $889 high interval (Pro) →
- Mortgage (P&I)
- −$157
- Tax from tax record
- −$31 /mo · $370/yr
- Insurance
- −$12
- HOA
- −$0
- Vacancy / Maint / Mgmt
- −$187
- Net cashflow
- $501
Break-even live
UW: 25.0% down · 7.5% · 30yr · 1.5% tax · 5.0% vac · 8.0% maint · 8.0% mgmt
Financing live
Cash to close
- Down payment
- $7,500
- Closing costs
- $900
- Reserves months
- —
- Total cash needed
- —
Loan-product check · same deal, 3 products live
Conventional
25% down · 7.5% · 30yr
- Down + closing
- —
- Monthly P&I
- —
- Monthly cashflow
- —
- DSCR
- —
- Eligible?
- —
Personal DTI + credit; lowest rate.
DSCR
20% down · 8.5% · 30yr
- Down + closing
- —
- Monthly P&I
- —
- Monthly cashflow
- —
- DSCR
- —
- Eligible?
- —
No personal income docs; deal must DSCR.
Hard money
10% down · 12.0% · 12mo
- Down + closing
- —
- Monthly P&I
- —
- Monthly cashflow
- —
- DSCR
- —
- Eligible?
- —
Short-term bridge; refi at stabilization.
Rent comps 25 comps
| Address | Beds | Baths | Sqft | Rent | $/sqft | DOM | Units | Dist |
|---|---|---|---|---|---|---|---|---|
| 1416 Natalie St Shreveport, LA | 3.0 | 2.0 | 1100 | $900 | $0.82 | 13d | 1 | 0.17mi |
| 1421 Clover St Shreveport, LA | 2.0 | 1.0 | 900 | $675 | $0.75 | 13d | 1 | 0.29mi |
| 1430 Grigsby St Shreveport, LA | 3.0 | 1.0 | 1052 | $775 | $0.74 | 43d | 1 | 0.44mi |
| 1632 Malcolm St Shreveport, LA | 3.0 | 1.0 | 1254 | $1,150 | $0.92 | 21d | 1 | 0.50mi |
| 1954 State St Shreveport, LA | 3.0 | 1.0 | 900 | $900 | $1.00 | 43d | 1 | 0.55mi |
| 1340 Lincoln St Shreveport, LA | 2.0 | 1.0 | 1120 | $850 | $0.76 | 13d | 1 | 0.64mi |
| 1340 Lincoln St Shreveport, LA | 2.0 | 1.0 | 1120 | $950 | $0.85 | 43d | 1 | 0.64mi |
| 6002 Henderson Ave Shreveport, LA | 3.0 | 1.0 | 1059 | $1,050 | $0.99 | 43d | 1 | 0.75mi |
| 5218 Fairfax Ave Shreveport, LA | 2.0 | 1.0 | 971 | $825 | $0.85 | 21d | 1 | 0.76mi |
| 513 Sassafras Ave Shreveport, LA | 3.0 | 1.0 | 960 | $870 | $0.91 | 21d | 1 | 0.92mi |
| 3802 Baltimore Ave Shreveport, LA | 2.0 | 1.0 | 1250 | $1,025 | $0.82 | 21d | 1 | 0.92mi |
| 3827 Maryland Ave Shreveport, LA | 2.0 | 1.0 | 1032 | $1,400 | $1.36 | 43d | 1 | 0.94mi |
| 2641 Valley Ridge Rd Shreveport, LA | 3.0 | 1.0 | 1045 | $725 | $0.69 | 21d | 1 | 1.01mi |
| 3820 Fairfield Ave Unit 37 Shreveport, LA | 2.0 | 2.0 | 1084 | $1,050 | $0.97 | 43d | 1 | 1.05mi |
| 2531 Drexel St Shreveport, LA | 3.0 | 2.0 | 1250 | $950 | $0.76 | 21d | 1 | 1.07mi |
| 3730 Fairfield Ave Shreveport, LA | 1.0 | 1.0 | 783 | $1,088 | $1.39 | 21d | 1 | 1.14mi |
| 223 W 69th St Shreveport, LA | 2.0 | 1.0 | 990 | $750 | $0.76 | 43d | 1 | 1.19mi |
| 3846 Creswell Ave Unit 3848 Shreveport, LA | 2.0 | 2.0 | 1374 | $1,125 | $0.82 | 13d | 1 | 1.20mi |
| 3840 Creswell Ave Unit 1 Shreveport, LA | 2.0 | 1.5 | 1200 | $1,000 | $0.83 | 43d | 1 | 1.22mi |
| 749 W 68th St Shreveport, LA | 3.0 | 1.0 | 1232 | $800 | $0.65 | 43d | 1 | 1.26mi |
| 926 Elmwood St Unit 928 Shreveport, LA | 1.0 | 1.0 | 900 | $695 | $0.77 | 43d | 1 | 1.30mi |
| 5306 Prentiss Ave Shreveport, LA | 3.0 | 1.0 | 957 | $975 | $1.02 | 43d | 1 | 1.41mi |
| 2721 Sunnybrook St Shreveport, LA | 3.0 | 1.0 | 913 | $1,000 | $1.10 | 43d | 1 | 1.45mi |
| 2520 Merwin St Shreveport, LA | 3.0 | 1.0 | 924 | $700 | $0.76 | 21d | 1 | 1.48mi |
| 2714 DuPont St Shreveport, LA | 2.0 | 1.0 | 980 | $565 | $0.58 | 13d | 1 | 1.49mi |
Listing history 5 events
-
2026-06-01days on market $30,000 Active 49 DOM
-
2026-05-31days on market $30,000 Active 48 DOM
-
2026-05-30days on market $30,000 Active 47 DOM
-
2026-03-31$30,000 Active 440-char remark
Show marketing remark (440 chars)
Check out this great investment opportunity in the Caddo Heights subdivision! This 3-bedroom, 1-bath home offers approximately 1,120 square feet and is full of potential for the right investor with vision. Whether you're looking to renovate and flip or add to your rental portfolio, this property is a promising find. Schedule your showing today! Property Sold As- Is, No Repairs Will be Made!! Seller Will have items removed from property.
-
2002-10-28soldstatus
ⓘ Source: listings_history table (triggers on properties + properties_extension) + one-shot
backfill from property_details.listing_events for pre-trigger history.
Tax reassessment forecast LA · Resets to sale price
- Current annual tax
- $370 · $31/mo
- Projected year-2 tax
- $370 · $31/mo
- Expected delta
- $0/yr ($0/mo · 0.0%)
ⓘ Screening estimate from a state-policy table — verify with the county assessor before closing.
Climate risk First Street
- Flood 1/10 Low FEMA zone X (unshaded) · 0% chance over 30 yrs
- Wildfire 1/10 Low
- Heat 7/10 Severe 7 d/yr ≥110°F today · 20 d/yr by 30 yrs out
- Wind 6/10 Major 69% chance of damaging wind over 30 yrs
- Air quality 2/10 Low 1 unhealthy d/yr today · 1 by 30 yrs out
Nearby sold comps map
Loading sold comps map…
Walkable amenities ~0.75 mi
Loading nearby amenities…
Taxation est. · year 1
- Rental income
- $10,662
- − Mortgage interest
- −$1,680
- − Property taxes
- −$370
- − Insurance
- −$150
- − Repairs & maintenance
- −$853
- − Management
- −$853
- − Depreciation
- −$873
- Taxable income
- $5,884
- Est. tax owed @ 24.0%
- −$1,412
- After-tax cash flow
- $4,604/yr
For passive investors: Depreciation is non-cash, so a rental often shows a tax loss while cash-flowing — sheltering income. Rental losses are passive: they offset passive income freely, and up to $25,000/yr can offset ordinary (W-2) income if you actively participate and your MAGI is under $100k (phasing out to $0 by $150k); unused losses carry forward. On sale, claimed depreciation is recaptured at up to 25%, and gains may owe capital-gains tax (a 1031 exchange can defer both). Figures are a year-1 estimate at your 24.0% rate — not tax advice; consult a CPA.
Schools (NCES district)
- District
- Caddo Parish
- NCES district ID
- 2200300
- Math proficiency
- 21% ▼ -33.00%
- Reading proficiency
- 32% ▼ -30.00%
- Median HH income
- $39,227
- Composite
- 22.23/100
- National rank
- #8148
- State rank
- #53 of 98 in LA
Livability — Shreveport
- Score
- 59/100
- State rank
- #270
- US rank
- #19730
Category grades
Schools grade is shown separately in the Schools card above.
Census & demographics
- Census place
- Shreveport, LA
- County
- Caddo Parish · 178,536 people
- City population
- 164,123
- Metro
- Shreveport-Bossier City, LA
- Population (ZIP)
- 18,072
- Household income
- $32,055
- Rent vs Own
- Severe rent burden
- 1526.0
Population outlook (Caddo County) Hauer SSP2
- Today (2025)
- 243,190 people
- By 2030
- 237,231 · -2.5%
- By 2040
- 222,502 · -8.5%
- By 2050
- 206,516 · -15.1%
- By 2075
- 165,706 · -31.9%
- By 2100
- 122,262 · -49.7%
Race, ethnicity, and origin ACS 2023
- Neighborhood character
- Predominantly Black (83%)
- Race & ethnicity
- Black 83% White 11% Hispanic / Latino 4% Two or more races 2%
- Foreign-born
- 2% · Canada
- Languages at home
- 96% English-only · Spanish 3%
Political lean MEDSL · Caddo
- 2024 margin
- Toss-up / Even · D 51.6% · R 47.0% · Other 1.4%
- 2008→2024 swing
- +1.6pp toward D · 2008: 3.0pp · 2024: 4.6pp
- All cycles
- 2024: D+4.6 2020: D+6.8 2016: D+4.2 2012: D+4.9 2008: D+3.0
Not yet ingested
- Civics
- —
Market trends
- HPI YoY
- ▼ -58.98%
- Current HPI
- 58.1377
- Rent YoY
- ▲ 2.37%
- Metro
- Shreveport-Bossier City, LA
- State GDP YoY
- ▲ 3.29%
- F500 in state
- 10
Industry mix (Fortune 500 HQ in LA)
| Industry | F500 HQs | Revenue |
|---|---|---|
| Telecommunications | 2 | $23B |
|
||
| Utilities | 1 | $12B |
|
||
| Wholesale / Distribution | 1 | $5B |
|
||
| Advertising | 1 | $2B |
|
||
Price history
2 events — show timeline
- 2026-03-31 Listed $30,000 NTREIS
- 2002-10-28 Sold (Public Records) — Public Records
Property tax history
-3.0%/yrLatest (2025): $370 · +0.4% YoY. Source: county tax records.
Cash-flow waterfall
monthlySold comps — $/sqft
last 12 mo · ≤1 miLoading sold comps…