 Multi-family
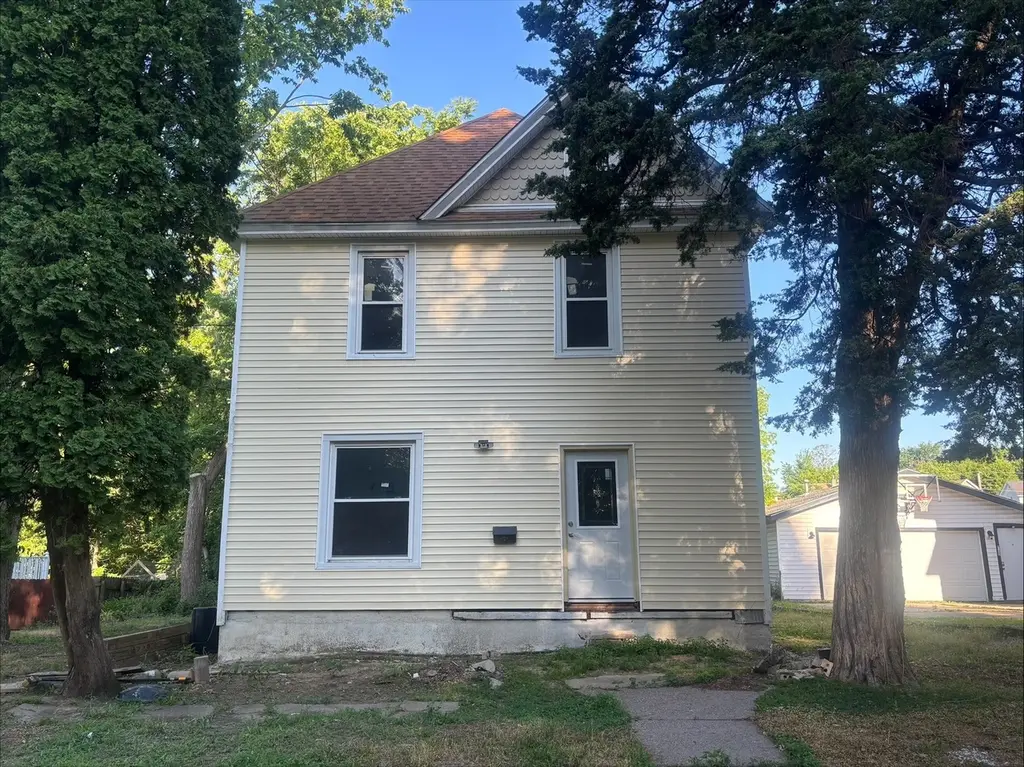
1110 Oneida Ave · Davenport, IA
Flood risk 1/10 · Minimal
- FEMA flood zone
- X (unshaded)
- Chance of flooding over 30 yrs
- 0.0%
- Est. flood insurance / yr
- $473 – $860
Fire risk 1/10 · Minimal
- Est. fire insurance / yr
- $902 – $1,676
Heat risk 3/10 · Minor
- Hot days now (above 103°F)
- 7 days/yr
- Hot days in 30 yrs
- 15 days/yr
Wind risk 2/10 · Minimal
- Chance of severe wind over 30 yrs
- —
Air-quality risk 3/10 · Minor
- Unhealthy air days now
- 2 days/yr
- Unhealthy air days in 30 yrs
- 3 days/yr
Risk factors via First Street. Map © Google.
Why this score? — see what drove the B grade
The composite is a weighted blend of 9 inputs, each scored 0–100. Each bar is that input's sub-score; the figure is the points it added to the 100-point composite (weight × sub-score).
- Cash flow +30.0/30.0
- 1% rule +10.0/10.0
- DSCR +10.0/10.0
- ARV discount +7.5/15.0
- Livability +4.0/5.0
- Schools +3.9/10.0
- Rent growth +3.6/5.0
- Condition / age +2.5/5.0
- Appreciation +0.0/10.0
$54,900
🖨 Deal sheet 📄 Offer letter ✓ Due diligence
Multi-family units
County records classify this as Multi-Family (2-4 Unit). Listing-text estimate: 1 unit. estimate disagrees with records
Listing remarks MLS
New Listing in Davenport is looking for its next owner.3 bedroom 2 story home with level yard. Property is being sold in AS - IS condition. This property is eligible under the First Look Initiative. All Owner Occupant offers will be responded to after 7 days on the market and Investor offers will be responded to after 30 days. However, all offers can be submitted during the First Look period.
Key facts
- 0.4 acre lot
- 3 parking spots
- Built 1900
Property features AI
Finance
- HOA & community: No master association fees required
Exterior
- Parking: Off-street parking for 3 vehicles
- Utilities: Public water; Public sewer
- Home design: Detached single-family home; 2-story layout; Fee simple ownership; Over 100 years old
- Construction: Aluminum siding; Asphalt roof; Concrete perimeter foundation; Approximately 1,764 total building square feet; Total finished/unfinished area about 2,772
- Exterior features: Mature trees on the lot; Lot dimensions approximately 68 x 256
Interior
- Kitchen: Kitchen with eating area/table space
- Bedrooms: 4 bedrooms (Master bedroom on second level; three additional bedrooms on second level)
- Flooring: Hardwood flooring in multiple main and second-level rooms; Carpet in one bedroom; Other flooring in kitchen and one bedroom
- Bathrooms: 2 full bathrooms
- Heating & cooling: Natural gas forced air heating
- Interior features: 8 total rooms; Separate dining room; Unfinished full basement
- Laundry & utility: Laundry room
Neighborhood map
What this means for you Summary
Snapshot
- This is a 3-bed/3.0-bath multifamily listed at $55k.
Deal economics
- At list price, monthly cash flow is $1k ($16k/yr) — positive.
- The deal already cash-flows at list — no discount required.
- Meets the 1% rule at list price ($2k rent vs $55k).
- Cap rate 36.3% vs local median 4.4% in Davenport — top-decile yield for the area; either an underpriced asset or a hidden risk that comps aren't pricing in. Stress-test before assuming the spread holds.
Location & tenants
- Location reads 79/100 on livability (#126 in IA, #2,312 nationally) — a middle-class / working-renter tenant base. Strengths: cost of living A+, housing A+, health & safety A+; Watch: employment C-, crime F.
- Davenport Community School District (urban): math 43% / reading 50% proficiency, ranked #288 of 289 in IA (top 100%) — families likely to look elsewhere, expect single-tenant / working-renter base with shorter leases.
- Zoned schools: Mckinley Elementary School (math 51% / reading 60%, grade C, #457 of 616 statewide, top 74%, 413 students, 48% FRL); Central High School (math 45% / reading 64%, grade C-, #290 of 336 statewide, top 87%, 1,505 students, 47% FRL).
- Market conditions: Rents rising fast (+4.6%/yr); 160 active listings in the ZIP; 20 comparable units currently listed for rent nearby; rentals lingering (median 44d on market — plan ~5-8 weeks vacancy on turnover, expect pricing pressure); 60% of comp listings sitting > 30 days — soft ceiling on asking rent; 805 units permitted in Scott County in 2024 (479 in 5+ unit buildings).
- This rent runs 42% of the median local income ($65k/yr) — at the standard rent-burdened threshold; future hikes will face affordability resistance.
Forward outlook
- Local home prices are declining (-3.0%/yr); year-one equity from $380 of loan paydown is wiped out by about $2k of value loss. Plan a longer hold.
- Scott County population projected at +19% by 2050 — long-run rental-demand tailwind backs the buy-and-hold thesis.
- At projected returns (-3.0% appreciation + 4.6% rent growth), your $15k cash investment doubles in ~2 years — after that, you're playing with house money.
Negotiation context
- Only 2 days on market — expect competitive offers; lowballing is unlikely to land.
- 3 sale attempts since 2y ago with the ask held roughly flat each time — persistent listings suggest the price (not the market) is what's stuck; bring a comps-based counter.
- Current owner paid $35k; list at $55k implies a 57% gain — meaningful room to come down on a strong offer.
Risks & watch-outs
- Watch-outs: built in 1900 — expect roof / HVAC / electrical / plumbing capex.
Questions for the listing agent
- Built in 1900 — when were the roof, HVAC, electrical panel, plumbing, and water heater last replaced?
- Is there a deadline driving the sale (1031 exchange, divorce, estate, relocation)? That informs how much negotiation room exists.
- Crime grade is F in this area — have there been break-ins, vandalism, or insurance claims at this property in the last 3 years? What carrier currently insures it and at what premium?
- What's the average days-on-market for RENTAL listings here right now (not sales)? A rising rental-DOM trend means longer vacancies and softer asking-rent achievability than the comps imply.
- What's the recent tenant-quality profile in this submarket — average credit score on applications, eviction rate, late-payment / NSF rate, and stable-employment percentage? A property-management company in the area should have these aggregated.
- How much new apartment / multifamily construction is in the pipeline within 1–3 miles? Heavy new supply (>2% of stock underway) typically softens rents 12–24 months out; light construction supports rent growth.
Investment metrics
- 1% rule
- 4.15% ✓
- Cap rate
- 36.35%
- Cash-on-cash
- 107.33%
- DSCR
- 5.78
- GRM
- 2.0
CMA / ARV
No comps found within radius.
Projected returns pro-forma
-3.0% appreciation · 4.57% rent growth · sell at horizon
- IRR
- —
- Equity multiple
- 6.36×
- Total profit
- $82,386
- Equity at exit
- $8,186
- IRR
- —
- Equity multiple
- 14.03×
- Total profit
- $200,226
- Equity at exit
- $4,747
Cash invested: $15,372 (down + closing). Projections, not guarantees.
Landlord ↔ Tenant lean methodology
- Overall (STATE)
- 83 Strongly Landlord-Friendly
- State Iowa
- 83 Strongly Landlord-Friendly · R+6
- County
- — inherits STATE
- City
- — inherits STATE
ZIP-level market 52803
- Home prices YoY
- -34.5%
- Rents YoY
- 4.6%
- Active inventory
- 160
- Price-to-rent
- 4.0×
Monthly cashflow live
- Estimated rent
- $2,277 high interval (Pro) →
- Mortgage (P&I)
- −$288
- Tax from tax record
- −$113 /mo · $1,358/yr
- Insurance
- −$23
- HOA
- −$0
- Vacancy / Maint / Mgmt
- −$478
- Net cashflow
- $1,375
Break-even live
2-unit breakdown (identical units grouped — click to expand)
| Units | Beds | Baths | Est. rent |
|---|---|---|---|
| 2× units | 3 | 2 | $2,278 |
| #1 | 3 | 2 | $1,139 |
| #2 | 3 | 2 | $1,139 |
| Total (2 units) | $2,277 | ||
UW: 25.0% down · 7.5% · 30yr · 1.5% tax · 5.0% vac · 8.0% maint · 8.0% mgmt
Financing live
Cash to close
- Down payment
- $13,725
- Closing costs
- $1,647
- Reserves months
- —
- Total cash needed
- —
Loan-product check · same deal, 3 products live
Conventional
25% down · 7.5% · 30yr
- Down + closing
- —
- Monthly P&I
- —
- Monthly cashflow
- —
- DSCR
- —
- Eligible?
- —
Personal DTI + credit; lowest rate.
DSCR
20% down · 8.5% · 30yr
- Down + closing
- —
- Monthly P&I
- —
- Monthly cashflow
- —
- DSCR
- —
- Eligible?
- —
No personal income docs; deal must DSCR.
Hard money
10% down · 12.0% · 12mo
- Down + closing
- —
- Monthly P&I
- —
- Monthly cashflow
- —
- DSCR
- —
- Eligible?
- —
Short-term bridge; refi at stabilization.
Rent comps 20 comps
| Address | Beds | Baths | Sqft | Rent | $/sqft | DOM | Units | Dist |
|---|---|---|---|---|---|---|---|---|
| 1017 E 13th St Unit 1017 Davenport, IA | 2.0 | 1.0 | 1335 | $950 | $0.71 | 21d | 1 | 0.12mi |
| 736 Federal St Davenport, IA | 1.0–3.0 | 1.0–2.0 | 1186 | $1,868 | $1.57 | 21d | 1 | 0.43mi |
| 616 E 6th St Davenport, IA | 4.0 | 1.0 | 1578 | $1,712 | $1.08 | 43d | 1 | 0.45mi |
| 1527 Fulton Ct Davenport, IA | 4.0 | 2.0 | 1850 | $1,775 | $0.96 | 43d | 1 | 0.53mi |
| 317 Kirkwood Blvd Davenport, IA | 2.0 | 1.0 | 1300 | $950 | $0.73 | 43d | 1 | 0.64mi |
| 119 E 13th St Davenport, IA | 3.0 | 1.0 | 1728 | $1,495 | $0.87 | 43d | 1 | 0.70mi |
| 511 Pershing Ave Unit 301E Davenport, IA | 3.0 | 2.0 | 1429 | $2,126 | $1.49 | 43d | 1 | 0.70mi |
| 511 Pershing Ave Unit 106E Davenport, IA | 3.0 | 2.0 | 1349 | $1,996 | $1.48 | 43d | 1 | 0.70mi |
| 511 Pershing Ave Unit 101W Davenport, IA | 2.0 | 1.0 | 1280 | $1,704 | $1.33 | 43d | 1 | 0.70mi |
| 427 Pershing Ave Davenport, IA | 3.0 | 2.0 | 1438 | $2,288 | $1.59 | 13d | 3 | 0.72mi |
| 1421 N Main St #2 Davenport, IA | 3.0 | 1.0 | 1350 | $1,095 | $0.81 | 43d | 1 | 0.83mi |
| 212 N Brady St Davenport, IA | 2.0–3.0 | 2.0–3.0 | 1428 | $2,600 | $1.82 | 13d | 4 | 0.98mi |
| 1511 N Ripley St Davenport, IA | 4.0 | 2.0 | 1872 | $1,450 | $0.77 | 21d | 1 | 1.00mi |
| 2220 E Lombard St Davenport, IA | 3.0 | 2.0 | 1500 | $1,620 | $1.08 | 43d | 1 | 1.12mi |
| 537 W 16th St Davenport, IA | 3.0 | 1.0 | 1311 | $1,400 | $1.07 | 43d | 1 | 1.16mi |
| 1323 N Gaines St Davenport, IA | 4.0 | 2.0 | 1733 | $1,350 | $0.78 | 21d | 1 | 1.18mi |
| 621 W 15th St Davenport, IA | 4.0 | 2.0 | 1833 | $1,500 | $0.82 | 13d | 1 | 1.19mi |
| 1315 Brown St Unit 2 Davenport, IA | 3.0 | 1.0 | 1300 | $1,250 | $0.96 | 21d | 1 | 1.26mi |
| 915 W 14th St Davenport, IA | 3.0 | 1.0 | 1390 | $900 | $0.65 | 43d | 1 | 1.39mi |
| 320 E 29th St Davenport, IA | 2.0 | 2.5 | 1450 | $1,750 | $1.21 | 43d | 1 | 1.39mi |
Listing history 7 events
-
2026-05-26$54,900 Active
-
2024-11-13soldstatus $35,000 Closed 396-char remark
Show marketing remark (396 chars)
New Listing in Davenport is looking for its next owner.3 bedroom 2 story home with level yard. Property is being sold in AS - IS condition. This property is eligible under the First Look Initiative. All Owner Occupant offers will be responded to after 7 days on the market and Investor offers will be responded to after 30 days. However, all offers can be submitted during the First Look period.
-
2024-11-13soldstatus $35,000 396-char remark
Show marketing remark (396 chars)
New Listing in Davenport is looking for its next owner.3 bedroom 2 story home with level yard. Property is being sold in AS - IS condition. This property is eligible under the First Look Initiative. All Owner Occupant offers will be responded to after 7 days on the market and Investor offers will be responded to after 30 days. However, all offers can be submitted during the First Look period.
-
2024-10-27status Pending 396-char remark
Show marketing remark (396 chars)
New Listing in Davenport is looking for its next owner.3 bedroom 2 story home with level yard. Property is being sold in AS - IS condition. This property is eligible under the First Look Initiative. All Owner Occupant offers will be responded to after 7 days on the market and Investor offers will be responded to after 30 days. However, all offers can be submitted during the First Look period.
-
2024-09-11price $40,000 396-char remark
Show marketing remark (396 chars)
New Listing in Davenport is looking for its next owner.3 bedroom 2 story home with level yard. Property is being sold in AS - IS condition. This property is eligible under the First Look Initiative. All Owner Occupant offers will be responded to after 7 days on the market and Investor offers will be responded to after 30 days. However, all offers can be submitted during the First Look period.
-
2024-07-25$45,000 Active 396-char remark
Show marketing remark (396 chars)
New Listing in Davenport is looking for its next owner.3 bedroom 2 story home with level yard. Property is being sold in AS - IS condition. This property is eligible under the First Look Initiative. All Owner Occupant offers will be responded to after 7 days on the market and Investor offers will be responded to after 30 days. However, all offers can be submitted during the First Look period.
-
2024-07-25$40,000 396-char remark
Show marketing remark (396 chars)
New Listing in Davenport is looking for its next owner.3 bedroom 2 story home with level yard. Property is being sold in AS - IS condition. This property is eligible under the First Look Initiative. All Owner Occupant offers will be responded to after 7 days on the market and Investor offers will be responded to after 30 days. However, all offers can be submitted during the First Look period.
ⓘ Source: listings_history table (triggers on properties + properties_extension) + one-shot
backfill from property_details.listing_events for pre-trigger history.
Tax reassessment forecast IA · Partial reset (capped growth)
- Current annual tax
- $1,358 · $113/mo
- Projected year-2 tax
- $1,358 · $113/mo
- Expected delta
- $0/yr ($0/mo · 0.0%)
ⓘ Screening estimate from a state-policy table — verify with the county assessor before closing.
Climate risk First Street
- Flood 1/10 Low FEMA zone X (unshaded) · 0% chance over 30 yrs
- Wildfire 1/10 Low
- Heat 3/10 Moderate 7 d/yr ≥103°F today · 15 d/yr by 30 yrs out
- Wind 2/10 Low
- Air quality 3/10 Moderate 2 unhealthy d/yr today · 3 by 30 yrs out
Nearby sold comps map
Loading sold comps map…
Walkable amenities ~0.75 mi
Loading nearby amenities…
Taxation est. · year 1
- Rental income
- $27,324
- − Mortgage interest
- −$3,075
- − Property taxes
- −$1,358
- − Insurance
- −$274
- − Repairs & maintenance
- −$2,186
- − Management
- −$2,186
- − Depreciation
- −$1,597
- Taxable income
- $16,647
- Est. tax owed @ 24.0%
- −$3,995
- After-tax cash flow
- $12,503/yr
For passive investors: Depreciation is non-cash, so a rental often shows a tax loss while cash-flowing — sheltering income. Rental losses are passive: they offset passive income freely, and up to $25,000/yr can offset ordinary (W-2) income if you actively participate and your MAGI is under $100k (phasing out to $0 by $150k); unused losses carry forward. On sale, claimed depreciation is recaptured at up to 25%, and gains may owe capital-gains tax (a 1031 exchange can defer both). Figures are a year-1 estimate at your 24.0% rate — not tax advice; consult a CPA.
Schools (NCES district)
- District
- Davenport Community School District
- NCES district ID
- 1908580
- Math proficiency
- 43% ▼ -11.00%
- Reading proficiency
- 50% ▼ -3.00%
- Median HH income
- $46,157
- Composite
- 39.49/100
- National rank
- #3951
- State rank
- #288 of 289 in IA
Livability — Davenport
- Score
- 79/100
- State rank
- #126
- US rank
- #2312
Category grades
Schools grade is shown separately in the Schools card above.
Census & demographics
- Census place
- Davenport, IA
- County
- Scott County · 144,583 people
- City population
- 103,319
- Metro
- Davenport-Moline-Rock Island, IA-IL
- Population (ZIP)
- 22,742
- Household income
- $64,543
- Rent vs Own
- Severe rent burden
- 630.0
Population outlook (Scott County) Hauer SSP2
- Today (2025)
- 188,878 people
- By 2030
- 196,648 · +4.1%
- By 2040
- 210,860 · +11.6%
- By 2050
- 224,359 · +18.8%
- By 2075
- 258,884 · +37.1%
- By 2100
- 286,447 · +51.7%
Race, ethnicity, and origin ACS 2023
- Neighborhood character
- Predominantly White (69%)
- Race & ethnicity
- White 69% Black 14% Two or more races 10% Hispanic / Latino 9%
- Hispanic origin (detail)
- Mexican 7%
- Common ancestry
- Romanian 2% Portuguese 2% Iranian 2%
- Foreign-born
- 5% · Canada, United Kingdom, South Korea
- Languages at home
- 93% English-only · Spanish 4% French/Haitian/Cajun 1%
Political lean MEDSL · Scott
- 2024 margin
- Toss-up / Even · D 47.3% · R 51.2% · Other 1.4%
- 2008→2024 swing
- -18.4pp toward R · 2008: 14.6pp · 2024: -3.9pp
- All cycles
- 2024: R+3.9 2020: D+3.5 2016: D+1.4 2012: D+13.8 2008: D+14.6
Not yet ingested
- Civics
- —
Market trends
- HPI YoY
- ▼ -96.00%
- Current HPI
- 182.0976
- Rent YoY
- ▲ 4.57%
- Metro
- Davenport-Moline-Rock Island, IA-IL
- State GDP YoY
- ▲ 2.48%
- F500 in state
- 4
Industry mix (Fortune 500 HQ in IA)
| Industry | F500 HQs | Revenue |
|---|---|---|
| Financial Services | 1 | $16B |
|
||
| Retail / Convenience | 1 | $15B |
|
||
Price history
+22.0% since first listed7 events — show timeline
- 2026-05-26 Listed $54,900 MRED as Distributed by MLS Grid
- 2024-11-13 Sold (MLS) $35,000 MRED as Distributed by MLS Grid
- 2024-11-13 Sold (MLS) $35,000 RMLSA as Distributed by MLS Grid
- 2024-10-27 Pending — RMLSA as Distributed by MLS Grid
- 2024-09-11 Price Changed $40,000 RMLSA as Distributed by MLS Grid
- 2024-07-25 Listed $40,000 MRED as Distributed by MLS Grid
- 2024-07-25 Listed $45,000 RMLSA as Distributed by MLS Grid
Property tax history
+2.8%/yrLatest (2025): $1,358 · +2.4% YoY. Source: county tax records.
Cash-flow waterfall
monthlySold comps — $/sqft
last 12 mo · ≤1 miLoading sold comps…