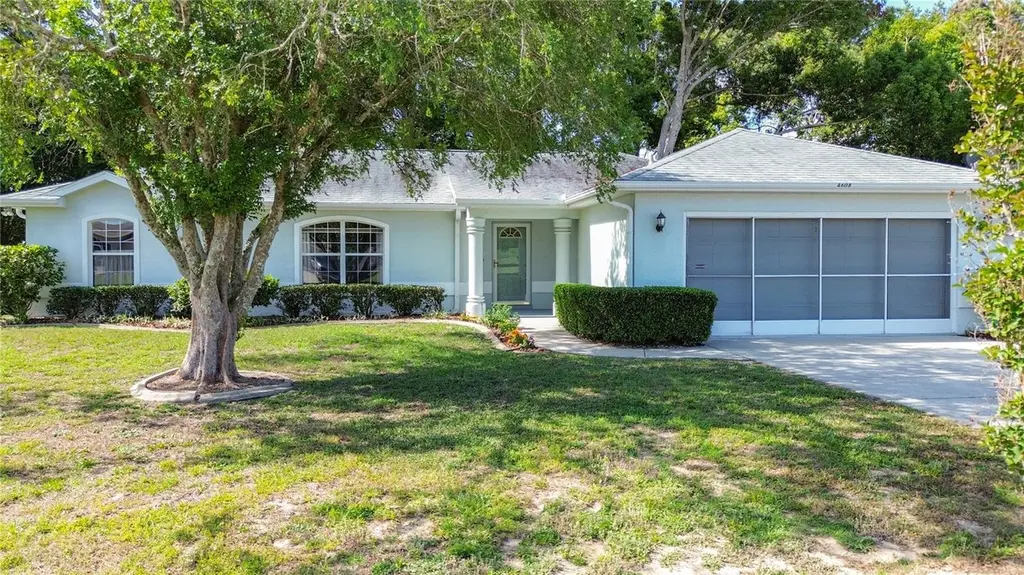
4608 NW 30th Pl · Ocala, FL
Flood risk 1/10 · Minimal
- FEMA flood zone
- X (unshaded)
- Chance of flooding over 30 yrs
- 0.0%
- Est. flood insurance / yr
- $507 – $1,088
Fire risk 5/10 · Moderate
- Est. fire insurance / yr
- $947 – $1,759
Heat risk 8/10 · Major
- Hot days now (above 107°F)
- 7 days/yr
- Hot days in 30 yrs
- 22 days/yr
Wind risk 9/10 · Severe
- Chance of severe wind over 30 yrs
- 99.0%
Air-quality risk 3/10 · Minor
- Unhealthy air days now
- 3 days/yr
- Unhealthy air days in 30 yrs
- 3 days/yr
Risk factors via First Street. Map © Google.
Why this score? — see what drove the C grade
The composite is a weighted blend of 9 inputs, each scored 0–100. Each bar is that input's sub-score; the figure is the points it added to the 100-point composite (weight × sub-score).
- Cash flow +20.0/30.0
- ARV discount +9.9/15.0
- DSCR +6.3/10.0
- Rent growth +5.0/5.0
- 1% rule +4.5/10.0
- Schools +3.6/10.0
- Livability +3.5/5.0
- Condition / age +2.5/5.0
- Appreciation +0.0/10.0
$264,000
🖨 Deal sheet 📄 Offer letter ✓ Due diligence
Listing remarks MLS
SHORT SALE!! Very nice home. Move-In ready! Tile entry, very open LR, DR/high ceilings. Split BR plan. Separate family room, new carpet and interior paint. For the person who likes to cook - great kitchen with lots of cabinets, center isle prep station, built in desk and bay window eating area. Screened patio, Landscaped. HOA Amenities include common area, recreation center and community pool, enforcement of by-laws.
Key facts
- Breakfast nook
- Community pool
- Walk-in closet
Tags
Property features AI
Finance
- Other: Taxes listed (annual tax available in records)
- Financial info: Lease restrictions apply
- HOA & community: HOA managed by Vine Management; Association fees required (monthly amount shown $36.67 / $110 quarterly); Association approval required; Pets allowed (cats and dogs); Senior community
Exterior
- Parking: Attached 2-car garage
- Utilities: Public water; Private sewer; Broadband/high-speed internet available; Cable available; Electricity connected; Natural gas available; Phone available; Sewer connected; Underground utilities; Water connected
- Home design: Single family residence; One story; Faces north
- Construction: Block construction; Shingle roof; Concrete perimeter foundation; Built as single-story (one level)
- Exterior features: Rain gutters; Irrigation equipment
Interior
- Kitchen: Dishwasher; Range; Microwave; Refrigerator; Electric water heater
- Bedrooms: 3 bedrooms
- Flooring: Carpet; Laminate
- Bathrooms: 2 full bathrooms
- Heating & cooling: Central heating (electric); Central air conditioning
- Interior features: Cathedral ceilings; Ceiling fans; Open floor plan; Thermostat
- Laundry & utility: Laundry room with washer and dryer hookups; Electric dryer hookup
Neighborhood map
What this means for you Summary
Snapshot
- This is a 3-bed/2.0-bath single-family listed at $264k.
Deal economics
- At list price, monthly cash flow is $324 ($4k/yr) — positive.
- The deal already cash-flows at list — no discount required.
- To meet the 1% rule (rent ≥ 1% of price), the offer needs to be $251k (5.1% below list).
- Recommended offer: $251k (5.1% below list) — sets the bar for 1% rule.
- Cap rate 7.8% vs local median 4.2% in Ocala — top-decile yield for the area; either an underpriced asset or a hidden risk that comps aren't pricing in. Stress-test before assuming the spread holds.
Location & tenants
- Location reads 69/100 on livability (#476 in FL) — a middle-class / working-renter tenant base. Strengths: cost of living A+, housing A+, health & safety A+; Watch: crime F, amenities F, commute F.
- Marion (rural): math 42% / reading 43% proficiency, ranked #61 of 73 in FL (top 84%) — families likely to look elsewhere, expect single-tenant / working-renter base with shorter leases; 61% free/reduced lunch — lower-income household profile, screen leases tightly.
- Market conditions: Rents rising fast (+11.1%/yr); 663 active listings in the ZIP; 36 comparable units currently listed for rent nearby; rentals at typical pace (median 21d on market — plan ~3-4 weeks tenant-placement turnaround); 7,071 units permitted in Marion County in 2024 (534 in 5+ unit buildings).
- At $2,505/mo this rent would consume 46% of the median local household income ($66k/yr) (locally 282% of renters already pay >50% of income on rent) — very limited rent-growth headroom before tenants either downsize or default.
Forward outlook
- Local home prices are declining (-3.0%/yr); year-one equity from $2k of loan paydown is wiped out by about $8k of value loss. Plan a longer hold.
- Marion County population projected at +13% by 2050 — modest demand growth; plan on rents tracking national, not racing it.
- At projected returns (-3.0% appreciation + 8.0% rent growth), your $74k cash investment doubles in ~9 years — after that, you're playing with house money.
Negotiation context
- It's been on market 48 days — a 3% lower offer ($256k) is reasonable based on typical stale-listing flexibility.
- 4 sale attempts since 20y ago with the ask held roughly flat each time — persistent listings suggest the price (not the market) is what's stuck; bring a comps-based counter.
- Current owner paid $120k; list at $264k implies a 120% gain — meaningful room to come down on a strong offer.
Risks & watch-outs
- Climate carrying-cost: severe wind risk, 99% chance of damaging wind over 30y; moderate wildfire risk; extreme-heat days projected 7→22/yr by 2055 (HVAC capex compounding) — expect insurance premiums to compound above CPI over the hold.
Questions for the listing agent
- It's been on market 48 days. Have you received any prior offers? Is the seller open to a 5% concession, seller financing, or rate buy-down credit?
- What does the HOA fee cover, when was the last increase, and are there any pending special assessments or reserve-fund shortfalls?
- Is there a deadline driving the sale (1031 exchange, divorce, estate, relocation)? That informs how much negotiation room exists.
- Crime grade is F in this area — have there been break-ins, vandalism, or insurance claims at this property in the last 3 years? What carrier currently insures it and at what premium?
- What's the average days-on-market for RENTAL listings here right now (not sales)? A rising rental-DOM trend means longer vacancies and softer asking-rent achievability than the comps imply.
- What's the recent tenant-quality profile in this submarket — average credit score on applications, eviction rate, late-payment / NSF rate, and stable-employment percentage? A property-management company in the area should have these aggregated.
- How much new for-sale + rental construction is in the pipeline within 1–3 miles? Heavy new supply typically softens prices + rents 12–24 months out; constrained supply supports both.
Investment metrics
- 1% rule
- 0.95% ✗
- Cap rate
- 7.77%
- Cash-on-cash
- 5.26%
- DSCR
- 1.23
- GRM
- 8.8
CMA / ARV
- ARV (median comp)
- $278,959
- List price
- $264,000
- Delta
- -5.36%
- Verdict
- FAIR
- Comps
- 20 within 1.0 mi
Show comp detail 3 sales within ~0.75 mi
| Address | Dist | Beds/Ba | Sqft | Sold | Price | $/sf | Match |
|---|---|---|---|---|---|---|---|
| 4998 NW 30th Pl | 0.38mi | 3/2.0 | 1,476 (-10%) | 9mo | $259,000 | $175 | 58 |
| 5160 NW 25th Loop | 0.61mi | 2/2.0 (-1) | 1,569 (-4%) | 8mo | $237,500 | $151 | 53 |
| 2218 NW 50th Ave | 0.66mi | 2/2.0 (-1) | 1,544 (-6%) | 6mo | $230,000 | $149 | 49 |
Match score weights: distance 35% · size 25% · config 20% · recency 20%. Top-matched comps best support the ARV.
Projected returns pro-forma
-3.0% appreciation · 8.0% rent growth · sell at horizon
- IRR
- -3.1%
- Equity multiple
- 0.88×
- Total profit
- $-8,977
- Equity at exit
- $39,363
- IRR
- 11.2%
- Equity multiple
- 2.07×
- Total profit
- $78,734
- Equity at exit
- $22,826
Cash invested: $73,920 (down + closing). Projections, not guarantees.
Landlord ↔ Tenant lean methodology
- Overall (STATE)
- 87 Strongly Landlord-Friendly
- State Florida
- 87 Strongly Landlord-Friendly · R+3
- County
- — inherits STATE
- City
- — inherits STATE
ZIP-level market 34482
- Rents YoY
- 11.1%
- Active inventory
- 663
- Price-to-rent
- 8.8×
Monthly cashflow live
- Estimated rent
- $2,505 high interval (Pro) →
- Mortgage (P&I)
- −$1,384
- Tax from tax record
- −$125 /mo · $1,497/yr
- Insurance
- −$110
- HOA
- −$36
- Vacancy / Maint / Mgmt
- −$526
- Net cashflow
- $324
Break-even live
UW: 25.0% down · 7.5% · 30yr · 1.5% tax · 5.0% vac · 8.0% maint · 8.0% mgmt
Financing live
Cash to close
- Down payment
- $66,000
- Closing costs
- $7,920
- Reserves months
- —
- Total cash needed
- —
Loan-product check · same deal, 3 products live
Conventional
25% down · 7.5% · 30yr
- Down + closing
- —
- Monthly P&I
- —
- Monthly cashflow
- —
- DSCR
- —
- Eligible?
- —
Personal DTI + credit; lowest rate.
DSCR
20% down · 8.5% · 30yr
- Down + closing
- —
- Monthly P&I
- —
- Monthly cashflow
- —
- DSCR
- —
- Eligible?
- —
No personal income docs; deal must DSCR.
Hard money
10% down · 12.0% · 12mo
- Down + closing
- —
- Monthly P&I
- —
- Monthly cashflow
- —
- DSCR
- —
- Eligible?
- —
Short-term bridge; refi at stabilization.
Rent comps 36 comps
| Address | Beds | Baths | Sqft | Rent | $/sqft | DOM | Units | Dist |
|---|---|---|---|---|---|---|---|---|
| 5048 NW 35th St Ocala, FL | 3.0 | 2.0 | 1552 | $1,900 | $1.22 | 13d | 1 | 0.55mi |
| 5353 N US Highway 27 Ocala, FL | 1.0–3.0 | 1.0–2.0 | 1169 | $2,045 | $1.75 | 21d | 1 | 0.58mi |
| 3335 NW 52nd Avenue Rd Ocala, FL | 2.0 | 2.5 | 1318 | $2,500 | $1.90 | 21d | 1 | 0.61mi |
| 5191 NW 34th St Ocala, FL | 2.0 | 2.0 | 1318 | $2,400 | $1.82 | 21d | 1 | 0.65mi |
| 4958 NW 35th Lane Rd Ocala, FL | 4.0 | 2.0 | 1998 | $3,000 | $1.50 | 21d | 1 | 0.68mi |
| 4859 NW 35th Lane Rd Ocala, FL | 2.0 | 2.0 | 1666 | $2,495 | $1.50 | 21d | 1 | 0.70mi |
| 5333 NW 33rd Pl Ocala, FL | 2.0 | 2.0 | 1368 | $2,300 | $1.68 | 13d | 1 | 0.71mi |
| 5361 NW 33rd Pl Ocala, FL | 2.0 | 2.0 | 1318 | $2,500 | $1.90 | 21d | 1 | 0.73mi |
| 4743 NW 39th Street Rd Ocala, FL | 3.0 | 2.0 | 1565 | $2,500 | $1.60 | 21d | 1 | 0.80mi |
| 2048 NW 50th Ave Ocala, FL | 2.0 | 2.0 | 1062 | $2,250 | $2.12 | 21d | 1 | 0.81mi |
| 3384 NW 54th Ct Ocala, FL | 2.0 | 2.5 | 1722 | $2,300 | $1.34 | 21d | 1 | 0.82mi |
| 4932 NW 39th Loop Ocala, FL | 4.0 | 2.0 | 2036 | $2,700 | $1.33 | 21d | 1 | 0.82mi |
| 2038 NW 50th Ave Ocala, FL | 2.0 | 2.0 | 1062 | $2,250 | $2.12 | 21d | 1 | 0.82mi |
| 4110 NW 44th Cir Ocala, FL | 3.0 | 2.0 | 1610 | $2,400 | $1.49 | 13d | 1 | 0.82mi |
| 4078 NW 44th Cir Ocala, FL | 3.0 | 2.0 | 1504 | $2,500 | $1.66 | 21d | 1 | 0.82mi |
| 5471 NW 34th St Ocala, FL | 2.0 | 2.0 | 1318 | $2,900 | $2.20 | 21d | 1 | 0.83mi |
| 2028 NW 50th Ave Ocala, FL | 2.0 | 2.0 | 1066 | $1,595 | $1.50 | 21d | 1 | 0.83mi |
| 4111 NW 44th Cir Ocala, FL | 3.0 | 2.0 | 1505 | $2,300 | $1.53 | 13d | 1 | 0.86mi |
| 5423 NW 35th Lane Rd Ocala, FL | 2.0 | 2.0 | 1656 | $3,200 | $1.93 | 21d | 1 | 0.86mi |
| 1918 NW 50th Cir Ocala, FL | 2.0 | 2.0 | 1061 | $2,200 | $2.07 | 21d | 1 | 0.88mi |
| 4122 NW 48th Terrace Rd Ocala, FL | 2.0 | 2.0 | 1816 | $1,999 | $1.10 | 13d | 1 | 0.88mi |
| 4530 NW 14th Loop Ocala, FL | 3.0 | 2.5 | 1966 | $2,250 | $1.14 | 13d | 1 | 0.90mi |
| 4522 NW 14th Loop Ocala, FL | 4.0 | 3.0 | 2028 | $2,050 | $1.01 | 13d | 1 | 0.93mi |
| 1632 NW 44th Court Rd Ocala, FL | 4.0 | 3.0 | 2039 | $2,200 | $1.08 | 21d | 1 | 0.99mi |
| 5399 NW 18th St Ocala, FL | 2.0 | 2.0 | 1085 | $2,100 | $1.94 | 21d | 1 | 1.16mi |
| 5399 NW 18th St Ocala, FL | 2.0 | 2.0 | 1085 | $2,100 | $1.94 | 13d | 1 | 1.16mi |
| 5530 NW 40th Loop Ocala, FL | 3.0 | 2.0 | 1622 | $2,000 | $1.23 | 21d | 1 | 1.25mi |
| 4342 NW 55th Ct Ocala, FL | 3.0 | 2.5 | 2172 | $2,600 | $1.20 | 13d | 1 | 1.31mi |
| 5252 NW 46th Lane Rd Ocala, FL | 4.0 | 2.0 | 2034 | $2,800 | $1.38 | 21d | 1 | 1.32mi |
| 5227 NW 46th Lane Rd Ocala, FL | 4.0 | 2.0 | 2034 | $3,000 | $1.47 | 21d | 1 | 1.32mi |
| 4395 NW 55th Ter Ocala, FL | 3.0 | 2.0 | 1853 | $2,700 | $1.46 | 21d | 1 | 1.36mi |
| 5254 NW 43rd Lane Rd Ocala, FL | 3.0 | 2.0 | 1728 | $3,500 | $2.03 | 21d | 1 | 1.40mi |
| 5347 NW 46th Lane Rd Ocala, FL | 3.0 | 2.0 | 1552 | $2,550 | $1.64 | 21d | 1 | 1.43mi |
| 5521 NW 45th Ln Ocala, FL | 3.0 | 2.0 | 1862 | $2,600 | $1.40 | 13d | 1 | 1.47mi |
| 5237 NW 48th Pl Ocala, FL | 3.0 | 2.0 | 1552 | $4,500 | $2.90 | 21d | 1 | 1.48mi |
| 5416 NW 46th Lane Rd Ocala, FL | 3.0 | 2.0 | 1590 | $2,300 | $1.45 | 13d | 1 | 1.49mi |
HOA detail
- Monthly dues
- $36 · $432/yr
- Likely covers
- pool
Listing history 24 events
-
2026-06-18days on market $264,000 Active 48 DOM
-
2026-06-17days on market $264,000 Active 47 DOM
-
2026-06-16days on market $264,000 Active 46 DOM
-
2026-06-15days on market $264,000 Active 45 DOM
-
2026-06-14days on market $264,000 Active 43 DOM
-
2026-06-13days on market $264,000 Active 42 DOM
-
2026-06-10days on market $264,000 Active 40 DOM
-
2026-06-09days on market $264,000 Active 39 DOM
-
2026-06-08days on market $264,000 Active 38 DOM
-
2026-06-07days on market $264,000 Active 37 DOM
-
2026-06-03days on market $264,000 Active 33 DOM
-
2026-06-02days on market $264,000 Active 32 DOM
-
2026-06-01days on market $264,000 Active 31 DOM
-
2026-05-31days on market $264,000 Active 30 DOM
-
2026-05-30pricedays on market $264,000 Active 29 DOM
-
2026-05-01$269,000 Active 1550-char remark
-
2010-08-18soldstatus $120,000
-
2010-08-16soldstatus $120,000 420-char remark
Show marketing remark (420 chars)
SHORT SALE!! Very nice home. Move-In ready! Tile entry, very open LR, DR/high ceilings. Split BR plan. Separate family room, new carpet and interior paint. For the person who likes to cook - great kitchen with lots of cabinets, center isle prep station, built in desk and bay window eating area. Screened patio, Landscaped. HOA Amenities include common area, recreation center and community pool, enforcement of by-laws.
-
2008-09-22$149,900 420-char remark
Show marketing remark (420 chars)
SHORT SALE!! Very nice home. Move-In ready! Tile entry, very open LR, DR/high ceilings. Split BR plan. Separate family room, new carpet and interior paint. For the person who likes to cook - great kitchen with lots of cabinets, center isle prep station, built in desk and bay window eating area. Screened patio, Landscaped. HOA Amenities include common area, recreation center and community pool, enforcement of by-laws.
-
2008-09-20historical
-
2007-03-15$204,999
-
2006-05-19soldstatus $189,000
-
2006-05-19soldstatus $189,000
-
2006-02-14$214,000
ⓘ Source: listings_history table (triggers on properties + properties_extension) + one-shot
backfill from property_details.listing_events for pre-trigger history.
Tax reassessment forecast FL · Resets to sale price
- Current annual tax
- $1,497 · $125/mo
- Projected year-2 tax
- $2,191 · $183/mo
- Expected delta
- +$695/yr (+$58/mo · 46.4%)
ⓘ Screening estimate from a state-policy table — verify with the county assessor before closing.
Climate risk First Street
- Flood 1/10 Low FEMA zone X (unshaded) · 0% chance over 30 yrs
- Wildfire 5/10 Major
- Heat 8/10 Severe 7 d/yr ≥107°F today · 22 d/yr by 30 yrs out
- Wind 9/10 Extreme 99% chance of damaging wind over 30 yrs
- Air quality 3/10 Moderate 3 unhealthy d/yr today · 3 by 30 yrs out
Nearby sold comps map
Loading sold comps map…
Walkable amenities ~0.75 mi
Loading nearby amenities…
Taxation est. · year 1
- Rental income
- $30,062
- − Mortgage interest
- −$14,788
- − Property taxes
- −$1,497
- − Insurance
- −$1,320
- − Repairs & maintenance
- −$2,405
- − Management
- −$2,405
- − HOA
- −$432
- − Depreciation
- −$7,680
- Taxable loss
- −$465
- Est. tax savings @ 24.0%
- +$112
- After-tax cash flow
- $3,998/yr
For passive investors: Depreciation is non-cash, so a rental often shows a tax loss while cash-flowing — sheltering income. Rental losses are passive: they offset passive income freely, and up to $25,000/yr can offset ordinary (W-2) income if you actively participate and your MAGI is under $100k (phasing out to $0 by $150k); unused losses carry forward. On sale, claimed depreciation is recaptured at up to 25%, and gains may owe capital-gains tax (a 1031 exchange can defer both). Figures are a year-1 estimate at your 24.0% rate — not tax advice; consult a CPA.
Schools (NCES district)
- District
- Marion
- NCES district ID
- 1201260
- Math proficiency
- 42% ▼ -7.00%
- Reading proficiency
- 43% ▼ -4.00%
- Median HH income
- $40,015
- Composite
- 35.61/100
- National rank
- #4890
- State rank
- #61 of 73 in FL
Livability — Ocala
- Score
- 69/100
- State rank
- #476
- US rank
- #8461
Category grades
Schools grade is shown separately in the Schools card above.
Census & demographics
- County
- Marion County · 315,796 people
- City population
- 263,375
- Metro
- Ocala, FL
- Population (ZIP)
- 22,807
- Household income
- $65,901
- Rent vs Own
- Severe rent burden
- 282.0
Population outlook (Marion County) Hauer SSP2
- Today (2025)
- 365,905 people
- By 2030
- 376,768 · +3.0%
- By 2040
- 396,555 · +8.4%
- By 2050
- 412,723 · +12.8%
- By 2075
- 446,090 · +21.9%
- By 2100
- 436,193 · +19.2%
Race, ethnicity, and origin ACS 2023
- Neighborhood character
- Majority White (63%)
- Race & ethnicity
- White 63% Hispanic / Latino 19% Black 14% Two or more races 12%
- Hispanic origin (detail)
- Mexican 6% Puerto Rican 9% Cuban 2%
- Common ancestry
- Lithuanian 2% Romanian 2% Slovak 2%
- Foreign-born
- 10% · Canada
- Languages at home
- 81% English-only · Spanish 16% Other Indo-European 1%
Political lean MEDSL · Marion
- 2024 margin
- Solid R (+31.6) · D 33.8% · R 65.5%
- 2008→2024 swing
- -20.0pp toward R · 2008: -11.6pp · 2024: -31.6pp
- All cycles
- 2024: R+31.6 2020: R+25.9 2016: R+26.2 2012: R+16.2 2008: R+11.6
Not yet ingested
- Civics
- —
Market trends
- HPI YoY
- ▼ -133.62%
- Current HPI
- 194.3857
- Rent YoY
- ▲ 11.12%
- Metro
- Ocala, FL
- State GDP YoY
- ▲ 3.28%
- F500 in state
- 36
Industry mix (Fortune 500 HQ in FL)
| Industry | F500 HQs | Revenue |
|---|---|---|
| Industrial Technology | 2 | $29B |
|
||
| Insurance | 2 | $17B |
|
||
| Retail | 1 | $60B |
|
||
| Technology Distribution | 1 | $58B |
|
||
| Homebuilding | 1 | $35B |
|
||
| Technology Manufacturing | 1 | $35B |
|
||
Price history
+23.4% since first listed10 events — show timeline
- 2026-05-30 Price Changed $264,000 Stellar MLS as Distributed by MLS Grid
- 2026-05-01 Listed $269,000 Stellar MLS as Distributed by MLS Grid
- 2010-08-18 Sold (Public Records) $120,000 Public Records
- 2010-08-16 Sold (MLS) $120,000 Stellar MLS as Distributed by MLS Grid
- 2008-09-22 Listed $149,900 Stellar MLS as Distributed by MLS Grid
- 2008-09-20 Listing Removed — Stellar MLS as Distributed by MLS Grid
- 2007-03-15 Listed $204,999 Stellar MLS as Distributed by MLS Grid
- 2006-05-19 Sold (Public Records) $189,000 Public Records
- 2006-05-19 Sold (MLS) $189,000 Stellar MLS as Distributed by MLS Grid
- 2006-02-14 Listed $214,000 Stellar MLS as Distributed by MLS Grid
Property tax history
+3.0%/yrLatest (2025): $1,497 · +19.1% YoY. Source: county tax records.
Cash-flow waterfall
monthlySold comps — $/sqft
last 12 mo · ≤1 miLoading sold comps…