2123 Renner Pl · Cincinnati, OH
Flood risk 1/10 · Minimal
- FEMA flood zone
- X (unshaded)
- Chance of flooding over 30 yrs
- 0.0%
- Est. flood insurance / yr
- $473 – $860
Fire risk 1/10 · Minimal
- Est. fire insurance / yr
- $713 – $1,323
Heat risk 5/10 · Moderate
- Hot days now (above 103°F)
- 7 days/yr
- Hot days in 30 yrs
- 19 days/yr
Wind risk 2/10 · Minimal
- Chance of severe wind over 30 yrs
- 1.0%
Air-quality risk 3/10 · Minor
- Unhealthy air days now
- 2 days/yr
- Unhealthy air days in 30 yrs
- 3 days/yr
Risk factors via First Street. Map © Google.
Why this score? — see what drove the A- grade
The composite is a weighted blend of 9 inputs, each scored 0–100. Each bar is that input's sub-score; the figure is the points it added to the 100-point composite (weight × sub-score).
- Cash flow +30.0/30.0
- 1% rule +10.0/10.0
- DSCR +10.0/10.0
- Appreciation +10.0/10.0
- ARV discount +7.5/15.0
- Rent growth +4.5/5.0
- Livability +4.0/5.0
- Schools +2.5/10.0
- Condition / age +2.5/5.0
$50,000
🖨 Deal sheet 📄 Offer letter ✓ Due diligence
Listing remarks MLS
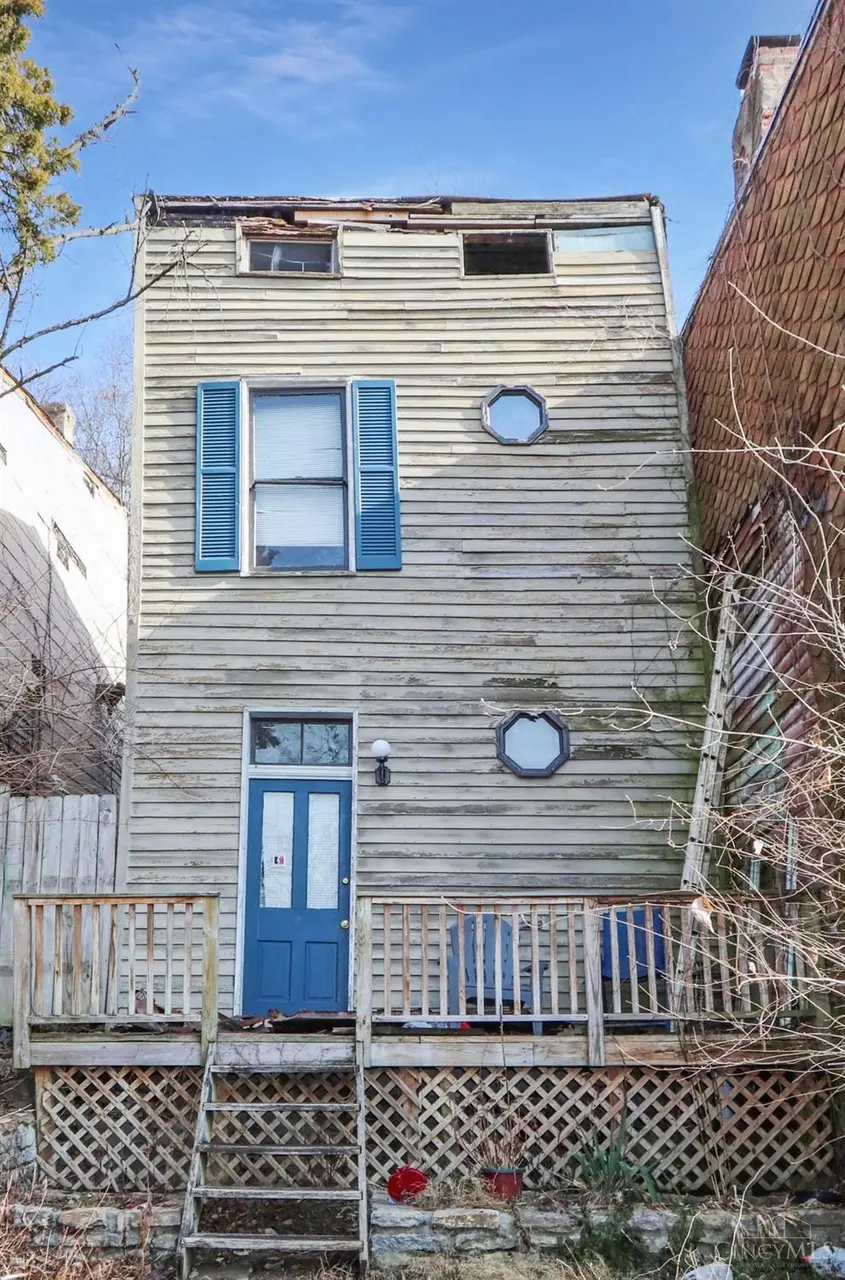
Investor opportunity just blocks from Findlay Market and TQL Stadium, and minutes to downtown, UC, and all three pro sports stadiums. 2123 Renner Place offers strong potential with partial city views and is surrounded by ongoing redevelopment. The property needs a full renovation or teardown and is being sold as-is. Ideal for investors or builders looking to bring new life to the area. This building can be purchased individually or as part of a larger package that includes three buildings and three additional lots on Renner. Don't miss this rare chance to invest in a rapidly growing part of the city.
Key facts
- Partial city views
- 1,873 sq ft lot
- Built 1893
Tags
Property features AI
Finance
- Other: Lease not considered
- HOA & community: No HOA
Exterior
- Parking: On-street parking
- Utilities: Public water; Natural gas; Public sewer
- Home design: Traditional single-family home; Two levels; Second floor area approximately 576
- Construction: Stone construction; Stone foundation
- Exterior features: Shingle roof; Vinyl windows; Less than 0.5 acre lot; Residential zoning; City street access
Interior
- Kitchen: Wood cabinets
- Bedrooms: 2 bedrooms; Primary bedroom on level 2 (12 x 15); Second bedroom on level 2 (12 x 15)
- Bathrooms: 1 full bathroom on level 1 with tub
- Interior features: 4 total rooms; Partial unfinished basement; Window treatments in living room
Neighborhood map
What this means for you Summary
Snapshot
- This is a 2-bed/1.0-bath single-family listed at $50k.
Deal economics
- At list price, monthly cash flow is $911 ($11k/yr) — positive.
- The deal already cash-flows at list — no discount required.
- Meets the 1% rule at list price ($2k rent vs $50k).
- Recommended offer: $48k (3.0% below list) — sets the bar for market timing.
- Cap rate 28.2% vs local median 3.9% in Cincinnati — top-decile yield for the area; either an underpriced asset or a hidden risk that comps aren't pricing in. Stress-test before assuming the spread holds.
Location & tenants
- Location reads 80/100 on livability (#130 in OH, #1,856 nationally) — a professional / high-income tenant draw. Strengths: amenities A+, commute A+, cost of living A+; Watch: employment D, crime F.
- Cincinnati Public Schools (urban): math 25% / reading 36% proficiency, ranked #581 of 656 in OH (top 89%) — families likely to look elsewhere, expect single-tenant / working-renter base with shorter leases; 70% free/reduced lunch — lower-income household profile, screen leases tightly.
- Market conditions: Rents rising fast (+8.1%/yr); 67 active listings in the ZIP; 40 comparable units currently listed for rent nearby; rentals at typical pace (median 17d on market — plan ~3-4 weeks tenant-placement turnaround); lower-income renter base — watch delinquency; 801 units permitted in Hamilton County in 2024 (190 in 5+ unit buildings).
- At $1,607/mo this rent would consume 69% of the median local household income ($28k/yr) (locally 857% of renters already pay >50% of income on rent) — very limited rent-growth headroom before tenants either downsize or default.
Forward outlook
- In year one you build about $5k of equity ($346 loan paydown + $5k appreciation (10.0% local appreciation)).
- At projected returns (10.0% appreciation + 8.0% rent growth), your $14k cash investment doubles in ~1 year — after that, you're playing with house money.
- By year 6, paydown + projected appreciation supports a ~$31k cash-out refi (75% LTV) — recoverable capital for the next deal without selling this one.
Negotiation context
- It's been on market 35 days — a 3% lower offer ($48k) is reasonable based on typical stale-listing flexibility.
- 2 sale attempts with the ask held roughly flat each time — persistent listings suggest the price (not the market) is what's stuck; bring a comps-based counter.
Risks & watch-outs
- Watch-outs: built in 1893 — expect roof / HVAC / electrical / plumbing capex.
- Climate carrying-cost: extreme-heat days projected 7→19/yr by 2055 (HVAC capex compounding) — expect insurance premiums to compound above CPI over the hold.
Questions for the listing agent
- It's been on market 35 days. Have you received any prior offers? Is the seller open to a 3% concession, seller financing, or rate buy-down credit?
- Built in 1893 — when were the roof, HVAC, electrical panel, plumbing, and water heater last replaced?
- Is there a deadline driving the sale (1031 exchange, divorce, estate, relocation)? That informs how much negotiation room exists.
- Schools are B-rated — typically a magnet for longer-tenancy family renters. What's the average tenant stay here, and is there a school-zone premium baked into asking?
- Crime grade is F in this area — have there been break-ins, vandalism, or insurance claims at this property in the last 3 years? What carrier currently insures it and at what premium?
- What's the average days-on-market for RENTAL listings here right now (not sales)? A rising rental-DOM trend means longer vacancies and softer asking-rent achievability than the comps imply.
- What's the recent tenant-quality profile in this submarket — average credit score on applications, eviction rate, late-payment / NSF rate, and stable-employment percentage? A property-management company in the area should have these aggregated.
- How much new for-sale + rental construction is in the pipeline within 1–3 miles? Heavy new supply typically softens prices + rents 12–24 months out; constrained supply supports both.
Investment metrics
- 1% rule
- 3.21% ✓
- Cap rate
- 28.16%
- Cash-on-cash
- 78.08%
- DSCR
- 4.47
- GRM
- 2.6
CMA / ARV
- ARV (on-the-fly)
- $230,400
- Comps found
- 12
Show comp detail 12 sales within ~0.75 mi
| Address | Dist | Beds/Ba | Sqft | Sold | Price | $/sf | Match |
|---|---|---|---|---|---|---|---|
| 408 Southview Ave | 0.37mi | 2/1.5 | 1,136 (-1%) | 8mo | $215,000 | $189 | 71 |
| 2316 Sauer Ave | 0.39mi | 3/1.0 (+1) | 1,166 (+1%) | 10mo | $195,000 | $167 | 67 |
| 642 Clemmer Ave | 0.52mi | 2/1.0 | 1,137 (-1%) | 12mo | $285,000 | $251 | 63 |
| 37 E Clifton Ave | 0.58mi | 3/1.0 (+1) | 1,200 (+4%) | 4mo | $84,500 | $70 | 58 |
| 343 Ada St | 0.30mi | 2/1.5 | 1,310 (+14%) | 7mo | $246,000 | $188 | 55 |
| 212 Atkinson St | 0.48mi | 2/1.0 | 1,053 (-9%) | 11mo | $245,000 | $233 | 54 |
| 450 Lloyd Pl | 0.24mi | 3/2.0 (+1) | 1,307 (+14%) | 4mo | $309,000 | $236 | 54 |
| 2214 Sauer Ave | 0.36mi | 2/2.0 | 1,255 (+9%) | 14mo | $235,000 | $187 | 53 |
| 2314 Flora St | 0.25mi | 3/1.0 (+1) | 1,008 (-12%) | 12mo | $230,000 | $228 | 52 |
| 2341 Chickasaw St | 0.34mi | 3/2.0 (+1) | 1,216 (+6%) | 18mo | $239,900 | $197 | 51 |
| 2323 Muriel Ct | 0.30mi | 3/2.0 (+1) | 1,259 (+9%) | 18mo | $252,000 | $200 | 46 |
| 2408 Moerlein Ave | 0.52mi | 3/1.5 (+1) | 1,062 (-8%) | 14mo | $342,500 | $323 | 44 |
Match score weights: distance 35% · size 25% · config 20% · recency 20%. Top-matched comps best support the ARV.
Projected returns pro-forma
10.0% appreciation · 8.0% rent growth · sell at horizon
- IRR
- 92.8%
- Equity multiple
- 7.70×
- Total profit
- $93,776
- Equity at exit
- $45,044
- IRR
- 89.2%
- Equity multiple
- 18.97×
- Total profit
- $251,634
- Equity at exit
- $97,139
Cash invested: $14,000 (down + closing). Projections, not guarantees.
Landlord ↔ Tenant lean methodology
- Overall (STATE)
- 73 Landlord-Friendly
- State Ohio
- 73 Landlord-Friendly · R+6
- County
- — inherits STATE
- City
- — inherits STATE
ZIP-level market 45214
- Home prices YoY
- 3.6%
- Rents YoY
- 8.1%
- Active inventory
- 67
- Price-to-rent
- 2.6×
Monthly cashflow live
- Estimated rent
- $1,607 high interval (Pro) →
- Mortgage (P&I)
- −$262
- Tax from tax record
- −$76 /mo · $908/yr
- Insurance
- −$21
- HOA
- −$0
- Vacancy / Maint / Mgmt
- −$337
- Net cashflow
- $911
Break-even live
UW: 25.0% down · 7.5% · 30yr · 1.5% tax · 5.0% vac · 8.0% maint · 8.0% mgmt
Financing live
Cash to close
- Down payment
- $12,500
- Closing costs
- $1,500
- Reserves months
- —
- Total cash needed
- —
Loan-product check · same deal, 3 products live
Conventional
25% down · 7.5% · 30yr
- Down + closing
- —
- Monthly P&I
- —
- Monthly cashflow
- —
- DSCR
- —
- Eligible?
- —
Personal DTI + credit; lowest rate.
DSCR
20% down · 8.5% · 30yr
- Down + closing
- —
- Monthly P&I
- —
- Monthly cashflow
- —
- DSCR
- —
- Eligible?
- —
No personal income docs; deal must DSCR.
Hard money
10% down · 12.0% · 12mo
- Down + closing
- —
- Monthly P&I
- —
- Monthly cashflow
- —
- DSCR
- —
- Eligible?
- —
Short-term bridge; refi at stabilization.
Rent comps 40 comps
| Address | Beds | Baths | Sqft | Rent | $/sqft | DOM | Units | Dist |
|---|---|---|---|---|---|---|---|---|
| 445 W McMicken Ave Cincinnati, OH | 3.0 | 1.0 | 1090 | $1,350 | $1.24 | 23d | 1 | 0.14mi |
| 231 Emming St Unit 2 Cincinnati, OH | 3.0 | 1.0 | 1200 | $1,800 | $1.50 | 23d | 1 | 0.19mi |
| 300 Warner St Unit 1 Cincinnati, OH | 1.0 | 1.0 | 747 | $1,100 | $1.47 | 2d | 1 | 0.23mi |
| 414 Dayton St Cincinnati, OH | 3.0 | 2.5 | 1176 | $2,400 | $2.04 | 23d | 1 | 0.25mi |
| 474 Dayton St Apt A Cincinnati, OH | 1.0 | 1.5 | 1500 | $1,300 | $0.87 | 23d | 1 | 0.27mi |
| 812 Dayton St Unit 1056021P Cincinnati, OH | 3.0 | 1.0 | 1453 | $2,995 | $2.06 | 1d | 1 | 0.27mi |
| 207 W McMicken Ave Unit 3 Cincinnati, OH | 2.0 | 1.0 | 990 | $1,400 | $1.41 | 23d | 1 | 0.30mi |
| 2333 W Clifton Ave Cincinnati, OH | 2.0 | 1.0 | 1000 | $1,200 | $1.20 | 23d | 1 | 0.33mi |
| 421 Southview Ave Unit 2 Cincinnati, OH | 3.0 | 1.0 | 1350 | $1,800 | $1.33 | 23d | 1 | 0.37mi |
| 1 Foxhall Ct Unit 1 Cincinnati, OH | 2.0 | 2.5 | 1500 | $2,200 | $1.47 | 23d | 1 | 0.39mi |
| 2215 Ohio Ave Unit 2217-01 Cincinnati, OH | 1.0 | 1.0 | 1013 | $1,095 | $1.08 | 23d | 1 | 0.40mi |
| 265 W McMillan St Unit 1 Cincinnati, OH | 2.0 | 1.0 | 950 | $1,350 | $1.42 | 20d | 1 | 0.43mi |
| 1007 Dayton St Unit 6 Cincinnati, OH | 1.0 | 1.0 | 1035 | $1,150 | $1.11 | 23d | 1 | 0.44mi |
| 2341 W McMicken Ave Apt 2 Cincinnati, OH | 1.0 | 1.0 | 1051 | $1,200 | $1.14 | 4d | 1 | 0.45mi |
| 2341 W McMicken Ave Unit 1 Cincinnati, OH | 1.0 | 1.0 | 1291 | $1,300 | $1.01 | 4d | 1 | 0.45mi |
| 1900 Elm St Unit 1056055P Cincinnati, OH | 1.0 | 1.0 | 710 | $3,190 | $4.49 | 14d | 1 | 0.46mi |
| 1925 Colerain Ave Unit 1056034P Cincinnati, OH | 2.0 | 1.0 | 1453 | $2,790 | $1.92 | 12d | 1 | 0.50mi |
| 1807 Elm St Cincinnati, OH | 1.0 | 1.0 | 615 | $1,425 | $2.32 | 1d | 1 | 0.53mi |
| 111 W Elder St Unit 1056044P Cincinnati, OH | 1.0–4.0 | 1.0–4.0 | 1835 | $3,983 | $2.17 | 10d | 2 | 0.58mi |
| 107 W Elder St Unit C Cincinnati, OH | 1.0 | 1.0 | 800 | $1,195 | $1.49 | 2d | 1 | 0.59mi |
| 55 E Clifton Ave Unit B Cincinnati, OH | 2.0 | 2.0 | 1395 | $2,500 | $1.79 | 23d | 1 | 0.59mi |
| 2582 W McMicken Ave Apt 4 Cincinnati, OH | 1.0 | 1.0 | 700 | $895 | $1.28 | 2d | 1 | 0.63mi |
| 105 E Clifton Ave Cincinnati, OH | 2.0 | 1.0 | 750 | $1,795 | $2.39 | 16d | 1 | 0.65mi |
| 105 Peete St Cincinnati, OH | 1.0 | 1.0 | 825 | $900 | $1.09 | 23d | 1 | 0.65mi |
| 105 Peete St Cincinnati, OH | 2.0 | 1.0 | 983 | $1,325 | $1.35 | 3d | 1 | 0.65mi |
| 1617 Elm St Cincinnati, OH | 3.0 | 1.0–2.0 | 1028 | $3,673 | $3.57 | 1d | 44 | 0.66mi |
| 2212 Calumet St Unit 2 Cincinnati, OH | 1.0 | 1.0 | 786 | $825 | $1.05 | 23d | 1 | 0.69mi |
| 1606 Pleasant St Unit 1056043P Cincinnati, OH | 1.0 | 1.0 | 1076 | $2,493 | $2.32 | 1d | 1 | 0.69mi |
| 130 Valencia St #1 Cincinnati, OH | 2.0 | 1.0 | 700 | $1,150 | $1.64 | 23d | 1 | 0.72mi |
| 1508 Pleasant St Unit 1495913P Cincinnati, OH | 1.0–3.0 | 1.0–2.0 | 1431 | $5,854 | $4.09 | 1d | 2 | 0.80mi |
| 1523 Republic St #202 Cincinnati, OH | 1.0 | 1.0 | 830 | $1,750 | $2.11 | 16d | 1 | 0.80mi |
| 2805 Stratford Ave Unit 2 Cincinnati, OH | 2.0 | 1.0 | 850 | $1,450 | $1.71 | 4d | 1 | 0.80mi |
| 1510 Race St Unit 1056158P Cincinnati, OH | 2.0 | 1.0 | 1076 | $4,248 | $3.95 | 23d | 1 | 0.81mi |
| 1507 Race St Unit 1056026P Cincinnati, OH | 2.0 | 1.0 | 1453 | $3,630 | $2.50 | 14d | 1 | 0.82mi |
| 1429 Elm St Unit 1495912P Cincinnati, OH | 1.0 | 1.0 | 721 | $3,286 | $4.56 | 14d | 1 | 0.82mi |
| 1502 Race St Unit 1056057P Cincinnati, OH | 1.0 | 1.0 | 710 | $3,541 | $4.99 | 12d | 1 | 0.83mi |
| 2426 Goose Aly Unit 1056056P Cincinnati, OH | 1.0 | 1.0 | 710 | $3,090 | $4.35 | 1d | 1 | 0.84mi |
| 1777 Sycamore St Unit 5 Cincinnati, OH | 2.0 | 1.0 | 964 | $1,530 | $1.59 | 23d | 1 | 0.85mi |
| 1042 Marshall Ave Apt 3 Cincinnati, OH | 3.0 | 1.0 | 1400 | $1,195 | $0.85 | 23d | 1 | 0.85mi |
| 1048 Marshall Ave Unit 5 Cincinnati, OH | 2.0 | 1.0 | 888 | $965 | $1.09 | 23d | 1 | 0.86mi |
Listing history 17 events
-
2026-06-18days on market $50,000 Active 35 DOM
-
2026-06-17days on market $50,000 Active 34 DOM
-
2026-06-16days on market $50,000 Active 33 DOM
-
2026-06-15days on market $50,000 Active 32 DOM
-
2026-06-13days on market $50,000 Active 30 DOM
-
2026-06-13days on market $50,000 Active 29 DOM
-
2026-06-09days on market $50,000 Active 26 DOM
-
2026-06-08days on market $50,000 Active 25 DOM
-
2026-06-07days on market $50,000 Active 24 DOM
-
2026-06-03days on market $50,000 Active 20 DOM
-
2026-06-02days on market $50,000 Active 19 DOM
-
2026-06-01days on market $50,000 Active 18 DOM
-
2026-05-31days on market $50,000 Active 17 DOM
-
2026-05-14$50,000 Active
-
2026-03-31historical 607-char remark
Show marketing remark (607 chars)
Investor opportunity just blocks from Findlay Market and TQL Stadium, and minutes to downtown, UC, and all three pro sports stadiums. 2123 Renner Place offers strong potential with partial city views and is surrounded by ongoing redevelopment. The property needs a full renovation or teardown and is being sold as-is. Ideal for investors or builders looking to bring new life to the area. This building can be purchased individually or as part of a larger package that includes three buildings and three additional lots on Renner. Don't miss this rare chance to invest in a rapidly growing part of the city.
-
2026-03-03price $90,000 607-char remark
Show marketing remark (607 chars)
Investor opportunity just blocks from Findlay Market and TQL Stadium, and minutes to downtown, UC, and all three pro sports stadiums. 2123 Renner Place offers strong potential with partial city views and is surrounded by ongoing redevelopment. The property needs a full renovation or teardown and is being sold as-is. Ideal for investors or builders looking to bring new life to the area. This building can be purchased individually or as part of a larger package that includes three buildings and three additional lots on Renner. Don't miss this rare chance to invest in a rapidly growing part of the city.
-
2026-01-09$115,000 Active 607-char remark
Show marketing remark (607 chars)
Investor opportunity just blocks from Findlay Market and TQL Stadium, and minutes to downtown, UC, and all three pro sports stadiums. 2123 Renner Place offers strong potential with partial city views and is surrounded by ongoing redevelopment. The property needs a full renovation or teardown and is being sold as-is. Ideal for investors or builders looking to bring new life to the area. This building can be purchased individually or as part of a larger package that includes three buildings and three additional lots on Renner. Don't miss this rare chance to invest in a rapidly growing part of the city.
ⓘ Source: listings_history table (triggers on properties + properties_extension) + one-shot
backfill from property_details.listing_events for pre-trigger history.
Tax reassessment forecast OH · Partial reset (capped growth)
- Current annual tax
- $908 · $76/mo
- Projected year-2 tax
- $908 · $76/mo
- Expected delta
- $0/yr ($0/mo · -0.0%)
ⓘ Screening estimate from a state-policy table — verify with the county assessor before closing.
Climate risk First Street
- Flood 1/10 Low FEMA zone X (unshaded) · 0% chance over 30 yrs
- Wildfire 1/10 Low
- Heat 5/10 Major 7 d/yr ≥103°F today · 19 d/yr by 30 yrs out
- Wind 2/10 Low 100% chance of damaging wind over 30 yrs
- Air quality 3/10 Moderate 2 unhealthy d/yr today · 3 by 30 yrs out
Nearby sold comps map
Loading sold comps map…
Walkable amenities ~0.75 mi
Loading nearby amenities…
Taxation est. · year 1
- Rental income
- $19,286
- − Mortgage interest
- −$2,801
- − Property taxes
- −$908
- − Insurance
- −$250
- − Repairs & maintenance
- −$1,543
- − Management
- −$1,543
- − Depreciation
- −$1,455
- Taxable income
- $10,787
- Est. tax owed @ 24.0%
- −$2,589
- After-tax cash flow
- $8,343/yr
For passive investors: Depreciation is non-cash, so a rental often shows a tax loss while cash-flowing — sheltering income. Rental losses are passive: they offset passive income freely, and up to $25,000/yr can offset ordinary (W-2) income if you actively participate and your MAGI is under $100k (phasing out to $0 by $150k); unused losses carry forward. On sale, claimed depreciation is recaptured at up to 25%, and gains may owe capital-gains tax (a 1031 exchange can defer both). Figures are a year-1 estimate at your 24.0% rate — not tax advice; consult a CPA.
Schools (NCES district)
- District
- Cincinnati Public Schools
- NCES district ID
- 3904375
- Math proficiency
- 25% ▼ -19.00%
- Reading proficiency
- 36% ▼ -14.00%
- Median HH income
- $35,743
- Composite
- 25.21/100
- National rank
- #7508
- State rank
- #581 of 656 in OH
Livability — Cincinnati
- Score
- 80/100
- State rank
- #130
- US rank
- #1856
Category grades
Schools grade is shown separately in the Schools card above.
Census & demographics
- Census place
- Cincinnati, OH
- County
- Hamilton County · 701,295 people
- City population
- 505,555
- Metro
- Cincinnati, OH-KY-IN
- Population (ZIP)
- 8,630
- Household income
- $27,852
- Rent vs Own
- Severe rent burden
- 857.0
Population outlook (Hamilton County) Hauer SSP2
- Today (2025)
- 826,054 people
- By 2030
- 830,947 · +0.6%
- By 2040
- 832,319 · +0.8%
- By 2050
- 822,428 · -0.4%
- By 2075
- 788,688 · -4.5%
- By 2100
- 710,674 · -14.0%
Race, ethnicity, and origin ACS 2023
- Neighborhood character
- Majority Black (63%)
- Race & ethnicity
- Black 63% White 27% Two or more races 7% Hispanic / Latino 3%
- Common ancestry
- Romanian 1%
- Foreign-born
- 2% · Canada
- Languages at home
- 97% English-only · Spanish 1% Other Indo-European 1%
Political lean MEDSL · Hamilton
- 2024 margin
- D (+14.9) · D 57.0% · R 42.1%
- 2008→2024 swing
- +7.9pp toward D · 2008: 7.0pp · 2024: 14.9pp
- All cycles
- 2024: D+14.9 2020: D+15.9 2016: D+9.5 2012: D+4.9 2008: D+7.0
Not yet ingested
- Civics
- —
Market trends
- HPI YoY
- ▲ 15.01%
- Current HPI
- 433.2346
- Rent YoY
- ▲ 8.09%
- Metro
- Cincinnati, OH-KY-IN
- State GDP YoY
- ▲ 1.98%
- F500 in state
- 48
Industry mix (Fortune 500 HQ in OH)
| Industry | F500 HQs | Revenue |
|---|---|---|
| Insurance | 3 | $145B |
|
||
| Industrial Machinery | 3 | $49B |
|
||
| Financial Services | 3 | $24B |
|
||
| Consumer Goods | 2 | $93B |
|
||
| Aerospace / Defense | 2 | $47B |
|
||
| Utilities | 2 | $33B |
|
||
Price history
-56.5% since first listed4 events — show timeline
- 2026-05-14 Listed $50,000 Cincy MLS
- 2026-03-31 Listing Removed — Cincy MLS
- 2026-03-03 Price Changed $90,000 Cincy MLS
- 2026-01-09 Listed $115,000 Cincy MLS
Property tax history
+13.1%/yrLatest (2025): $908 · +0.1% YoY. Source: county tax records.
Cash-flow waterfall
monthlySold comps — $/sqft
last 12 mo · ≤1 miLoading sold comps…