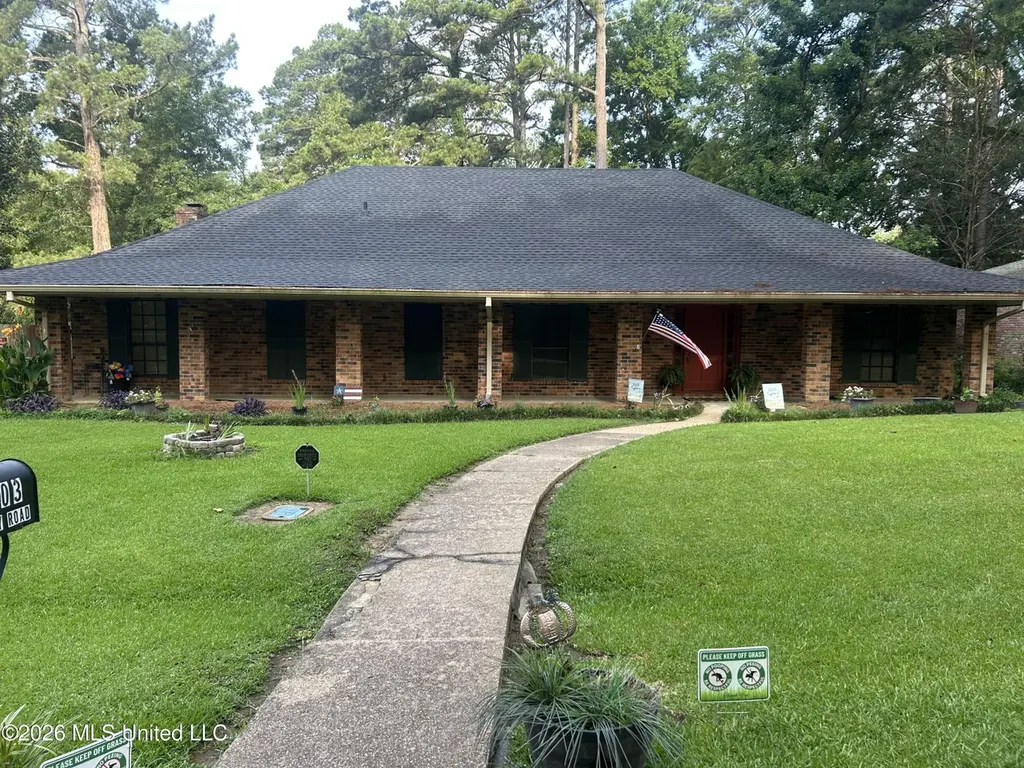
103 Bay Rd · Flowood, MS
Flood risk 1/10 · Minimal
- FEMA flood zone
- X (unshaded)
- Chance of flooding over 30 yrs
- 0.0%
- Est. flood insurance / yr
- $507 – $1,088
Fire risk 1/10 · Minimal
- Est. fire insurance / yr
- $1,241 – $2,305
Heat risk 7/10 · Major
- Hot days now (above 108°F)
- 7 days/yr
- Hot days in 30 yrs
- 20 days/yr
Wind risk 8/10 · Major
- Chance of severe wind over 30 yrs
- 80.0%
Air-quality risk 2/10 · Minimal
- Unhealthy air days now
- 1 days/yr
- Unhealthy air days in 30 yrs
- 1 days/yr
Risk factors via First Street. Map © Google.
Why this score? — see what drove the D+ grade
The composite is a weighted blend of 9 inputs, each scored 0–100. Each bar is that input's sub-score; the figure is the points it added to the 100-point composite (weight × sub-score).
- ARV discount +14.3/15.0
- Cash flow +13.8/30.0
- Schools +4.6/10.0
- DSCR +4.2/10.0
- Livability +3.9/5.0
- Rent growth +3.2/5.0
- 1% rule +3.1/10.0
- Condition / age +2.5/5.0
- Appreciation +0.0/10.0
$307,000
🖨 Deal sheet (PDF) 📄 Offer letter ✓ Due diligence
Listing remarks MLS
Take a look at this 4 bedroom/2 and a half bathroom home located in Brandon near the Rez! This is a split plan home with large bedrooms, a formal dining room, den and sitting room or office. There's a storage room and shed out back. This i s a must see!
Key facts
- 0.37 acre lot
- 2 parking spots
- Built 1975
Property features AI
Finance
- Other: Zoned for general residential
- Financial info: Financial details not provided
- HOA & community: No HOA information listed
Exterior
- Parking: Attached carport (2 spaces, 2 total)
- Security: No security features listed
- Utilities: Public water; Public sewer; Cable available; Electricity connected; Natural gas connected
- Home design: Single family residence (house); One level; Living area reported by owner
- Construction: Brick construction; Slab foundation; Year built reported in public records
- Exterior features: Permeable paving; Private entrance; Private yard; Rain gutters; Asphalt roof
Interior
- Kitchen: Built-in gas oven; Double oven; Electric cooktop; Dishwasher; Refrigerator; Eat-in kitchen
- Bedrooms: Bedrooms information not provided
- Flooring: Carpet; Ceramic tile
- Bathrooms: 2 full bathrooms and 1 half bathroom (3 total)
- Heating & cooling: Central heating; Central air conditioning; Gas cooling connection
- Interior features: Bar; Ceiling fan(s); Double vanity; Eat-in kitchen; Entrance foyer; Storage; Walk-in closet(s); Living room fireplace
- Laundry & utility: Main level laundry room; Water heater
Neighborhood map
What this means for you Summary
Snapshot
- This is a 4-bed/2.0-bath single-family listed at $307k.
Deal economics
- At list price, monthly cash flow is $30 ($361/yr) — positive.
- The deal already cash-flows at list — no discount required.
- To meet the 1% rule (rent ≥ 1% of price), the offer needs to be $249k (19.0% below list).
- Recommended offer: $249k (19.0% below list) — sets the bar for 1% rule.
- Cap rate 6.4% vs local median 4.3% in Flowood — top-decile yield for the area; either an underpriced asset or a hidden risk that comps aren't pricing in. Stress-test before assuming the spread holds.
Location & tenants
- Location reads 77/100 on livability (#10 in MS, #3,075 nationally) — a middle-class / working-renter tenant base. Strengths: crime A+, cost of living A+, housing A+; Watch: amenities F, commute F.
- Rankin County School District (rural): math 56% / reading 48% proficiency, ranked #6 of 130 in MS (top 5%) — acceptable for families but not a draw, mixed tenant base, ~2y average lease.
- Zoned schools: Northshore Elementary (math 82% / reading 68%, grade A, #5 of 375 statewide, top 1%, 551 students, 100% FRL); Northwest Rankin Middle School (math 63% / reading 51%, grade B, #13 of 179 statewide, top 7%, 1,374 students, 100% FRL); Northwest Rankin High School (math 48% / reading 42%, grade D-, #34 of 197 statewide, top 17%, 1,898 students, 100% FRL) — zoned schools average 100% FRL vs 35% district-wide (65 pts higher); higher-poverty schools than district average — tighter screening recommended.
- Market conditions: Rents rising (+2.9%/yr); 440 active listings in the ZIP; 1 comparable units currently listed for rent nearby; solid renter incomes; 343 units permitted in Rankin County in 2024 (0 in 5+ unit buildings).
Forward outlook
- Local home prices are declining (-3.0%/yr); year-one equity from $2k of loan paydown is wiped out by about $9k of value loss. Plan a longer hold.
- Rankin County population projected at +17% by 2050 — long-run rental-demand tailwind backs the buy-and-hold thesis.
Negotiation context
- Only 12 days on market — expect competitive offers; lowballing is unlikely to land.
- 2 sale attempts since 4y ago with the ask held roughly flat each time — persistent listings suggest the price (not the market) is what's stuck; bring a comps-based counter.
Risks & watch-outs
- Climate carrying-cost: severe wind risk, 80% chance of damaging wind over 30y; extreme-heat days projected 7→20/yr by 2055 (HVAC capex compounding) — expect insurance premiums to compound above CPI over the hold.
Questions for the listing agent
- Built in 1975 — when were the roof, HVAC, electrical panel, plumbing, and water heater last replaced?
- Is there a deadline driving the sale (1031 exchange, divorce, estate, relocation)? That informs how much negotiation room exists.
- Schools are B-rated — typically a magnet for longer-tenancy family renters. What's the average tenant stay here, and is there a school-zone premium baked into asking?
- The area grade is low — what's the realistic commute time and amenity access for the typical tenant pool here? Any planned neighborhood developments (good or bad) we should know about?
- What's the average days-on-market for RENTAL listings here right now (not sales)? A rising rental-DOM trend means longer vacancies and softer asking-rent achievability than the comps imply.
- What's the recent tenant-quality profile in this submarket — average credit score on applications, eviction rate, late-payment / NSF rate, and stable-employment percentage? A property-management company in the area should have these aggregated.
- How much new for-sale + rental construction is in the pipeline within 1–3 miles? Heavy new supply typically softens prices + rents 12–24 months out; constrained supply supports both.
Investment metrics
- 1% rule
- 0.81% ✗
- Cap rate
- 6.41%
- Cash-on-cash
- 0.42%
- DSCR
- 1.02
- GRM
- 10.3
CMA / ARV
- ARV (on-the-fly)
- $361,494
- Comps found
- 8
Show comp detail 8 sales within ~0.75 mi
| Address | Dist | Beds/Ba | Sqft | Sold | Price | $/sf | Match |
|---|---|---|---|---|---|---|---|
| 406 Bay Park Dr | 0.20mi | 4/2.5 | 2,732 (+0%) | 15mo | $292,000 | $107 | 75 |
| 200 Bay Rd | 0.05mi | 4/2.5 | 2,456 (-10%) | 11mo | $277,500 | $113 | 70 |
| 319 Bay Park Dr | 0.33mi | 3/2.0 (-1) | 2,665 (-2%) | 20mo | $199,000 | $75 | 59 |
| 527 Pelahatchie Shore Dr | 0.35mi | 4/3.5 | 2,446 (-10%) | 11mo | $409,900 | $168 | 52 |
| 719 Forest Point Dr | 0.62mi | 3/2.5 (-1) | 2,900 (+7%) | 3mo | $565,000 | $195 | 50 |
| 24 Savannah Cir | 0.75mi | 3/2.5 (-1) | 2,508 (-8%) | 1mo | $329,900 | $132 | 45 |
| 701 Forest Point Dr | 0.66mi | 3/2.0 (-1) | 2,486 (-8%) | 13mo | $330,000 | $133 | 39 |
| 602 Forest Point Dr | 0.73mi | 4/2.5 | 2,562 (-6%) | 23mo | $549,900 | $215 | 35 |
Match score weights: distance 35% · size 25% · config 20% · recency 20%. Top-matched comps best support the ARV.
Projected returns pro-forma
-3.0% appreciation · 2.9% rent growth · sell at horizon
- IRR
- -15.8%
- Equity multiple
- 0.44×
- Total profit
- $-48,157
- Equity at exit
- $45,775
- IRR
- -7.5%
- Equity multiple
- 0.53×
- Total profit
- $-40,804
- Equity at exit
- $26,544
Cash invested: $85,960 (down + closing). Projections, not guarantees.
Landlord ↔ Tenant lean methodology
- Overall (STATE)
- 90 Strongly Landlord-Friendly
- State Mississippi
- 90 Strongly Landlord-Friendly · R+11
- County
- — inherits STATE
- City
- — inherits STATE
ZIP-level market 39047
- Home prices YoY
- -32.6%
- Rents YoY
- 2.9%
- Active inventory
- 440
- Price-to-rent
- 10.3×
Monthly cashflow live
- Estimated rent
- $2,485 medium interval (Pro) →
- Mortgage (P&I)
- −$1,610
- Tax from tax record
- −$195 /mo · $2,344/yr
- Insurance
- −$128
- HOA
- −$0
- Vacancy / Maint / Mgmt
- −$522
- Net cashflow
- $30
Break-even live
Sensitivity live
| Price | -10% $204 | -5% $117 | +0% $30 | +5% $-57 | +10% $-144 |
|---|---|---|---|---|---|
| Rent | -10% $-166 | -5% $-68 | +0% $30 | +5% $128 | +10% $226 |
| Rate | -1.0pp $185 | -0.5pp $108 | base $30 | +0.5pp $-49 | +1.0pp $-130 |
UW: 25.0% down · 7.5% · 30yr · 1.5% tax · 5.0% vac · 8.0% maint · 8.0% mgmt
Financing live
Cash to close
- Down payment
- $76,750
- Closing costs
- $9,210
- Reserves months
- —
- Total cash needed
- —
Loan-product check · same deal, 3 products live
Conventional
25% down · 7.5% · 30yr
- Down + closing
- —
- Monthly P&I
- —
- Monthly cashflow
- —
- DSCR
- —
- Eligible?
- —
Personal DTI + credit; lowest rate.
DSCR
20% down · 8.5% · 30yr
- Down + closing
- —
- Monthly P&I
- —
- Monthly cashflow
- —
- DSCR
- —
- Eligible?
- —
No personal income docs; deal must DSCR.
Hard money
10% down · 12.0% · 12mo
- Down + closing
- —
- Monthly P&I
- —
- Monthly cashflow
- —
- DSCR
- —
- Eligible?
- —
Short-term bridge; refi at stabilization.
Rent comps 1 comps
| Address | Beds | Baths | Sqft | Rent | $/sqft | DOM | Units | Dist |
|---|---|---|---|---|---|---|---|---|
| 538 Brighton Cir Brandon, MS | 4.0 | 2.0 | 2042 | $2,395 | $1.17 | 15d | 1 | 1.04mi |
Listing history 9 events
-
2026-06-15days on market $307,000 Active 12 DOM
-
2026-06-14days on market $307,000 Active 10 DOM
-
2026-06-13days on market $307,000 Active 9 DOM
-
2026-06-10days on market $307,000 Active 7 DOM
-
2026-06-09days on market $307,000 Active 6 DOM
-
2026-06-08days on market $307,000 Active 5 DOM
-
2026-06-07days on market $307,000 Active 4 DOM
-
2026-06-03remarks 33-char remark
-
2026-06-03$307,000 Active 1 DOM
ⓘ Source: listings_history table (triggers on properties + properties_extension) + one-shot
backfill from property_details.listing_events for pre-trigger history.
Tax reassessment forecast MS · Resets to sale price
- Current annual tax
- $2,344 · $195/mo
- Projected year-2 tax
- $2,425 · $202/mo
- Expected delta
- +$81/yr (+$7/mo · 3.5%)
ⓘ Screening estimate from a state-policy table — verify with the county assessor before closing.
Climate risk First Street
- Flood 1/10 Low FEMA zone X (unshaded) · 0% chance over 30 yrs
- Wildfire 1/10 Low
- Heat 7/10 Severe 7 d/yr ≥108°F today · 20 d/yr by 30 yrs out
- Wind 8/10 Severe 80% chance of damaging wind over 30 yrs
- Air quality 2/10 Low 1 unhealthy d/yr today · 1 by 30 yrs out
Nearby sold comps map
Loading sold comps map…
Walkable amenities ~0.75 mi
Loading nearby amenities…
Taxation est. · year 1
- Rental income
- $29,823
- − Mortgage interest
- −$17,197
- − Property taxes
- −$2,344
- − Insurance
- −$1,535
- − Repairs & maintenance
- −$2,386
- − Management
- −$2,386
- − Depreciation
- −$8,931
- Taxable loss
- −$4,956
- Est. tax savings @ 24.0%
- +$1,189
- After-tax cash flow
- $1,551/yr
For passive investors: Depreciation is non-cash, so a rental often shows a tax loss while cash-flowing — sheltering income. Rental losses are passive: they offset passive income freely, and up to $25,000/yr can offset ordinary (W-2) income if you actively participate and your MAGI is under $100k (phasing out to $0 by $150k); unused losses carry forward. On sale, claimed depreciation is recaptured at up to 25%, and gains may owe capital-gains tax (a 1031 exchange can defer both). Figures are a year-1 estimate at your 24.0% rate — not tax advice; consult a CPA.
Schools (NCES district)
- District
- Rankin County School District
- NCES district ID
- 2803830
- Math proficiency
- 56% ▼ -4.00%
- Reading proficiency
- 48% ▼ -6.00%
- Median HH income
- $61,867
- Composite
- 45.62/100
- National rank
- #2587
- State rank
- #6 of 130 in MS
Livability — Flowood
- Score
- 77/100
- State rank
- #10
- US rank
- #3075
Category grades
Schools grade is shown separately in the Schools card above.
Census & demographics
- County
- Rankin County · 123,614 people
- City population
- 9,222
- Metro
- Jackson, MS
- Population (ZIP)
- 40,808
- Household income
- $100,347
- Rent vs Own
- Severe rent burden
- 551.0
Population outlook (Rankin County) Hauer SSP2
- Today (2025)
- 164,317 people
- By 2030
- 171,013 · +4.1%
- By 2040
- 182,723 · +11.2%
- By 2050
- 192,376 · +17.1%
- By 2075
- 209,535 · +27.5%
- By 2100
- 209,534 · +27.5%
Race, ethnicity, and origin ACS 2023
- Neighborhood character
- Predominantly White (77%)
- Race & ethnicity
- White 77% Black 16% Two or more races 4% Hispanic / Latino 2% Asian 1%
- Common ancestry
- Italian 4% Slovak 3% Serbian 3%
- Foreign-born
- 3% · Canada
- Languages at home
- 95% English-only · Spanish 3% Other Indo-European 1% Other Asian/Pacific 1%
Political lean MEDSL · Rankin
- 2024 margin
- Solid R (+47.1) · D 25.9% · R 73.0% · Other 1.0%
- 2008→2024 swing
- +6.4pp toward D · 2008: -53.5pp · 2024: -47.1pp
- All cycles
- 2024: R+47.1 2020: R+45.4 2016: R+52.9 2012: R+51.9 2008: R+53.5
Not yet ingested
- Civics
- —
Market trends
- HPI YoY
- ▼ -79.01%
- Current HPI
- 162.9709
- Rent YoY
- ▲ 2.90%
- Metro
- Jackson, MS
- State GDP YoY
- —
- F500 in state
- 0
Price history
+6.2% since first listed6 events — show timeline
- 2026-06-03 Listed $307,000 MLSU
- 2022-08-09 Pending — MLSU
- 2022-08-09 Sold (MLS) — MLSU
- 2022-07-16 Contingent — MLSU
- 2022-04-27 Pending — MLSU
- 2022-04-10 Listed $289,000 MLSU
Property tax history
+11.6%/yrLatest (2025): $2,344 · -29.7% YoY. Source: county tax records.
Cash-flow waterfall
monthlySold comps — $/sqft
last 12 mo · ≤1 miLoading sold comps…