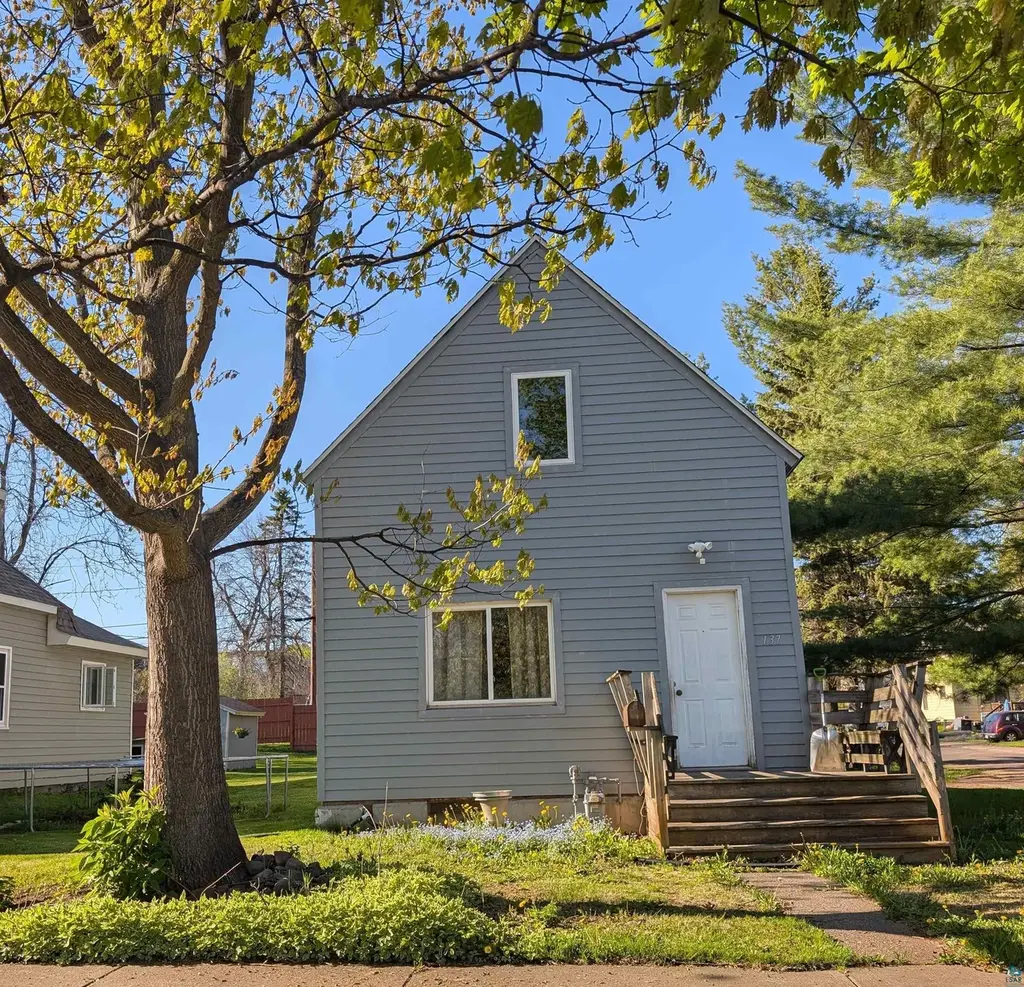
137 W Palm St · Duluth, MN
Flood risk 4/10 · Minor
- FEMA flood zone
- X
- Chance of flooding over 30 yrs
- 0.22%
- Est. flood insurance / yr
- $473 – $860
Fire risk 1/10 · Minimal
- Est. fire insurance / yr
- $888 – $1,650
Heat risk 1/10 · Minimal
- Hot days now (above 91°F)
- 7 days/yr
- Hot days in 30 yrs
- 12 days/yr
Wind risk 1/10 · Minimal
- Chance of severe wind over 30 yrs
- —
Air-quality risk 2/10 · Minimal
- Unhealthy air days now
- 0 days/yr
- Unhealthy air days in 30 yrs
- 1 days/yr
Risk factors via First Street. Map © Google.
Why this score? — see what drove the B grade
The composite is a weighted blend of 9 inputs, each scored 0–100. Each bar is that input's sub-score; the figure is the points it added to the 100-point composite (weight × sub-score).
- Cash flow +30.0/30.0
- 1% rule +10.0/10.0
- DSCR +10.0/10.0
- ARV discount +7.5/15.0
- Schools +4.2/10.0
- Livability +4.1/5.0
- Rent growth +3.7/5.0
- Condition / age +2.5/5.0
- Appreciation +0.0/10.0
$70,000
🖨 Deal sheet 📄 Offer letter ✓ Due diligence
Listing remarks
Attention investors and seasoned buyers! This 2-bedroom, 2-bath home has a solid start with newer roof and siding already in place. The main level features a functional layout with a living room, dining room, and kitchen, bonus space ready for whatever your imagination can create, while upstairs offers two bedrooms and a full bath. Outside, is a 15x21 storage building that's in rough shape. With updates and finishing touches, this property has great potential to build equity, restore its charm, or turn into a profitable flip or rental. Conveniently located in Duluth close to shopping, amenities, and public transit.
Key facts
- Newer roof
- Storage building
- Newer siding
Tags
Property features AI
Exterior
- Parking: No on-site parking
- Utilities: Public water; Public sewer
- Home design: Single-family detached home; One story
- Construction: Above-grade finished area; Below-grade finished area
- Exterior features: Metal, asphalt shingle roof; Corner lot; Paved city street frontage; Shed(s)
Interior
- Kitchen: Dishwasher; Range; Microwave; Refrigerator
- Bathrooms: 1 full bathroom; 1 half bathroom
- Heating & cooling: Forced air heating; Natural gas heating
- Interior features: Basement is full and unfinished
- Laundry & utility: Washer; Dryer
Neighborhood map
What this means for you Summary
Snapshot
- This is a 2-bed/2.0-bath single-family listed at $70k.
Deal economics
- At list price, monthly cash flow is $1k ($18k/yr) — positive.
- The deal already cash-flows at list — no discount required.
- Meets the 1% rule at list price ($3k rent vs $70k).
- Cap rate 31.8% vs local median 4.9% in Duluth — top-decile yield for the area; either an underpriced asset or a hidden risk that comps aren't pricing in. Stress-test before assuming the spread holds.
Location & tenants
- Location reads 82/100 on livability (#36 in MN, #1,060 nationally) — a professional / high-income tenant draw. Strengths: commute A+, cost of living A+, housing A+; Watch: amenities F.
- Duluth Public School District (urban): math 44% / reading 55% proficiency, ranked #132 of 301 in MN (top 44%) — families likely to look elsewhere, expect single-tenant / working-renter base with shorter leases.
- Market conditions: Rents rising fast (+4.6%/yr); 206 active listings in the ZIP; 3 comparable units currently listed for rent nearby; rentals lingering (median 44d on market — plan ~5-8 weeks vacancy on turnover, expect pricing pressure); 67% of comp listings sitting > 30 days — soft ceiling on asking rent; solid renter incomes; 639 units permitted in St. Louis County in 2024 (338 in 5+ unit buildings).
- This rent runs 39% of the median local income ($80k/yr) — at the standard rent-burdened threshold; future hikes will face affordability resistance.
Forward outlook
- Local home prices are declining (-3.0%/yr); year-one equity from $484 of loan paydown is wiped out by about $2k of value loss. Plan a longer hold.
- At projected returns (-3.0% appreciation + 4.6% rent growth), your $20k cash investment doubles in ~2 years — after that, you're playing with house money.
Negotiation context
- Only 3 days on market — expect competitive offers; lowballing is unlikely to land.
Risks & watch-outs
- Watch-outs: property tax is 2.9% of price; built in 1893 — expect roof / HVAC / electrical / plumbing capex.
Questions for the listing agent
- Built in 1893 — when were the roof, HVAC, electrical panel, plumbing, and water heater last replaced?
- Property tax is high relative to price — has the assessment been appealed recently, and will the sale trigger a re-assessment?
- Is there a deadline driving the sale (1031 exchange, divorce, estate, relocation)? That informs how much negotiation room exists.
- Schools are B-rated — typically a magnet for longer-tenancy family renters. What's the average tenant stay here, and is there a school-zone premium baked into asking?
- What's the average days-on-market for RENTAL listings here right now (not sales)? A rising rental-DOM trend means longer vacancies and softer asking-rent achievability than the comps imply.
- What's the recent tenant-quality profile in this submarket — average credit score on applications, eviction rate, late-payment / NSF rate, and stable-employment percentage? A property-management company in the area should have these aggregated.
- How much new for-sale + rental construction is in the pipeline within 1–3 miles? Heavy new supply typically softens prices + rents 12–24 months out; constrained supply supports both.
Investment metrics
- 1% rule
- 3.71% ✓
- Cap rate
- 31.78%
- Cash-on-cash
- 91.01%
- DSCR
- 5.05
- GRM
- 2.2
CMA / ARV
- ARV (on-the-fly)
- $245,946
- Comps found
- 12
Show comp detail 12 sales within ~0.75 mi
| Address | Dist | Beds/Ba | Sqft | Sold | Price | $/sf | Match |
|---|---|---|---|---|---|---|---|
| 137 W Palm St | 0.00mi | 2/1.5 | 1,086 (+1%) | 0mo | $70,000 | $64 | 96 |
| 148 W Central Entrance | 0.04mi | 2/1.0 | 1,020 (-5%) | 4mo | $59,000 | $58 | 82 |
| 129 W Quince St | 0.16mi | 3/1.0 (+1) | 1,054 (-2%) | 9mo | $175,900 | $167 | 73 |
| 162 W Central Entrance | 0.06mi | 3/1.5 (+1) | 1,134 (+6%) | 17mo | $87,500 | $77 | 67 |
| 128 W Quince St | 0.19mi | 3/1.8 (+1) | 1,093 (+2%) | 22mo | $250,000 | $229 | 64 |
| 817 Maple Bend Dr | 0.46mi | 3/1.5 (+1) | 1,125 (+5%) | 2mo | $347,000 | $308 | 62 |
| 29 W Ideal St | 0.71mi | 1/2.0 (-1) | 1,068 (-1%) | 2mo | $256,000 | $240 | 59 |
| 30 W Linden St | 0.23mi | 3/1.0 (+1) | 1,170 (+9%) | 11mo | $285,000 | $244 | 56 |
| 827 Robin Ave | 0.53mi | 3/1.0 (+1) | 1,082 (+1%) | 10mo | $228,000 | $211 | 56 |
| 202 E Locust St | 0.46mi | 3/1.0 (+1) | 1,152 (+7%) | 11mo | $300,000 | $260 | 48 |
| 516 W Quince St | 0.43mi | 3/1.0 (+1) | 1,169 (+9%) | 22mo | $231,500 | $198 | 38 |
| 322 E Gilead St | 0.73mi | 2/3.0 | 944 (-12%) | 21mo | $240,000 | $254 | 24 |
Match score weights: distance 35% · size 25% · config 20% · recency 20%. Top-matched comps best support the ARV.
Projected returns pro-forma
-3.0% appreciation · 4.6% rent growth · sell at horizon
- IRR
- 93.6%
- Equity multiple
- 5.47×
- Total profit
- $87,664
- Equity at exit
- $10,437
- IRR
- 96.8%
- Equity multiple
- 12.05×
- Total profit
- $216,598
- Equity at exit
- $6,052
Cash invested: $19,600 (down + closing). Projections, not guarantees.
Landlord ↔ Tenant lean methodology
- Overall (STATE)
- 46 Balanced
- State Minnesota
- 46 Balanced · D+2
- County
- — inherits STATE
- City
- — inherits STATE
ZIP-level market 55811
- Rents YoY
- 4.6%
- Active inventory
- 206
- Price-to-rent
- 2.2×
Monthly cashflow live
- Estimated rent
- $2,595 medium interval (Pro) →
- Mortgage (P&I)
- −$367
- Tax from tax record
- −$167 /mo · $2,008/yr
- Insurance
- −$29
- HOA
- −$0
- Vacancy / Maint / Mgmt
- −$545
- Net cashflow
- $1,486
Break-even live
UW: 25.0% down · 7.5% · 30yr · 1.5% tax · 5.0% vac · 8.0% maint · 8.0% mgmt
Financing live
Cash to close
- Down payment
- $17,500
- Closing costs
- $2,100
- Reserves months
- —
- Total cash needed
- —
Loan-product check · same deal, 3 products live
Conventional
25% down · 7.5% · 30yr
- Down + closing
- —
- Monthly P&I
- —
- Monthly cashflow
- —
- DSCR
- —
- Eligible?
- —
Personal DTI + credit; lowest rate.
DSCR
20% down · 8.5% · 30yr
- Down + closing
- —
- Monthly P&I
- —
- Monthly cashflow
- —
- DSCR
- —
- Eligible?
- —
No personal income docs; deal must DSCR.
Hard money
10% down · 12.0% · 12mo
- Down + closing
- —
- Monthly P&I
- —
- Monthly cashflow
- —
- DSCR
- —
- Eligible?
- —
Short-term bridge; refi at stabilization.
Rent comps 3 comps
| Address | Beds | Baths | Sqft | Rent | $/sqft | DOM | Units | Dist |
|---|---|---|---|---|---|---|---|---|
| 505 W Orange St Duluth, MN | 3.0 | 1.0 | 1022 | $3,500 | $3.42 | 43d | 1 | 0.36mi |
| 502 N Oak Bend Dr Duluth, MN | 1.0–2.0 | 1.0 | 857 | $1,549 | $1.81 | 13d | 1 | 0.92mi |
| 3424 Eischen Ct Apt 301 Duluth, MN | 3.0 | 1.0 | 1020 | $2,195 | $2.15 | 43d | 1 | 1.39mi |
Listing history 3 events
-
2026-06-01statusdays on market $70,000 Pending 3 DOM
-
2026-05-31days on market $70,000 Active 2 DOM
-
2026-05-29$70,000 Active
ⓘ Source: listings_history table (triggers on properties + properties_extension) + one-shot
backfill from property_details.listing_events for pre-trigger history.
Tax reassessment forecast MN · Partial reset (capped growth)
- Current annual tax
- $2,008 · $167/mo
- Projected year-2 tax
- $2,008 · $167/mo
- Expected delta
- $0/yr ($0/mo · 0.0%)
ⓘ Screening estimate from a state-policy table — verify with the county assessor before closing.
Climate risk First Street
- Flood 4/10 Moderate FEMA zone X · 22% chance over 30 yrs
- Wildfire 1/10 Low
- Heat 1/10 Low 7 d/yr ≥91°F today · 12 d/yr by 30 yrs out
- Wind 1/10 Low
- Air quality 2/10 Low 0 unhealthy d/yr today · 1 by 30 yrs out
Nearby sold comps map
Loading sold comps map…
Walkable amenities ~0.75 mi
Loading nearby amenities…
Taxation est. · year 1
- Rental income
- $31,140
- − Mortgage interest
- −$3,921
- − Property taxes
- −$2,008
- − Insurance
- −$350
- − Repairs & maintenance
- −$2,491
- − Management
- −$2,491
- − Depreciation
- −$2,036
- Taxable income
- $17,842
- Est. tax owed @ 24.0%
- −$4,282
- After-tax cash flow
- $13,556/yr
For passive investors: Depreciation is non-cash, so a rental often shows a tax loss while cash-flowing — sheltering income. Rental losses are passive: they offset passive income freely, and up to $25,000/yr can offset ordinary (W-2) income if you actively participate and your MAGI is under $100k (phasing out to $0 by $150k); unused losses carry forward. On sale, claimed depreciation is recaptured at up to 25%, and gains may owe capital-gains tax (a 1031 exchange can defer both). Figures are a year-1 estimate at your 24.0% rate — not tax advice; consult a CPA.
Schools (NCES district)
- District
- Duluth Public School District
- NCES district ID
- 2711040
- Math proficiency
- 44% ▼ -10.00%
- Reading proficiency
- 55% ▼ -6.00%
- Median HH income
- $45,692
- Composite
- 41.92/100
- National rank
- #3360
- State rank
- #132 of 301 in MN
Livability — Duluth
- Score
- 82/100
- State rank
- #36
- US rank
- #1060
Category grades
Schools grade is shown separately in the Schools card above.
Census & demographics
- Census place
- Duluth, MN
- County
- Saint Louis County · 115,152 people
- City population
- 71,097
- Metro
- Duluth, MN-WI
- Population (ZIP)
- 28,118
- Household income
- $79,804
- Rent vs Own
- Severe rent burden
- 1019.0
Population outlook (St. Louis County) Hauer SSP2
- Today (2025)
- 202,411 people
- By 2030
- 203,234 · +0.4%
- By 2040
- 202,520 · +0.1%
- By 2050
- 200,853 · -0.8%
- By 2075
- 200,943 · -0.7%
- By 2100
- 192,058 · -5.1%
Race, ethnicity, and origin ACS 2023
- Neighborhood character
- Predominantly White (91%)
- Race & ethnicity
- White 91% Two or more races 4% Hispanic / Latino 2% Asian 2% Black 1%
- Common ancestry
- Portuguese 14% Romanian 7% Lithuanian 3%
- Foreign-born
- 2% · Canada
- Languages at home
- 97% English-only · Spanish 1% Other Indo-European 1%
Political lean MEDSL · St. Louis
- 2024 margin
- D (+13.7) · D 55.9% · R 42.2% · Other 1.8%
- 2008→2024 swing
- -18.8pp toward R · 2008: 32.5pp · 2024: 13.7pp
- All cycles
- 2024: D+13.7 2020: D+15.6 2016: D+11.8 2012: D+29.6 2008: D+32.5
Not yet ingested
- Civics
- —
Market trends
- HPI YoY
- ▼ -252.84%
- Current HPI
- 198.2613
- Rent YoY
- ▲ 4.60%
- Metro
- Duluth, MN-WI
- State GDP YoY
- ▲ 2.41%
- F500 in state
- 34
Industry mix (Fortune 500 HQ in MN)
| Industry | F500 HQs | Revenue |
|---|---|---|
| Healthcare | 2 | $407B |
|
||
| Retail | 2 | $150B |
|
||
| Consumer Goods | 2 | $32B |
|
||
| Industrial Machinery | 2 | $6B |
|
||
| Agriculture | 1 | $40B |
|
||
| Healthcare / Medical Devices | 1 | $32B |
|
||
Price history
1 event — show timeline
- 2026-05-29 Listed $70,000 LSAR
Property tax history
+5.2%/yrLatest (2025): $2,008 · -1.5% YoY. Source: county tax records.
Cash-flow waterfall
monthlySold comps — $/sqft
last 12 mo · ≤1 miLoading sold comps…