 🌊 Lakefront
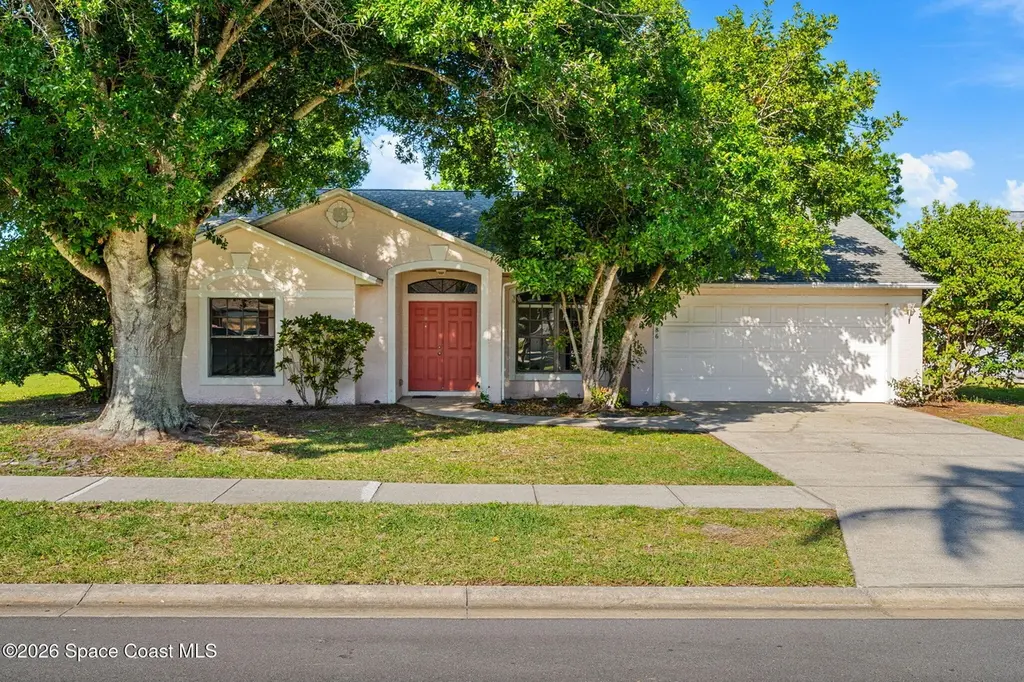
2086 Lionel Dr · Viera East, FL
Flood risk 1/10 · Minimal
- FEMA flood zone
- X (unshaded)
- Chance of flooding over 30 yrs
- 0.0%
- Est. flood insurance / yr
- $507 – $1,088
Fire risk 2/10 · Minimal
- Est. fire insurance / yr
- $947 – $1,759
Heat risk 10/10 · Severe
- Hot days now (above 104°F)
- 7 days/yr
- Hot days in 30 yrs
- 22 days/yr
Wind risk 10/10 · Severe
- Chance of severe wind over 30 yrs
- 99.0%
Air-quality risk 1/10 · Minimal
- Unhealthy air days now
- 0 days/yr
- Unhealthy air days in 30 yrs
- 0 days/yr
Risk factors via First Street. Map © Google.
Why this score? — see what drove the C- grade
The composite is a weighted blend of 9 inputs, each scored 0–100. Each bar is that input's sub-score; the figure is the points it added to the 100-point composite (weight × sub-score).
- Cash flow +15.3/30.0
- ARV discount +7.5/15.0
- Appreciation +5.2/10.0
- DSCR +4.7/10.0
- Schools +4.7/10.0
- 1% rule +4.4/10.0
- Livability +4.0/5.0
- Rent growth +3.0/5.0
- Condition / age +2.5/5.0
$289,000
🖨 Deal sheet 📄 Offer letter ✓ Due diligence
Listing remarks
Whether you're an investor or a buyer with vision, this is an opportunity you won't want to miss. Located in desirable Six Mile Creek, this 3 bedroom, 2 bathroom lakefront home is priced for condition and ready for a full renovation. CASH ONLY sale. The property features a screened patio overlooking the water, offering incredible lake views and a peaceful backdrop with mature shade trees. Inside, the layout includes an indoor laundry room and a functional footprint ready to be reimagined, including the potential to design a dream kitchen with water views. This is a rare chance to get into East Viera at this price point and truly make it your own. Conveniently located near The Avenues Viera,
Key facts
- Screened patio
- Near golf courses
- Indoor laundry room
Tags
Property features AI
Finance
- HOA & community: Part of Six Mile Creek association; Association amenities include jogging path, maintained grounds and a playground; Association fees listed annually
Exterior
- Parking: Attached garage; 2-car garage
- Utilities: Public sewer; Water available; Electricity available; Natural gas available; Cable available
- Home design: Single-family residence; One story; Entry level: 1; East-facing
- Construction: Block, concrete and stucco construction; Shingle roof
- Exterior features: Patio; Screened patio; Many trees; Asphalt road access; Lakefront and pond on the property (waterfront)
Interior
- Kitchen: Dishwasher; Gas range; Microwave; Refrigerator; Breakfast bar; Eat-in kitchen; Pantry
- Bedrooms: 3 bedrooms (one-story entry level)
- Flooring: Carpet; Laminate; Tile
- Bathrooms: 2 full bathrooms
- Heating & cooling: Natural gas heating; Central electric air conditioning
- Interior features: Breakfast bar; Eat-in kitchen; Pantry; Primary bathroom with tub and separate shower; Split bedroom floorplan; Vaulted ceilings; Wood-burning fireplace
- Laundry & utility: In-unit laundry; Washer hookup; Gas dryer hookup; Washer and dryer included
Neighborhood map
What this means for you Summary
Snapshot
- This is a 3-bed/2.0-bath single-family listed at $289k.
Deal economics
- At list price, monthly cash flow is $106 ($1k/yr) — positive.
- The deal already cash-flows at list — no discount required.
- To meet the 1% rule (rent ≥ 1% of price), the offer needs to be $273k (5.6% below list).
- Recommended offer: $273k (5.6% below list) — sets the bar for 1% rule.
Location & tenants
- Location reads 79/100 on livability (#141 in FL, #1,964 nationally) — a middle-class / working-renter tenant base. Strengths: crime A+, employment A+, housing A+; Watch: commute D+, amenities F.
- Brevard (suburban): math 53% / reading 57% proficiency, ranked #19 of 73 in FL (top 26%) — acceptable for families but not a draw, mixed tenant base, ~2y average lease.
- Zoned schools: Quest Elementary School (math 83% / reading 80%, grade A+, #90 of 2,144 statewide, top 4%, 691 students, 20% FRL); John F. Kennedy Middle School (math 67% / reading 59%, grade B+, #111 of 571 statewide, top 20%, 673 students, 41% FRL); Viera High School (math 58% / reading 71%, grade B-, #78 of 667 statewide, top 13%, 2,289 students, 15% FRL) — zoned schools average 25% FRL vs 43% district-wide (18 pts lower); this property's tenant base skews higher-income than the district average.
- Zoned-school proficiency averages 70% at this address vs 55% district-wide (+15 pts) — the actual schools serving this property are materially stronger than the Brevard average implies; a family-tenant draw the district grade alone would hide.
- Market conditions: Rents rising (+2.0%/yr); 583 active listings in the ZIP; 19 comparable units currently listed for rent nearby; rentals at typical pace (median 19d on market — plan ~3-4 weeks tenant-placement turnaround); high-income renter base; 4,602 units permitted in Brevard County in 2024 (702 in 5+ unit buildings).
Forward outlook
- In year one you build about $3k of equity ($2k loan paydown + $1k appreciation (0.4% local appreciation)).
- Brevard County population projected at +15% by 2050 — modest demand growth; plan on rents tracking national, not racing it.
- By year 9, paydown + projected appreciation supports a ~$33k cash-out refi (75% LTV) — recoverable capital for the next deal without selling this one.
Negotiation context
- Only 3 days on market — expect competitive offers; lowballing is unlikely to land.
- Current owner paid $93k; list at $289k implies a 211% gain — meaningful room to come down on a strong offer.
Risks & watch-outs
- Climate carrying-cost: severe wind risk, 99% chance of damaging wind over 30y; extreme-heat days projected 7→22/yr by 2055 (HVAC capex compounding) — expect insurance premiums to compound above CPI over the hold.
Questions for the listing agent
- What does the HOA fee cover, when was the last increase, and are there any pending special assessments or reserve-fund shortfalls?
- Is there a deadline driving the sale (1031 exchange, divorce, estate, relocation)? That informs how much negotiation room exists.
- Schools are F-rated, which usually means shorter tenancies and higher turnover. Who's the typical renter profile here, and what's been the actual vacancy rate?
- This sits on a lake — are riparian / water-frontage rights deeded with the parcel? Any dock permits, shoreline easements, or HOA water-use restrictions?
- What's the documented flood / surge / shoreline-erosion history here (FEMA AND non-FEMA — e.g., storm surge, creek backup, septic-field saturation)?
- Any water-quality or seasonal algae-bloom issues that affect tenant satisfaction or short-term-rental demand?
- What's the average days-on-market for RENTAL listings here right now (not sales)? A rising rental-DOM trend means longer vacancies and softer asking-rent achievability than the comps imply.
- What's the recent tenant-quality profile in this submarket — average credit score on applications, eviction rate, late-payment / NSF rate, and stable-employment percentage? A property-management company in the area should have these aggregated.
- How much new for-sale + rental construction is in the pipeline within 1–3 miles? Heavy new supply typically softens prices + rents 12–24 months out; constrained supply supports both.
Investment metrics
- 1% rule
- 0.94% ✗
- Cap rate
- 6.73%
- Cash-on-cash
- 1.57%
- DSCR
- 1.07
- GRM
- 8.8
CMA / ARV
No comps found within radius.
Projected returns pro-forma
0.4% appreciation · 1.96% rent growth · sell at horizon
- IRR
- 0.3%
- Equity multiple
- 1.01×
- Total profit
- $1,060
- Equity at exit
- $89,790
- IRR
- 4.8%
- Equity multiple
- 1.53×
- Total profit
- $42,813
- Equity at exit
- $112,738
Cash invested: $80,920 (down + closing). Projections, not guarantees.
Landlord ↔ Tenant lean methodology
- Overall (STATE)
- 87 Strongly Landlord-Friendly
- State Florida
- 87 Strongly Landlord-Friendly · R+3
- County
- — inherits STATE
- City
- — inherits STATE
ZIP-level market 32940
- Home prices YoY
- 0.1%
- Rents YoY
- 2.0%
- Active inventory
- 583
- Price-to-rent
- 8.8×
Monthly cashflow live
- Estimated rent
- $2,729 high interval (Pro) →
- Mortgage (P&I)
- −$1,516
- Tax from tax record
- −$367 /mo · $4,403/yr
- Insurance
- −$120
- HOA
- −$47
- Vacancy / Maint / Mgmt
- −$573
- Net cashflow
- $106
Break-even live
UW: 25.0% down · 7.5% · 30yr · 1.5% tax · 5.0% vac · 8.0% maint · 8.0% mgmt
Financing live
Cash to close
- Down payment
- $72,250
- Closing costs
- $8,670
- Reserves months
- —
- Total cash needed
- —
Loan-product check · same deal, 3 products live
Conventional
25% down · 7.5% · 30yr
- Down + closing
- —
- Monthly P&I
- —
- Monthly cashflow
- —
- DSCR
- —
- Eligible?
- —
Personal DTI + credit; lowest rate.
DSCR
20% down · 8.5% · 30yr
- Down + closing
- —
- Monthly P&I
- —
- Monthly cashflow
- —
- DSCR
- —
- Eligible?
- —
No personal income docs; deal must DSCR.
Hard money
10% down · 12.0% · 12mo
- Down + closing
- —
- Monthly P&I
- —
- Monthly cashflow
- —
- DSCR
- —
- Eligible?
- —
Short-term bridge; refi at stabilization.
Rent comps 19 comps
| Address | Beds | Baths | Sqft | Rent | $/sqft | DOM | Units | Dist |
|---|---|---|---|---|---|---|---|---|
| 1914 Jacques Dr Melbourne, FL | 3.0 | 2.0 | 1575 | $3,400 | $2.16 | 23d | 1 | 0.14mi |
| 1622 Laramie Cir Melbourne, FL | 3.0 | 2.0 | 1390 | $2,600 | $1.87 | 14d | 1 | 0.40mi |
| 2185 Judge Fran Jamieson Way Melbourne, FL | 1.0–3.0 | 1.0–2.0 | 1192 | $2,365 | $1.98 | 13d | 17 | 0.49mi |
| 1092 Egret Lake Way Melbourne, FL | 4.0 | 3.0 | 2218 | $2,750 | $1.24 | 23d | 1 | 0.51mi |
| 6411 Borasco Dr Melbourne, FL | 2.0–3.0 | 2.0 | 1258 | $2,195 | $1.74 | 23d | 1 | 0.58mi |
| 5693 Star Rush Dr #207 Melbourne, FL | 2.0 | 2.0 | 1139 | $1,695 | $1.49 | 23d | 1 | 0.61mi |
| 1747 Sophias Dr #202 Melbourne, FL | 3.0 | 2.0 | 1278 | $2,200 | $1.72 | 14d | 1 | 0.62mi |
| 1747 Sophias Dr Melbourne, FL | 2.0–3.0 | 2.0 | 1149 | $2,200 | $1.91 | 23d | 2 | 0.62mi |
| 6431 Borasco Dr Melbourne, FL | 1.0–2.0 | 1.0–2.0 | 869 | $1,950 | $2.24 | 19d | 2 | 0.64mi |
| 2301 Willet Pl Melbourne, FL | 1.0–3.0 | 1.0–2.0 | 1109 | $3,420 | $3.08 | 13d | 27 | 0.67mi |
| 2061 Tiburon Ln Melbourne, FL | 3.0 | 2.0 | 1506 | $2,350 | $1.56 | 23d | 1 | 0.71mi |
| 2560 Judge Fran Jamieson Way Melbourne, FL | 1.0–3.0 | 1.0–2.0 | 1091 | $2,660 | $2.44 | 13d | 14 | 0.77mi |
| 2992 Rodina Dr Melbourne, FL | 1.0–2.0 | 1.0–2.0 | 963 | $2,585 | $2.68 | 14d | 8 | 1.00mi |
| 6705 Shadow Creek Trl Melbourne, FL | 1.0–3.0 | 1.0–2.0 | 1123 | $2,795 | $2.49 | 13d | 25 | 1.02mi |
| 1703 Mission Bay Cir Rockledge, FL | 1.0–3.0 | 1.0–2.0 | 927 | $1,466 | $1.58 | 13d | 12 | 1.10mi |
| 1851 Long Iron Dr #901 Rockledge, FL | 2.0 | 2.0 | 1118 | $1,700 | $1.52 | 23d | 1 | 1.19mi |
| 2439 Casona Ln Melbourne, FL | 1.0–2.0 | 1.0–2.0 | 964 | $2,251 | $2.34 | 13d | 14 | 1.21mi |
| 915 Starling Way Rockledge, FL | 3.0 | 2.0 | 2202 | $3,495 | $1.59 | 19d | 1 | 1.23mi |
| 8880 Napolo Dr Melbourne, FL | 4.0 | 3.5 | 2250 | $3,600 | $1.60 | 23d | 1 | 1.45mi |
HOA detail
- Monthly dues
- $47 · $564/yr
- Likely covers
- water
Listing history 4 events
-
2026-05-05status Pending
-
2026-05-01$289,000 Active
-
1991-08-01soldstatus $93,000
-
1991-04-01soldstatus $28,900
ⓘ Source: listings_history table (triggers on properties + properties_extension) + one-shot
backfill from property_details.listing_events for pre-trigger history.
Tax reassessment forecast FL · Resets to sale price
- Current annual tax
- $4,403 · $367/mo
- Projected year-2 tax
- $4,403 · $367/mo
- Expected delta
- $0/yr ($0/mo · 0.0%)
ⓘ Screening estimate from a state-policy table — verify with the county assessor before closing.
Climate risk First Street
- Flood 1/10 Low FEMA zone X (unshaded) · 0% chance over 30 yrs
- Wildfire 2/10 Low
- Heat 10/10 Extreme 7 d/yr ≥104°F today · 22 d/yr by 30 yrs out
- Wind 10/10 Extreme 99% chance of damaging wind over 30 yrs
- Air quality 1/10 Low 0 unhealthy d/yr today · 0 by 30 yrs out
Nearby sold comps map
Loading sold comps map…
Walkable amenities ~0.75 mi
Loading nearby amenities…
Taxation est. · year 1
- Rental income
- $32,747
- − Mortgage interest
- −$16,188
- − Property taxes
- −$4,403
- − Insurance
- −$1,445
- − Repairs & maintenance
- −$2,620
- − Management
- −$2,620
- − HOA
- −$564
- − Depreciation
- −$8,407
- Taxable loss
- −$3,501
- Est. tax savings @ 24.0%
- +$840
- After-tax cash flow
- $2,111/yr
For passive investors: Depreciation is non-cash, so a rental often shows a tax loss while cash-flowing — sheltering income. Rental losses are passive: they offset passive income freely, and up to $25,000/yr can offset ordinary (W-2) income if you actively participate and your MAGI is under $100k (phasing out to $0 by $150k); unused losses carry forward. On sale, claimed depreciation is recaptured at up to 25%, and gains may owe capital-gains tax (a 1031 exchange can defer both). Figures are a year-1 estimate at your 24.0% rate — not tax advice; consult a CPA.
Schools (NCES district)
- District
- Brevard
- NCES district ID
- 1200150
- Math proficiency
- 53% ▼ -9.00%
- Reading proficiency
- 57% ▼ -4.00%
- Median HH income
- $49,426
- Composite
- 46.86/100
- National rank
- #2370
- State rank
- #19 of 73 in FL
Livability — Viera East
- Score
- 79/100
- State rank
- #141
- US rank
- #1964
Category grades
Schools grade is shown separately in the Schools card above.
Census & demographics
- Census place
- Viera East, FL
- County
- Brevard County · 602,871 people
- Metro
- Palm Bay-Melbourne-Titusville, FL
- Population (ZIP)
- 51,727
- Household income
- $110,495
- Rent vs Own
- Severe rent burden
- 873.0
Population outlook (Brevard County) Hauer SSP2
- Today (2025)
- 623,254 people
- By 2030
- 648,420 · +4.0%
- By 2040
- 690,009 · +10.7%
- By 2050
- 715,669 · +14.8%
- By 2075
- 775,744 · +24.5%
- By 2100
- 776,687 · +24.6%
Race, ethnicity, and origin ACS 2023
- Neighborhood character
- Predominantly White (77%)
- Race & ethnicity
- White 77% Hispanic / Latino 10% Two or more races 9% Asian 5% Black 3%
- Hispanic origin (detail)
- Mexican 1% Puerto Rican 3% Cuban 1%
- Common ancestry
- Romanian 4% Lithuanian 3% Slovak 2%
- Foreign-born
- 11% · Canada, Jamaica, China
- Languages at home
- 88% English-only · Spanish 6% Other Indo-European 2% German/W. Germanic 1%
Political lean MEDSL · Brevard
- 2024 margin
- Strong R (+20.8) · D 39.1% · R 59.9% · Other 1.0%
- 2008→2024 swing
- -10.4pp toward R · 2008: -10.4pp · 2024: -20.8pp
- All cycles
- 2024: R+20.8 2020: R+16.4 2016: R+19.8 2012: R+12.7 2008: R+10.4
Not yet ingested
- Civics
- —
Market trends
- HPI YoY
- ▲ 0.40%
- Current HPI
- 298.1023
- Rent YoY
- ▲ 1.96%
- Metro
- Palm Bay-Melbourne-Titusville, FL
- State GDP YoY
- ▲ 3.28%
- F500 in state
- 36
Industry mix (Fortune 500 HQ in FL)
| Industry | F500 HQs | Revenue |
|---|---|---|
| Industrial Technology | 2 | $29B |
|
||
| Insurance | 2 | $17B |
|
||
| Retail | 1 | $60B |
|
||
| Technology Distribution | 1 | $58B |
|
||
| Homebuilding | 1 | $35B |
|
||
| Technology Manufacturing | 1 | $35B |
|
||
Price history
+900.0% since first listed4 events — show timeline
- 2026-05-05 Pending — SCMLS
- 2026-05-01 Listed $289,000 SCMLS
- 1991-08-01 Sold (Public Records) $93,000 Public Records
- 1991-04-01 Sold (Public Records) $28,900 Public Records
Property tax history
+9.7%/yrLatest (2025): $4,403 · +2.8% YoY. Source: county tax records.
Cash-flow waterfall
monthlySold comps — $/sqft
last 12 mo · ≤1 miLoading sold comps…