 🏷️ Likely Rental
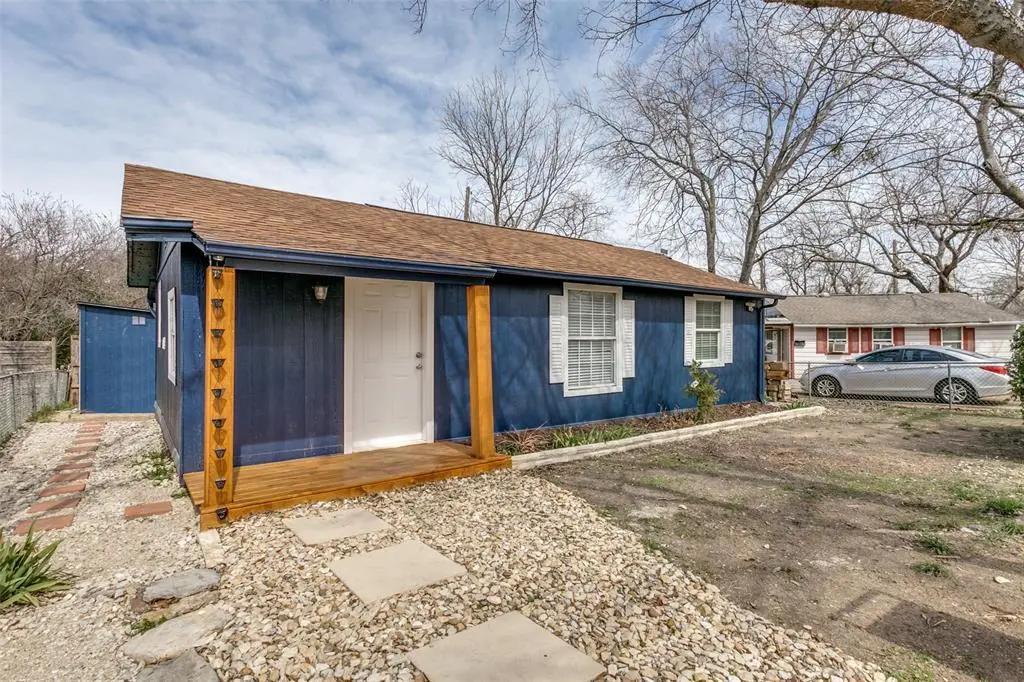
237 Conner Plz · Lewisville, TX
Flood risk 1/10 · Minimal
- FEMA flood zone
- X (unshaded)
- Chance of flooding over 30 yrs
- 0.0%
- Est. flood insurance / yr
- $507 – $1,088
Fire risk 3/10 · Minor
- Est. fire insurance / yr
- $1,222 – $2,270
Heat risk 7/10 · Major
- Hot days now (above 109°F)
- 7 days/yr
- Hot days in 30 yrs
- 21 days/yr
Wind risk 5/10 · Moderate
- Chance of severe wind over 30 yrs
- 26.0%
Air-quality risk 4/10 · Minor
- Unhealthy air days now
- 4 days/yr
- Unhealthy air days in 30 yrs
- 5 days/yr
Risk factors via First Street. Map © Google.
Why this score? — see what drove the C grade
The composite is a weighted blend of 9 inputs, each scored 0–100. Each bar is that input's sub-score; the figure is the points it added to the 100-point composite (weight × sub-score).
- Cash flow +18.8/30.0
- ARV discount +15.0/15.0
- DSCR +5.9/10.0
- Schools +4.7/10.0
- 1% rule +4.2/10.0
- Livability +3.5/5.0
- Condition / age +2.5/5.0
- Rent growth +1.7/5.0
- Appreciation +0.0/10.0
$175,000
🖨 Deal sheet 📄 Offer letter ✓ Due diligence
Listing remarks
Fantastic investment opportunity! Charming home nestled in a quiet cul-de-sac near downtown Lewisville. Ideally located just minutes from the hospital, grocery stores, and dining, with strong tenant demand. This beautifully renovated property comes fully equipped with all appliances. Currently tenant-occupied at $1,550 per month, with the lease in place through December, providing immediate rental income. A great addition to any investment portfolio.
Key facts
- Quiet cul-de-sac
- 3,093 sq ft lot
- Built 1969
Tags
Property features AI
Finance
- Other: Property treated as clear for loan purposes; No second mortgage indicated
- Financial info: Listing accepts Cash and Conventional terms
- HOA & community: No homeowners association
Exterior
- Parking: Off-street parking
- Utilities: City water; City sewer; Electricity connected; Not in a municipal utility district
- Home design: Single family residence; Residential property; One story
- Construction: Built in 1969; Wood construction
- Exterior features: Lot in Conner Plaza subdivision; Less than 0.5 acre lot
Interior
- Kitchen: Dishwasher; Disposal; Gas cooktop; Gas oven; Microwave; Refrigerator; Water line to refrigerator
- Bedrooms: 2 bedrooms (both on the main level)
- Bathrooms: 1 full bathroom (on the main level) with built-in cabinets
- Heating & cooling: Central heating; Central air conditioning
- Interior features: Open floorplan; 6 total rooms; One-level home; 1 living area; 1 dining area
- Laundry & utility: Washer; Dryer; Gas water heater
Neighborhood map
What this means for you Summary
Snapshot
- This is a 2-bed/1.0-bath single-family listed at $175k.
Deal economics
- At list price, monthly cash flow is $176 ($2k/yr) — positive.
- The deal already cash-flows at list — no discount required.
- To meet the 1% rule (rent ≥ 1% of price), the offer needs to be $161k (8.2% below list).
- Recommended offer: $161k (8.2% below list) — sets the bar for 1% rule.
- Cap rate 7.5% vs local median 3.1% in Lewisville — top-decile yield for the area; either an underpriced asset or a hidden risk that comps aren't pricing in. Stress-test before assuming the spread holds.
Location & tenants
- Location reads 69/100 on livability (#440 in TX) — a middle-class / working-renter tenant base. Strengths: housing A+, cost of living A, crime B+; Watch: commute D+, amenities F, health & safety F.
- Lewisville ISD (suburban): math 49% / reading 54% proficiency, ranked #109 of 826 in TX (top 13%) — acceptable for families but not a draw, mixed tenant base, ~2y average lease.
- Zoned schools: Bluebonnet El (math 72% / reading 71%, grade A-, #117 of 4,322 statewide, top 3%, 632 students, 10% FRL) — zoned schools average 10% FRL vs 26% district-wide (16 pts lower); this property's tenant base skews higher-income than the district average.
- Zoned-school proficiency averages 72% at this address vs 52% district-wide (+20 pts) — the actual schools serving this property are materially stronger than the Lewisville ISD average implies; a family-tenant draw the district grade alone would hide.
- Market conditions: Rents falling (-3.3%/yr); 37 active listings in the ZIP; 17 comparable units currently listed for rent nearby; rentals leasing fast (median 3d on market — plan ~1-2 weeks tenant-placement turnaround); solid renter incomes; 10,531 units permitted in Denton County in 2024 (2,713 in 5+ unit buildings).
Forward outlook
- Local home prices are declining (-3.0%/yr); year-one equity from $1k of loan paydown is wiped out by about $5k of value loss. Plan a longer hold.
- Denton County population projected at +66% by 2050 — long-run rental-demand tailwind backs the buy-and-hold thesis.
Negotiation context
- It's been on market 51 days — a 3% lower offer ($170k) is reasonable based on typical stale-listing flexibility.
- 5 sale attempts; this cycle's ask has dropped $10k (5%) from the opening price — seller is motivated, your offer sets the floor, not the list.
Risks & watch-outs
- Climate carrying-cost: moderate wind risk, 26% chance of damaging wind over 30y; extreme-heat days projected 7→21/yr by 2055 (HVAC capex compounding) — expect insurance premiums to compound above CPI over the hold.
Questions for the listing agent
- It's been on market 51 days. Have you received any prior offers? Is the seller open to a 8% concession, seller financing, or rate buy-down credit?
- Built in 1969 — when were the roof, HVAC, electrical panel, plumbing, and water heater last replaced?
- Is there a deadline driving the sale (1031 exchange, divorce, estate, relocation)? That informs how much negotiation room exists.
- Schools are D-rated, which usually means shorter tenancies and higher turnover. Who's the typical renter profile here, and what's been the actual vacancy rate?
- What's the average days-on-market for RENTAL listings here right now (not sales)? A rising rental-DOM trend means longer vacancies and softer asking-rent achievability than the comps imply.
- What's the recent tenant-quality profile in this submarket — average credit score on applications, eviction rate, late-payment / NSF rate, and stable-employment percentage? A property-management company in the area should have these aggregated.
- How much new for-sale + rental construction is in the pipeline within 1–3 miles? Heavy new supply typically softens prices + rents 12–24 months out; constrained supply supports both.
Investment metrics
- 1% rule
- 0.92% ✗
- Cap rate
- 7.50%
- Cash-on-cash
- 4.30%
- DSCR
- 1.19
- GRM
- 9.1
CMA / ARV
- ARV (median comp)
- $220,135
- List price
- $175,000
- Delta
- -20.50%
- Verdict
- UNDERPRICED
- Comps
- 4 within 1.0 mi
Show comp detail 1 sale within ~0.75 mi
| Address | Dist | Beds/Ba | Sqft | Sold | Price | $/sf | Match |
|---|---|---|---|---|---|---|---|
| 408 Milton St | 0.47mi | 2/1.0 | 674 (+6%) | 11mo | $280,000 | $415 | 58 |
Match score weights: distance 35% · size 25% · config 20% · recency 20%. Top-matched comps best support the ARV.
Projected returns pro-forma
-3.0% appreciation · 0.0% rent growth · sell at horizon
- IRR
- -12.8%
- Equity multiple
- 0.55×
- Total profit
- $-21,922
- Equity at exit
- $26,093
- IRR
- -8.6%
- Equity multiple
- 0.53×
- Total profit
- $-23,060
- Equity at exit
- $15,131
Cash invested: $49,000 (down + closing). Projections, not guarantees.
Landlord ↔ Tenant lean methodology
- Overall (STATE)
- 87 Strongly Landlord-Friendly
- State Texas
- 87 Strongly Landlord-Friendly · R+5
- County
- — inherits STATE
- City
- — inherits STATE
ZIP-level market 75057
- Home prices YoY
- -19.8%
- Rents YoY
- -3.3%
- Active inventory
- 37
- Price-to-rent
- 9.1×
Monthly cashflow live
- Estimated rent
- $1,606 high interval (Pro) →
- Mortgage (P&I)
- −$918
- Tax from tax record
- −$102 /mo · $1,226/yr
- Insurance
- −$73
- HOA
- −$0
- Vacancy / Maint / Mgmt
- −$337
- Net cashflow
- $176
Break-even live
UW: 25.0% down · 7.5% · 30yr · 1.5% tax · 5.0% vac · 8.0% maint · 8.0% mgmt
Financing live
Cash to close
- Down payment
- $43,750
- Closing costs
- $5,250
- Reserves months
- —
- Total cash needed
- —
Loan-product check · same deal, 3 products live
Conventional
25% down · 7.5% · 30yr
- Down + closing
- —
- Monthly P&I
- —
- Monthly cashflow
- —
- DSCR
- —
- Eligible?
- —
Personal DTI + credit; lowest rate.
DSCR
20% down · 8.5% · 30yr
- Down + closing
- —
- Monthly P&I
- —
- Monthly cashflow
- —
- DSCR
- —
- Eligible?
- —
No personal income docs; deal must DSCR.
Hard money
10% down · 12.0% · 12mo
- Down + closing
- —
- Monthly P&I
- —
- Monthly cashflow
- —
- DSCR
- —
- Eligible?
- —
Short-term bridge; refi at stabilization.
Rent comps 17 comps
| Address | Beds | Baths | Sqft | Rent | $/sqft | DOM | Units | Dist |
|---|---|---|---|---|---|---|---|---|
| 400 W Main St Lewisville, TX | 1.0–3.0 | 1.0–2.0 | 1000 | $2,052 | $2.05 | 3d | 39 | 0.34mi |
| 145 N Kealy Ave Unit 2 Lewisville, TX | 1.0 | 1.0 | 700 | $1,450 | $2.07 | 24d | 1 | 0.35mi |
| 100 E Main St Lewisville, TX | 1.0–2.0 | 1.0–2.0 | 1071 | $2,620 | $2.45 | 2d | 17 | 0.38mi |
| 145 S Kealy St Unit 2 Lewisville, TX | 1.0 | 1.0 | 700 | $1,450 | $2.07 | 24d | 1 | 0.42mi |
| 535 S Mill St Lewisville, TX | 2.0 | 1.0–2.0 | 827 | $2,401 | $2.90 | 2d | 25 | 0.52mi |
| 502 E College St Lewisville, TX | 1.0–2.0 | 1.0–2.0 | 964 | $2,115 | $2.19 | 2d | 38 | 0.55mi |
| 1585 N Mill St Lewisville, TX | 1.0 | 1.0 | 475 | $975 | $2.05 | 4d | 1 | 1.04mi |
| 1585 N Mill St #5 Lewisville, TX | 1.0 | 1.0 | 475 | $975 | $2.05 | 3d | 1 | 1.04mi |
| 1090 S Charles St Lewisville, TX | 2.0 | 1.0 | 710 | $1,350 | $1.90 | 17d | 3 | 1.06mi |
| 760 S Edmonds Ln Lewisville, TX | 2.0 | 1.0 | 753 | $1,459 | $1.94 | 5d | 1 | 1.06mi |
| 1002 S Edmonds Ln Lewisville, TX | 1.0–2.0 | 1.0 | 729 | $1,175 | $1.61 | 3d | 1 | 1.31mi |
| 1200 College Pkwy Unit 1121 Lewisville, TX | 1.0 | 1.0 | 608 | $1,057 | $1.74 | 3d | 1 | 1.42mi |
| 1070 Grandys Ln Unit 1121 Lewisville, TX | 1.0 | 1.0 | 524 | $1,170 | $2.23 | 44d | 1 | 1.44mi |
| 1070 Grandys Ln Unit 1091 Lewisville, TX | 1.0 | 1.0 | 524 | $1,175 | $2.24 | 14d | 1 | 1.44mi |
| 1070 Grandys Ln Unit 1118 Lewisville, TX | 1.0 | 1.0 | 734 | $939 | $1.28 | 13d | 1 | 1.44mi |
| 1070 Grandys Ln Unit 1091 Lewisville, TX | 1.0 | 1.0 | 734 | $947 | $1.29 | 3d | 1 | 1.44mi |
| 1200 College Pkwy Lewisville, TX | 1.0–3.0 | 1.0–2.0 | 1050 | $1,604 | $1.53 | 1d | 46 | 1.50mi |
Listing history 27 events
-
2026-06-18days on market $175,000 Active 51 DOM
-
2026-06-17days on market $175,000 Active 50 DOM
-
2026-06-16days on market $175,000 Active 49 DOM
-
2026-06-15days on market $175,000 Active 48 DOM
-
2026-06-13days on market $175,000 Active 46 DOM
-
2026-06-13days on market $175,000 Active 45 DOM
-
2026-06-09days on market $175,000 Active 42 DOM
-
2026-06-08days on market $175,000 Active 41 DOM
-
2026-06-07days on market $175,000 Active 40 DOM
-
2026-06-04days on market $175,000 Active 37 DOM
-
2026-06-03days on market $175,000 Active 36 DOM
-
2026-06-02days on market $175,000 Active 35 DOM
-
2026-06-01days on market $175,000 Active 34 DOM
-
2026-05-31days on market $175,000 Active 33 DOM
-
2026-05-05price $175,000 454-char remark
-
2026-04-24$185,000 Active 454-char remark
-
2025-11-07$180,000 Active
-
2025-08-18price $199,900
-
2025-08-08$210,000 Active
-
2025-04-15historical $1,600
-
2025-04-02price $1,600
-
2025-03-30price $1,700
-
2025-03-21$1,800
-
2025-03-08$219,900 Active
-
2024-11-06soldstatus
-
2016-08-19soldstatus
-
1986-10-06soldstatus
ⓘ Source: listings_history table (triggers on properties + properties_extension) + one-shot
backfill from property_details.listing_events for pre-trigger history.
Tax reassessment forecast TX · Resets to sale price
- Current annual tax
- $1,226 · $102/mo
- Projected year-2 tax
- $3,202 · $267/mo
- Expected delta
- +$1,977/yr (+$165/mo · 161.2%)
ⓘ Screening estimate from a state-policy table — verify with the county assessor before closing.
Climate risk First Street
- Flood 1/10 Low FEMA zone X (unshaded) · 0% chance over 30 yrs
- Wildfire 3/10 Moderate
- Heat 7/10 Severe 7 d/yr ≥109°F today · 21 d/yr by 30 yrs out
- Wind 5/10 Major 26% chance of damaging wind over 30 yrs
- Air quality 4/10 Moderate 4 unhealthy d/yr today · 5 by 30 yrs out
Nearby sold comps map
Loading sold comps map…
Walkable amenities ~0.75 mi
Loading nearby amenities…
Taxation est. · year 1
- Rental income
- $19,268
- − Mortgage interest
- −$9,803
- − Property taxes
- −$1,226
- − Insurance
- −$875
- − Repairs & maintenance
- −$1,541
- − Management
- −$1,541
- − Depreciation
- −$5,091
- Taxable loss
- −$810
- Est. tax savings @ 24.0%
- +$194
- After-tax cash flow
- $2,302/yr
For passive investors: Depreciation is non-cash, so a rental often shows a tax loss while cash-flowing — sheltering income. Rental losses are passive: they offset passive income freely, and up to $25,000/yr can offset ordinary (W-2) income if you actively participate and your MAGI is under $100k (phasing out to $0 by $150k); unused losses carry forward. On sale, claimed depreciation is recaptured at up to 25%, and gains may owe capital-gains tax (a 1031 exchange can defer both). Figures are a year-1 estimate at your 24.0% rate — not tax advice; consult a CPA.
Schools (NCES district)
- District
- Lewisville ISD
- NCES district ID
- 4827300
- Math proficiency
- 49% ▼ -10.00%
- Reading proficiency
- 54% ▼ -4.00%
- Median HH income
- $82,351
- Composite
- 47.1/100
- National rank
- #2333
- State rank
- #109 of 826 in TX
Livability — Lewisville
- Score
- 69/100
- State rank
- #440
- US rank
- #8991
Category grades
Schools grade is shown separately in the Schools card above.
Census & demographics
- Census place
- Lewisville, TX
- County
- Denton County · 901,654 people
- City population
- 84,871
- Metro
- Dallas-Fort Worth-Arlington, TX
- Population (ZIP)
- 17,958
- Household income
- $82,803
- Rent vs Own
- Severe rent burden
- 975.0
Population outlook (Denton County) Hauer SSP2
- Today (2025)
- 1,053,010 people
- By 2030
- 1,192,269 · +13.2%
- By 2040
- 1,472,920 · +39.9%
- By 2050
- 1,746,506 · +65.9%
- By 2075
- 2,358,497 · +124.0%
- By 2100
- 2,779,183 · +163.9%
Race, ethnicity, and origin ACS 2023
- Neighborhood character
- Diverse neighborhood (Simpson 0.66)
- Race & ethnicity
- Hispanic / Latino 42% White 39% Two or more races 23% Black 11% Asian 3% Native American 2%
- Hispanic origin (detail)
- Mexican 34%
- Common ancestry
- Swedish 1% Slovak 1% Serbian 1%
- Foreign-born
- 17% · Canada, South Korea, Vietnam
- Languages at home
- 62% English-only · Spanish 32% Korean 1% Other Asian/Pacific 1%
Political lean MEDSL · Denton
- 2024 margin
- R (+13.2) · D 42.7% · R 55.8% · Other 1.5%
- 2008→2024 swing
- +11.0pp toward D · 2008: -24.2pp · 2024: -13.2pp
- All cycles
- 2024: R+13.2 2020: R+8.1 2016: R+20.2 2012: R+31.7 2008: R+24.2
Not yet ingested
- Civics
- —
Market trends
- HPI YoY
- ▼ -76.22%
- Current HPI
- 308.1135
- Rent YoY
- ▼ -3.28%
- Metro
- Dallas-Fort Worth-Arlington, TX
- State GDP YoY
- ▲ 3.95%
- F500 in state
- 110
Industry mix (Fortune 500 HQ in TX)
| Industry | F500 HQs | Revenue |
|---|---|---|
| Energy | 16 | $1,198B |
|
||
| Technology | 5 | $198B |
|
||
| Engineering / Construction | 4 | $72B |
|
||
| Energy Services | 3 | $60B |
|
||
| Utilities | 3 | $41B |
|
||
| Healthcare | 2 | $330B |
|
||
Price history
-20.4% since first listed13 events — show timeline
- 2026-05-05 Price Changed $175,000 NTREIS
- 2026-04-24 Listed $185,000 NTREIS
- 2025-11-07 Listed $180,000 NTREIS
- 2025-08-18 Price Changed $199,900 NTREIS
- 2025-08-08 Listed $210,000 NTREIS
- 2025-04-15 Rental Removed $1,600 NTREIS
- 2025-04-02 Price Changed $1,600 NTREIS
- 2025-03-30 Price Changed $1,700 NTREIS
- 2025-03-21 Listed for Rent $1,800 NTREIS
- 2025-03-08 Listed $219,900 NTREIS
- 2024-11-06 Sold (Public Records) — Public Records
- 2016-08-19 Sold (Public Records) — Public Records
- 1986-10-06 Sold (Public Records) — Public Records
Property tax history
+3.4%/yrLatest (2025): $1,226 · -1.9% YoY. Source: county tax records.
Cash-flow waterfall
monthlySold comps — $/sqft
last 12 mo · ≤1 miLoading sold comps…