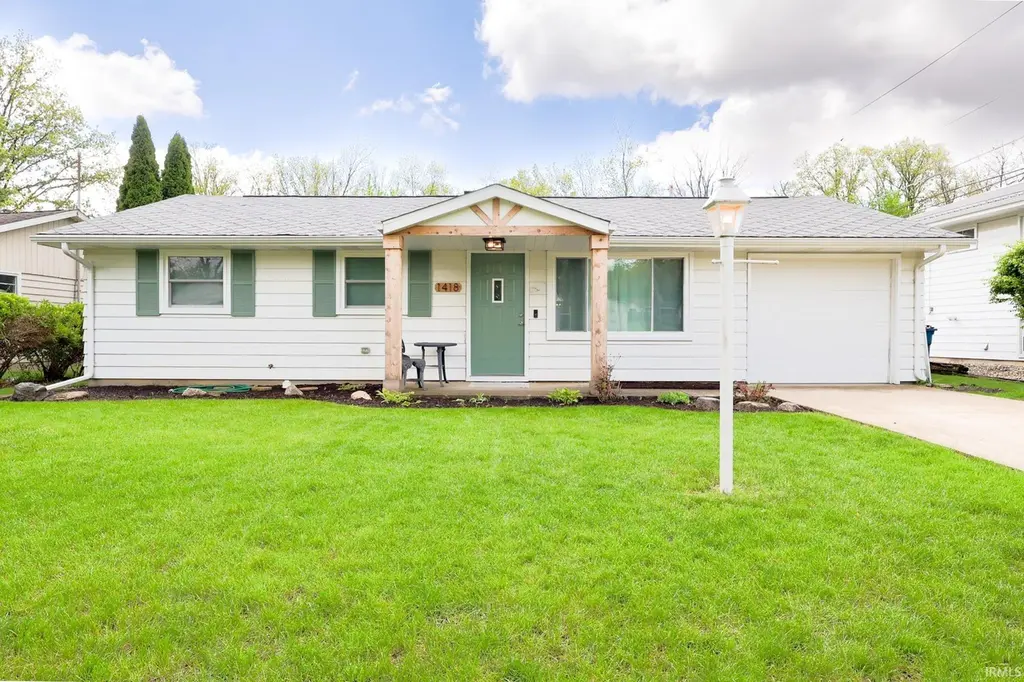
1418 Deveron Dr · New Haven, IN
Flood risk 1/10 · Minimal
- FEMA flood zone
- X (unshaded)
- Chance of flooding over 30 yrs
- 0.0%
- Est. flood insurance / yr
- $507 – $1,088
Fire risk 1/10 · Minimal
- Est. fire insurance / yr
- $717 – $1,331
Heat risk 3/10 · Minor
- Hot days now (above 100°F)
- 7 days/yr
- Hot days in 30 yrs
- 17 days/yr
Wind risk 2/10 · Minimal
- Chance of severe wind over 30 yrs
- —
Air-quality risk 3/10 · Minor
- Unhealthy air days now
- 3 days/yr
- Unhealthy air days in 30 yrs
- 3 days/yr
Risk factors via First Street. Map © Google.
Why this score? — see what drove the D+ grade
The composite is a weighted blend of 9 inputs, each scored 0–100. Each bar is that input's sub-score; the figure is the points it added to the 100-point composite (weight × sub-score).
- Cash flow +19.1/30.0
- ARV discount +8.2/15.0
- DSCR +6.0/10.0
- 1% rule +4.3/10.0
- Schools +3.6/10.0
- Livability +3.5/5.0
- Rent growth +2.5/5.0
- Condition / age +2.5/5.0
- Appreciation +0.0/10.0
$215,900
🖨 Deal sheet 📄 Offer letter ✓ Due diligence
Listing remarks MLS
This 3 bed, 1.5 bath home is the best of both worlds; could be move in ready or perfect for an investor looking for a quick fixer-upper. Conveniently located just down the road from New Haven High School. Enjoy the privacy of a wooded creek flowing directly behind the house. Priced to move, don't miss out on this opportunity. See agent remarks!
Key facts
- Newer furnace
- Updated bathrooms
- Updated countertops
Tags
Property features AI
Exterior
- Parking: Attached garage (1 car)
- Utilities: Public water; Public sewer
- Home design: Single-family residence (site-built); One-story home; Faces (not specified)
- Construction: Aluminum siding; Slab foundation; Built (year not specified)
- Exterior features: Covered porch; Patio; Chain link fencing; Shed(s); Level lot
Interior
- Kitchen: Dishwasher; Microwave; Refrigerator; Gas range
- Bathrooms: 1 full bathroom; 1 half bathroom; 2 main-level bathrooms
- Heating & cooling: Natural gas heating with forced air; Central air conditioning; Gas water heater
- Interior features: Wood-burning fireplace in family room; 8 total rooms
- Laundry & utility: Washer; Dryer; Main-level laundry
Neighborhood map
What this means for you Summary
Snapshot
- This is a 3-bed/1.5-bath single-family listed at $216k.
Deal economics
- At list price, monthly cash flow is $230 ($3k/yr) — positive.
- The deal already cash-flows at list — no discount required.
- To meet the 1% rule (rent ≥ 1% of price), the offer needs to be $201k (6.9% below list).
- Recommended offer: $201k (6.9% below list) — sets the bar for 1% rule.
- Cap rate 7.6% vs local median 4.9% in New Haven — top-decile yield for the area; either an underpriced asset or a hidden risk that comps aren't pricing in. Stress-test before assuming the spread holds.
Location & tenants
- Location reads 70/100 on livability (#149 in IN) — a middle-class / working-renter tenant base. Strengths: cost of living A+, housing A+, crime B+; Watch: employment D, amenities F, commute F.
- East Allen County Schools (suburban): math 36% / reading 47% proficiency, ranked #122 of 301 in IN (top 40%) — families likely to look elsewhere, expect single-tenant / working-renter base with shorter leases.
- Zoned schools: New Haven Primary School (470 students, 61% FRL); New Haven Jr/Sr High School (math 21% / reading 50%, grade F, #263 of 369 statewide, top 72%, 1,494 students, 67% FRL) — zoned schools average 64% FRL vs 43% district-wide (21 pts higher); higher-poverty schools than district average — tighter screening recommended.
- Market conditions: 176 active listings in the ZIP; 4 comparable units currently listed for rent nearby; rentals lingering (median 44d on market — plan ~5-8 weeks vacancy on turnover, expect pricing pressure); 50% of comp listings sitting > 30 days — soft ceiling on asking rent; 1,861 units permitted in Allen County in 2024 (576 in 5+ unit buildings).
Forward outlook
- Local home prices are declining (-3.0%/yr); year-one equity from $1k of loan paydown is wiped out by about $6k of value loss. Plan a longer hold.
- Allen County population projected at +10% by 2050 — modest demand growth; plan on rents tracking national, not racing it.
Negotiation context
- Only 3 days on market — expect competitive offers; lowballing is unlikely to land.
- 2 sale attempts since 8y ago with the ask held roughly flat each time — persistent listings suggest the price (not the market) is what's stuck; bring a comps-based counter.
Questions for the listing agent
- Built in 1964 — when were the roof, HVAC, electrical panel, plumbing, and water heater last replaced?
- Is there a deadline driving the sale (1031 exchange, divorce, estate, relocation)? That informs how much negotiation room exists.
- Schools are D-rated, which usually means shorter tenancies and higher turnover. Who's the typical renter profile here, and what's been the actual vacancy rate?
- The area grade is low — what's the realistic commute time and amenity access for the typical tenant pool here? Any planned neighborhood developments (good or bad) we should know about?
- What's the average days-on-market for RENTAL listings here right now (not sales)? A rising rental-DOM trend means longer vacancies and softer asking-rent achievability than the comps imply.
- What's the recent tenant-quality profile in this submarket — average credit score on applications, eviction rate, late-payment / NSF rate, and stable-employment percentage? A property-management company in the area should have these aggregated.
- How much new for-sale + rental construction is in the pipeline within 1–3 miles? Heavy new supply typically softens prices + rents 12–24 months out; constrained supply supports both.
Investment metrics
- 1% rule
- 0.93% ✗
- Cap rate
- 7.57%
- Cash-on-cash
- 4.56%
- DSCR
- 1.20
- GRM
- 9.0
CMA / ARV
- ARV (median comp)
- $219,077
- List price
- $215,900
- Delta
- -1.45%
- Verdict
- FAIR
- Comps
- 20 within 1.0 mi
Show comp detail 12 sales within ~0.75 mi
| Address | Dist | Beds/Ba | Sqft | Sold | Price | $/sf | Match |
|---|---|---|---|---|---|---|---|
| 1418 Deveron Dr | 0.00mi | 3/1.5 | 1,382 (0%) | 1mo | $215,900 | $156 | 99 |
| 1547 Tartan Ln | 0.24mi | 3/1.5 | 1,400 (+1%) | 2mo | $215,000 | $154 | 85 |
| 3706 Norland Ln | 0.32mi | 3/1.5 | 1,340 (-3%) | 4mo | $199,900 | $149 | 77 |
| 1717 E Macgregor Dr | 0.28mi | 3/1.5 | 1,344 (-3%) | 8mo | $206,900 | $154 | 76 |
| 1524 Macpherson Dr | 0.29mi | 3/2.0 | 1,333 (-4%) | 7mo | $212,500 | $159 | 73 |
| 3942 Olivene Cv | 0.44mi | 3/2.0 | 1,410 (+2%) | 3mo | $232,000 | $165 | 72 |
| 4027 Centerstone Pkwy | 0.41mi | 3/2.0 | 1,415 (+2%) | 4mo | $289,900 | $205 | 72 |
| 1542 Tartan Ln | 0.25mi | 3/1.5 | 1,236 (-11%) | 4mo | $190,900 | $154 | 68 |
| 10232 Archstone Cv | 0.21mi | 3/2.0 | 1,583 (+14%) | 2mo | $239,900 | $152 | 62 |
| 1503 Glencoe Blvd | 0.56mi | 3/1.5 | 1,470 (+6%) | 2mo | $212,800 | $145 | 61 |
| 1506 Tartan Ct | 0.20mi | 4/2.0 (+1) | 1,557 (+13%) | 6mo | $214,900 | $138 | 58 |
| 10364 Silver Rock Chase | 0.51mi | 3/2.0 | 1,509 (+9%) | 3mo | $297,900 | $197 | 56 |
Match score weights: distance 35% · size 25% · config 20% · recency 20%. Top-matched comps best support the ARV.
Projected returns pro-forma
-3.0% appreciation · 3.0% rent growth · sell at horizon
- IRR
- -9.2%
- Equity multiple
- 0.66×
- Total profit
- $-20,418
- Equity at exit
- $32,191
- IRR
- 0.2%
- Equity multiple
- 1.01×
- Total profit
- $832
- Equity at exit
- $18,667
Cash invested: $60,452 (down + closing). Projections, not guarantees.
Landlord ↔ Tenant lean methodology
- Overall (STATE)
- 90 Strongly Landlord-Friendly
- State Indiana
- 90 Strongly Landlord-Friendly · R+11
- County
- — inherits STATE
- City
- — inherits STATE
ZIP-level market 46774
- Active inventory
- 176
- Price-to-rent
- 9.0×
Monthly cashflow live
- Estimated rent
- $2,009 medium interval (Pro) →
- Mortgage (P&I)
- −$1,132
- Tax from tax record
- −$135 /mo · $1,625/yr
- Insurance
- −$90
- HOA
- −$0
- Vacancy / Maint / Mgmt
- −$422
- Net cashflow
- $230
Break-even live
UW: 25.0% down · 7.5% · 30yr · 1.5% tax · 5.0% vac · 8.0% maint · 8.0% mgmt
Financing live
Cash to close
- Down payment
- $53,975
- Closing costs
- $6,477
- Reserves months
- —
- Total cash needed
- —
Loan-product check · same deal, 3 products live
Conventional
25% down · 7.5% · 30yr
- Down + closing
- —
- Monthly P&I
- —
- Monthly cashflow
- —
- DSCR
- —
- Eligible?
- —
Personal DTI + credit; lowest rate.
DSCR
20% down · 8.5% · 30yr
- Down + closing
- —
- Monthly P&I
- —
- Monthly cashflow
- —
- DSCR
- —
- Eligible?
- —
No personal income docs; deal must DSCR.
Hard money
10% down · 12.0% · 12mo
- Down + closing
- —
- Monthly P&I
- —
- Monthly cashflow
- —
- DSCR
- —
- Eligible?
- —
Short-term bridge; refi at stabilization.
Rent comps 4 comps
| Address | Beds | Baths | Sqft | Rent | $/sqft | DOM | Units | Dist |
|---|---|---|---|---|---|---|---|---|
| 3599 Canal Square Dr New Haven, IN | 3.0 | 2.5 | 1832 | $2,295 | $1.25 | 21d | 1 | 0.17mi |
| 3591 Canal Square Dr New Haven, IN | 3.0 | 1.5 | 1467 | $1,695 | $1.16 | 44d | 1 | 0.28mi |
| 10390 Silver Rock Chase New Haven, IN | 4.0 | 2.5 | 1767 | $2,250 | $1.27 | 44d | 1 | 0.46mi |
| 1135 Summit St New Haven, IN | 2.0 | 1.0 | 1061 | $1,025 | $0.97 | 21d | 1 | 1.13mi |
Listing history 4 events
-
2026-05-04status Pending 1137-char remark
-
2026-05-01$215,900 Active 1137-char remark
-
2018-08-10soldstatus $85,000 346-char remark
Show marketing remark (346 chars)
This 3 bed, 1.5 bath home is the best of both worlds; could be move in ready or perfect for an investor looking for a quick fixer-upper. Conveniently located just down the road from New Haven High School. Enjoy the privacy of a wooded creek flowing directly behind the house. Priced to move, don't miss out on this opportunity. See agent remarks!
-
2018-07-14$85,000 346-char remark
Show marketing remark (346 chars)
This 3 bed, 1.5 bath home is the best of both worlds; could be move in ready or perfect for an investor looking for a quick fixer-upper. Conveniently located just down the road from New Haven High School. Enjoy the privacy of a wooded creek flowing directly behind the house. Priced to move, don't miss out on this opportunity. See agent remarks!
ⓘ Source: listings_history table (triggers on properties + properties_extension) + one-shot
backfill from property_details.listing_events for pre-trigger history.
Tax reassessment forecast IN · Partial reset (capped growth)
- Current annual tax
- $1,625 · $135/mo
- Projected year-2 tax
- $1,730 · $144/mo
- Expected delta
- +$105/yr (+$9/mo · 6.5%)
ⓘ Screening estimate from a state-policy table — verify with the county assessor before closing.
Climate risk First Street
- Flood 1/10 Low FEMA zone X (unshaded) · 0% chance over 30 yrs
- Wildfire 1/10 Low
- Heat 3/10 Moderate 7 d/yr ≥100°F today · 17 d/yr by 30 yrs out
- Wind 2/10 Low
- Air quality 3/10 Moderate 3 unhealthy d/yr today · 3 by 30 yrs out
Nearby sold comps map
Loading sold comps map…
Walkable amenities ~0.75 mi
Loading nearby amenities…
Taxation est. · year 1
- Rental income
- $24,108
- − Mortgage interest
- −$12,094
- − Property taxes
- −$1,625
- − Insurance
- −$1,080
- − Repairs & maintenance
- −$1,929
- − Management
- −$1,929
- − Depreciation
- −$6,281
- Taxable loss
- −$828
- Est. tax savings @ 24.0%
- +$199
- After-tax cash flow
- $2,953/yr
For passive investors: Depreciation is non-cash, so a rental often shows a tax loss while cash-flowing — sheltering income. Rental losses are passive: they offset passive income freely, and up to $25,000/yr can offset ordinary (W-2) income if you actively participate and your MAGI is under $100k (phasing out to $0 by $150k); unused losses carry forward. On sale, claimed depreciation is recaptured at up to 25%, and gains may owe capital-gains tax (a 1031 exchange can defer both). Figures are a year-1 estimate at your 24.0% rate — not tax advice; consult a CPA.
Schools (NCES district)
- District
- East Allen County Schools
- NCES district ID
- 1802850
- Math proficiency
- 36% ▼ -8.00%
- Reading proficiency
- 47% ▼ -4.00%
- Median HH income
- $50,524
- Composite
- 35.75/100
- National rank
- #4849
- State rank
- #122 of 301 in IN
Livability — New Haven
- Score
- 70/100
- State rank
- #149
- US rank
- #7499
Category grades
Schools grade is shown separately in the Schools card above.
Census & demographics
- Census place
- New Haven, IN
- Population (ZIP)
- 17,066
Population outlook (Allen County) Hauer SSP2
- Today (2025)
- 394,020 people
- By 2030
- 405,128 · +2.8%
- By 2040
- 423,476 · +7.5%
- By 2050
- 435,137 · +10.4%
- By 2075
- 450,293 · +14.3%
- By 2100
- 424,101 · +7.6%
Race, ethnicity, and origin ACS 2023
- Neighborhood character
- Predominantly White (89%)
- Race & ethnicity
- White 89% Two or more races 4% Hispanic / Latino 4% Black 3% Asian 1%
- Common ancestry
- Lithuanian 5% Italian 2% Slovak 1%
- Foreign-born
- 3% · Canada, Philippines
- Languages at home
- 89% English-only · German/W. Germanic 6% Spanish 3% Chinese 1%
Political lean MEDSL · Allen
- 2024 margin
- R (+12.5) · D 42.9% · R 55.4% · Other 1.7%
- 2008→2024 swing
- -8.1pp toward R · 2008: -4.3pp · 2024: -12.5pp
- All cycles
- 2024: R+12.5 2020: R+11.2 2016: R+19.6 2012: R+16.8 2008: R+4.3
Not yet ingested
- Civics
- —
Market trends
- HPI YoY
- ▼ -185.27%
- Current HPI
- 241.5333
- Rent YoY
- —
- Metro
- —
- State GDP YoY
- ▲ 2.90%
- F500 in state
- 18
Industry mix (Fortune 500 HQ in IN)
| Industry | F500 HQs | Revenue |
|---|---|---|
| Industrial Machinery | 2 | $37B |
|
||
| Healthcare | 1 | $177B |
|
||
| Pharmaceuticals | 1 | $45B |
|
||
| Metals / Steel | 1 | $18B |
|
||
| Agriculture | 1 | $17B |
|
||
| Packaging | 1 | $12B |
|
||
Price history
+154.0% since first listed5 events — show timeline
- 2026-05-29 Sold (MLS) $215,900 IRMLS
- 2026-05-04 Pending — IRMLS
- 2026-05-01 Listed $215,900 IRMLS
- 2018-08-10 Sold (MLS) $85,000 IRMLS
- 2018-07-14 Listed $85,000 IRMLS
Property tax history
+17.4%/yrLatest (2024): $1,625 · +29.6% YoY. Source: county tax records.
Cash-flow waterfall
monthlySold comps — $/sqft
last 12 mo · ≤1 miLoading sold comps…