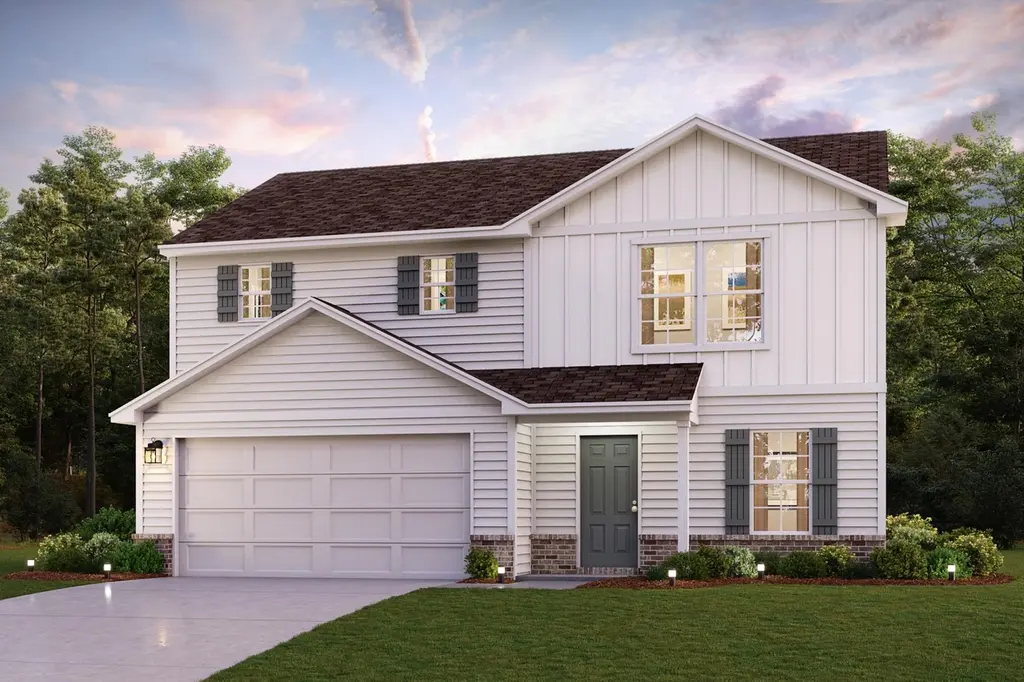
2086 Derby Way · Memphis, IN
Flood risk 1/10 · Minimal
- FEMA flood zone
- X (unshaded)
- Chance of flooding over 30 yrs
- 0.0%
- Est. flood insurance / yr
- $507 – $1,088
Fire risk 1/10 · Minimal
- Est. fire insurance / yr
- $717 – $1,331
Heat risk 4/10 · Minor
- Hot days now (above 105°F)
- 7 days/yr
- Hot days in 30 yrs
- 19 days/yr
Wind risk 2/10 · Minimal
- Chance of severe wind over 30 yrs
- 2.0%
Air-quality risk 2/10 · Minimal
- Unhealthy air days now
- 1 days/yr
- Unhealthy air days in 30 yrs
- 1 days/yr
Risk factors via First Street. Map © Google.
Why this score? — see what drove the D grade
The composite is a weighted blend of 9 inputs, each scored 0–100. Each bar is that input's sub-score; the figure is the points it added to the 100-point composite (weight × sub-score).
- Cash flow +12.2/30.0
- ARV discount +9.4/15.0
- Schools +5.0/10.0
- 1% rule +3.6/10.0
- DSCR +3.6/10.0
- Livability +3.5/5.0
- Rent growth +2.5/5.0
- Condition / age +1.0/5.0
- Appreciation +0.0/10.0
$269,990
🖨 Deal sheet (PDF) 📄 Offer letter ✓ Due diligence
Listing remarks MLS
4 Bed | 3 Bath | 2 Bay | 1774 sqft
Key facts
- Spacious bedroom
- Ensuite bath
- Open layout
Tags
Property features AI
Finance
- Other: Property type: Residential single-family; Subdivision: Other
- HOA & community: Homeowners association with an annual fee of $350 (about $29.17/month)
Exterior
- Parking: Attached garage with 2 spaces; Garage door opener
- Security: Smoke detector(s); Carbon monoxide detector(s)
- Utilities: Public water; Public sewer
- Home design: Single-family residence (site-built); 2 stories; Built by Century Complete
- Construction: Vinyl siding; Slab foundation
- Exterior features: Shingle roof; Lot approximately 0.24 acre (149 x 69); Other lot features
Interior
- Kitchen: Dishwasher; Microwave
- Bedrooms: Total of 4 rooms (bedroom count not specified)
- Flooring: Vinyl flooring
- Bathrooms: 3 full bathrooms; 1 main-level bathroom
- Heating & cooling: Forced air heating; Central air conditioning
- Interior features: Smoke and carbon monoxide detectors; Energy-efficient windows
- Laundry & utility: Laundry located on the upper level
Neighborhood map
What this means for you Summary
Snapshot
- This is a 4-bed/3.0-bath single-family listed at $270k. Condition is rated poor.
Deal economics
- At list price, monthly cash flow is $-53 ($-636/yr) — negative.
- To cash-flow at today's rent, offer at most $262k (2.8% below list).
- To meet the 1% rule (rent ≥ 1% of price), the offer needs to be $233k (13.6% below list).
- Recommended offer: $233k (13.6% below list) — sets the bar for 1% rule.
- Cap rate 6.1% vs local median 5.0% in Memphis — meaningfully above typical; check what's discounted (condition, days-on-market, listing class) to confirm the premium yield is real.
Location & tenants
- Location reads 70/100 on livability (#164 in IN) — a middle-class / working-renter tenant base. Strengths: employment A+, cost of living A+, housing A+; Watch: amenities F, commute F, health & safety F.
- Zoned schools: Henryville Elementary School (math 30% / reading 33%, grade F, #678 of 994 statewide, top 68%, 647 students, 43% FRL); Henryville Jr & Sr High School (math 29% / reading 45%, grade F, #247 of 369 statewide, top 70%, 461 students, 32% FRL).
- Market conditions: 94 active listings in the ZIP; 911 units permitted in Clark County in 2024 (133 in 5+ unit buildings).
Forward outlook
- Local home prices are declining (-3.0%/yr); year-one equity from $2k of loan paydown is wiped out by about $8k of value loss. Plan a longer hold.
- Clark County population projected at +17% by 2050 — long-run rental-demand tailwind backs the buy-and-hold thesis.
Negotiation context
- It's been on market 73 days — a 6% lower offer ($254k) is reasonable based on typical stale-listing flexibility.
- 3 sale attempts with the ask held roughly flat each time — persistent listings suggest the price (not the market) is what's stuck; bring a comps-based counter.
Questions for the listing agent
- What do current leases actually rent for vs. the listed asking? Can we see a recent rent roll and the last 12 months of T-12 income?
- It's been on market 73 days. Have you received any prior offers? Is the seller open to a 14% concession, seller financing, or rate buy-down credit?
- Have any recent inspections been done? Can we get a copy of the seller's disclosures and any deferred-maintenance estimates?
- What does the HOA fee cover, when was the last increase, and are there any pending special assessments or reserve-fund shortfalls?
- Why hasn't it sold? Are there any deal-killer items the seller is aware of (foundation, flood, title, zoning, code violations)?
- Is there a deadline driving the sale (1031 exchange, divorce, estate, relocation)? That informs how much negotiation room exists.
- Schools are F-rated, which usually means shorter tenancies and higher turnover. Who's the typical renter profile here, and what's been the actual vacancy rate?
- The area grade is low — what's the realistic commute time and amenity access for the typical tenant pool here? Any planned neighborhood developments (good or bad) we should know about?
- What's the average days-on-market for RENTAL listings here right now (not sales)? A rising rental-DOM trend means longer vacancies and softer asking-rent achievability than the comps imply.
- What's the recent tenant-quality profile in this submarket — average credit score on applications, eviction rate, late-payment / NSF rate, and stable-employment percentage? A property-management company in the area should have these aggregated.
- How much new for-sale + rental construction is in the pipeline within 1–3 miles? Heavy new supply typically softens prices + rents 12–24 months out; constrained supply supports both.
Investment metrics
- 1% rule
- 0.86% ✗
- Cap rate
- 6.06%
- Cash-on-cash
- -0.84%
- DSCR
- 0.96
- GRM
- 9.7
CMA / ARV
- ARV (on-the-fly)
- $282,066
- Comps found
- 12
Show comp detail 12 sales within ~0.75 mi
| Address | Dist | Beds/Ba | Sqft | Sold | Price | $/sf | Match |
|---|---|---|---|---|---|---|---|
| 1010 Legend Ct | 0.14mi | 4/3.0 | 1,774 (0%) | 7mo | $249,991 | $141 | 88 |
| 2019 Derby Way | 0.17mi | 4/2.0 | 1,771 (-0%) | 5mo | $278,975 | $158 | 84 |
| 2014 Derby Way | 0.12mi | 4/2.5 | 1,953 (+10%) | 3mo | $279,900 | $143 | 73 |
| 2061 Derby Way | 0.17mi | 4/2.5 | 2,014 (+14%) | 1mo | $277,990 | $138 | 66 |
| 1008 Legend Ct | 0.15mi | 4/2.5 | 2,014 (+14%) | 3mo | $259,990 | $129 | 65 |
| 1201 Sir Barton Ct | 0.14mi | 3/2.0 (-1) | 1,621 (-9%) | 6mo | $266,590 | $164 | 65 |
| 2068 Derby Way | 0.12mi | 4/2.5 | 2,014 (+14%) | 6mo | $264,991 | $132 | 65 |
| 13969 Deerfield Xing | 0.55mi | 3/2.0 (-1) | 1,648 (-7%) | 2mo | $309,900 | $188 | 51 |
| 13803 Station Ct | 0.44mi | 3/2.0 (-1) | 1,511 (-15%) | 2mo | $240,000 | $159 | 44 |
| 13838 Deerfield Xing | 0.56mi | 3/2.0 (-1) | 1,601 (-10%) | 6mo | $287,000 | $179 | 44 |
| 13951 Deer Run Trce Lot 406 | 0.62mi | 3/2.0 (-1) | 1,553 (-12%) | 3mo | $338,900 | $218 | 39 |
| 13952 Deer Run Trce Lot 424 | 0.62mi | 3/2.0 (-1) | 1,553 (-12%) | 7mo | $314,900 | $203 | 36 |
Match score weights: distance 35% · size 25% · config 20% · recency 20%. Top-matched comps best support the ARV.
Projected returns pro-forma
-3.0% appreciation · 3.0% rent growth · sell at horizon
- IRR
- -17.7%
- Equity multiple
- 0.38×
- Total profit
- $-47,071
- Equity at exit
- $40,256
- IRR
- -9.7%
- Equity multiple
- 0.40×
- Total profit
- $-45,118
- Equity at exit
- $23,344
Cash invested: $75,597 (down + closing). Projections, not guarantees.
Landlord ↔ Tenant lean methodology
- Overall (STATE)
- 90 Strongly Landlord-Friendly
- State Indiana
- 90 Strongly Landlord-Friendly · R+11
- County
- — inherits STATE
- City
- — inherits STATE
ZIP-level market 47143
- Home prices YoY
- -30.4%
- Active inventory
- 94
- Price-to-rent
- 9.7×
Monthly cashflow live
- Estimated rent
- $2,331 medium interval (Pro) →
- Mortgage (P&I)
- −$1,416
- Tax est. 1.5%
- −$337 /mo · $4,050/yr
- Insurance
- −$112
- HOA
- −$29
- Vacancy / Maint / Mgmt
- −$490
- Net cashflow
- $-53
Break-even live
Sensitivity live
| Price | -10% $134 | -5% $40 | +0% $-53 | +5% $-146 | +10% $-240 |
|---|---|---|---|---|---|
| Rent | -10% $-237 | -5% $-145 | +0% $-53 | +5% $39 | +10% $131 |
| Rate | -1.0pp $83 | -0.5pp $16 | base $-53 | +0.5pp $-123 | +1.0pp $-194 |
UW: 25.0% down · 7.5% · 30yr · 1.5% tax · 5.0% vac · 8.0% maint · 8.0% mgmt
Financing live
Cash to close
- Down payment
- $67,498
- Closing costs
- $8,100
- Reserves months
- —
- Total cash needed
- —
Loan-product check · same deal, 3 products live
Conventional
25% down · 7.5% · 30yr
- Down + closing
- —
- Monthly P&I
- —
- Monthly cashflow
- —
- DSCR
- —
- Eligible?
- —
Personal DTI + credit; lowest rate.
DSCR
20% down · 8.5% · 30yr
- Down + closing
- —
- Monthly P&I
- —
- Monthly cashflow
- —
- DSCR
- —
- Eligible?
- —
No personal income docs; deal must DSCR.
Hard money
10% down · 12.0% · 12mo
- Down + closing
- —
- Monthly P&I
- —
- Monthly cashflow
- —
- DSCR
- —
- Eligible?
- —
Short-term bridge; refi at stabilization.
HOA detail
- Monthly dues
- $29 · $348/yr
Listing history 18 events
-
2026-06-21days on market $269,990 Active 73 DOM
-
2026-06-18days on market $269,990 Active 70 DOM
-
2026-06-17days on market $269,990 Active 69 DOM
-
2026-06-16days on market $269,990 Active 68 DOM
-
2026-06-15days on market $269,990 Active 67 DOM
-
2026-06-13days on market $269,990 Active 65 DOM
-
2026-06-10pricedays on market $269,990 Active 62 DOM
-
2026-06-09days on market $271,990 Active 61 DOM
-
2026-06-08days on market $271,990 Active 60 DOM
-
2026-06-07days on market $271,990 Active 59 DOM
-
2026-06-03days on market $271,990 Active 55 DOM
-
2026-06-02days on market $271,990 Active 54 DOM
-
2026-06-01days on market $271,990 Active 53 DOM
-
2026-05-31days on market $271,990 Active 52 DOM
-
2026-05-19status Active 34-char remark
Show marketing remark (34 chars)
4 Bed | 3 Bath | 2 Bay | 1774 sqft
-
2026-05-14historical 34-char remark
Show marketing remark (34 chars)
4 Bed | 3 Bath | 2 Bay | 1774 sqft
-
2026-05-06$269,990 Active 34-char remark
Show marketing remark (34 chars)
4 Bed | 3 Bath | 2 Bay | 1774 sqft
-
2026-04-09$269,990 Active
ⓘ Source: listings_history table (triggers on properties + properties_extension) + one-shot
backfill from property_details.listing_events for pre-trigger history.
Climate risk First Street
- Flood 1/10 Low FEMA zone X (unshaded) · 0% chance over 30 yrs
- Wildfire 1/10 Low
- Heat 4/10 Moderate 7 d/yr ≥105°F today · 19 d/yr by 30 yrs out
- Wind 2/10 Low 2% chance of damaging wind over 30 yrs
- Air quality 2/10 Low 1 unhealthy d/yr today · 1 by 30 yrs out
Nearby sold comps map
Loading sold comps map…
Walkable amenities ~0.75 mi
Loading nearby amenities…
Taxation est. · year 1
- Rental income
- $27,978
- − Mortgage interest
- −$15,124
- − Property taxes
- −$4,050
- − Insurance
- −$1,350
- − Repairs & maintenance
- −$2,238
- − Management
- −$2,238
- − HOA
- −$348
- − Depreciation
- −$7,854
- Taxable loss
- −$5,224
- Est. tax savings @ 24.0%
- +$1,254
- After-tax cash flow
- $618/yr
For passive investors: Depreciation is non-cash, so a rental often shows a tax loss while cash-flowing — sheltering income. Rental losses are passive: they offset passive income freely, and up to $25,000/yr can offset ordinary (W-2) income if you actively participate and your MAGI is under $100k (phasing out to $0 by $150k); unused losses carry forward. On sale, claimed depreciation is recaptured at up to 25%, and gains may owe capital-gains tax (a 1031 exchange can defer both). Figures are a year-1 estimate at your 24.0% rate — not tax advice; consult a CPA.
Condition & rehab AI · 1 photo
This home requires extensive repairs and updates to its roof, exterior, flooring, HVAC, and landscaping, significantly impacting its resale and rental value.
Repairs flagged
- Major roof repair — Significant damage and potential water infiltration.
- Major exterior siding and paint repair — Severe wear and tear, with peeling paint and possible rot.
- Major flooring replacement — Visible wear and potential damage.
- Major HVAC/mechanical repair — Visible rust and potential malfunction.
- Major landscaping and curb appeal — Minimal landscaping and overgrown vegetation.
- Major interior wall and paint repair — Significant wear and tear, with peeling paint and potential damage.
Value-add opportunities
- Resale roof repair and replacement — A new roof will significantly improve the home's appearance and reduce potential water damage.
- Resale exterior siding and paint repair — A fresh coat of paint and new siding will greatly enhance the home's curb appeal.
- Resale flooring replacement — New flooring will improve the home's overall appearance and functionality.
- Both HVAC/mechanical repair and replacement — A new HVAC system will improve comfort and energy efficiency, benefiting both resale and rental value.
- Resale landscaping and curb appeal — A well-maintained landscape will significantly enhance the home's curb appeal and resale value.
- Resale interior wall and paint repair — Fresh paint and repairs will improve the home's interior appearance and resale value.
Renovation cost estimate screening
| Repair item | Severity | Est. cost |
|---|---|---|
| roof repair · Significant damage and potential water infiltration. | Major | $15,000–50,000 |
| exterior siding and paint repair · Severe wear and tear, with peeling paint and possible rot. | Major | $15,000–50,000 |
| flooring replacement · Visible wear and potential damage. | Major | $15,000–50,000 |
| HVAC/mechanical repair · Visible rust and potential malfunction. | Major | $15,000–50,000 |
| landscaping and curb appeal · Minimal landscaping and overgrown vegetation. | Major | $15,000–50,000 |
| interior wall and paint repair · Significant wear and tear, with peeling paint and potential damage. | Major | $15,000–50,000 |
| Total estimated repair cost · 6 items | $90,000–300,000 |
Value-add ROI direction
- Resale roof repair and replacement — A new roof will significantly improve the home's appearance and reduce potential water damage. ↑
- Resale exterior siding and paint repair — A fresh coat of paint and new siding will greatly enhance the home's curb appeal. ↑
- Resale flooring replacement — New flooring will improve the home's overall appearance and functionality. ↑
- Both HVAC/mechanical repair and replacement — A new HVAC system will improve comfort and energy efficiency, benefiting both resale and rental value. ↑
- Resale landscaping and curb appeal — A well-maintained landscape will significantly enhance the home's curb appeal and resale value. ↑
- Resale interior wall and paint repair — Fresh paint and repairs will improve the home's interior appearance and resale value. ↑
ⓘ Cost ranges are severity-bucket heuristics (US national rule-of-thumb). Get contractor quotes + a written scope before underwriting a rehab budget.
Schools (NCES district)
No district data.
Livability — Memphis
- Score
- 70/100
- State rank
- #164
- US rank
- #7848
Category grades
Schools grade is shown separately in the Schools card above.
Census & demographics
- Census place
- Memphis, IN
- Population (ZIP)
- 3,775
Population outlook (Clark County) Hauer SSP2
- Today (2025)
- 126,401 people
- By 2030
- 131,455 · +4.0%
- By 2040
- 140,471 · +11.1%
- By 2050
- 147,677 · +16.8%
- By 2075
- 161,702 · +27.9%
- By 2100
- 164,078 · +29.8%
Race, ethnicity, and origin ACS 2023
- Neighborhood character
- Predominantly White (93%)
- Race & ethnicity
- White 93% Two or more races 6% Hispanic / Latino 2% Black 1%
- Common ancestry
- Italian 5% American 3% Iranian 2%
- Foreign-born
- 1% · Canada
- Languages at home
- 98% English-only · Spanish 2%
Political lean MEDSL · Clark
- 2024 margin
- Strong R (+20.4) · D 38.9% · R 59.3% · Other 1.8%
- 2008→2024 swing
- -13.3pp toward R · 2008: -7.1pp · 2024: -20.4pp
- All cycles
- 2024: R+20.4 2020: R+18.3 2016: R+22.0 2012: R+9.9 2008: R+7.1
Not yet ingested
- Civics
- —
Market trends
- HPI YoY
- ▼ -80.60%
- Current HPI
- 184.1286
- Rent YoY
- —
- Metro
- —
- State GDP YoY
- ▲ 2.90%
- F500 in state
- 18
Industry mix (Fortune 500 HQ in IN)
| Industry | F500 HQs | Revenue |
|---|---|---|
| Industrial Machinery | 2 | $37B |
|
||
| Healthcare | 1 | $177B |
|
||
| Pharmaceuticals | 1 | $45B |
|
||
| Metals / Steel | 1 | $18B |
|
||
| Agriculture | 1 | $17B |
|
||
| Packaging | 1 | $12B |
|
||
Price history
+0.0% since first listed4 events — show timeline
- 2026-05-19 Relisted — Zillow
- 2026-05-14 Delisted — Zillow
- 2026-05-06 Listed $269,990 Zillow
- 2026-04-09 Listed $269,990 IRMLS
Cash-flow waterfall
monthlySold comps — $/sqft
last 12 mo · ≤1 miLoading sold comps…