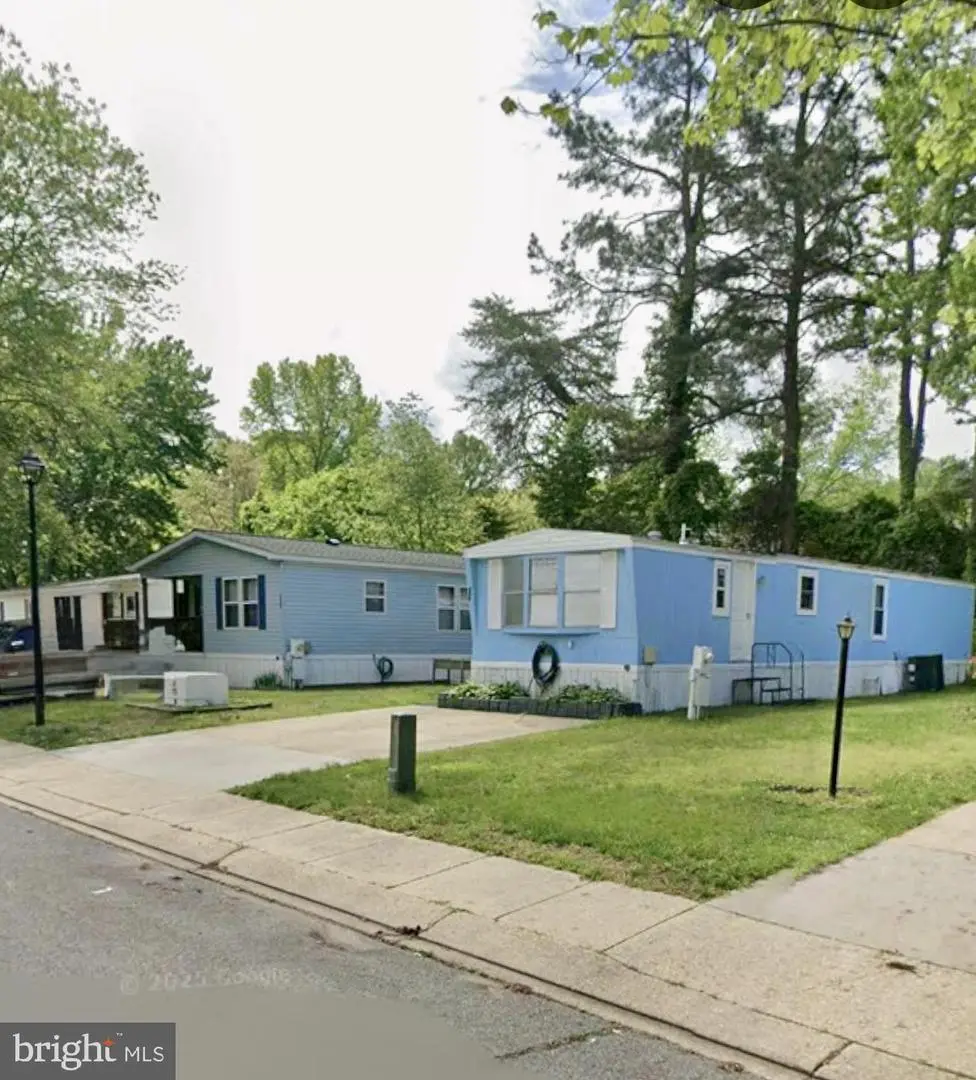
299 Rips Dr · Marlboro Meadows, MD
Flood risk 1/10 · Minimal
- FEMA flood zone
- X (unshaded)
- Chance of flooding over 30 yrs
- 0.0%
- Est. flood insurance / yr
- $507 – $1,088
Fire risk 1/10 · Minimal
- Est. fire insurance / yr
- $755 – $1,403
Heat risk 9/10 · Severe
- Hot days now (above 103°F)
- 7 days/yr
- Hot days in 30 yrs
- 17 days/yr
Wind risk 6/10 · Moderate
- Chance of severe wind over 30 yrs
- 27.0%
Air-quality risk 3/10 · Minor
- Unhealthy air days now
- 2 days/yr
- Unhealthy air days in 30 yrs
- 3 days/yr
Risk factors via First Street. Map © Google.
Why this score? — see what drove the B+ grade
The composite is a weighted blend of 9 inputs, each scored 0–100. Each bar is that input's sub-score; the figure is the points it added to the 100-point composite (weight × sub-score).
- Cash flow +30.0/30.0
- ARV discount +15.0/15.0
- 1% rule +10.0/10.0
- DSCR +10.0/10.0
- Livability +3.1/5.0
- Schools +2.9/10.0
- Rent growth +2.5/5.0
- Condition / age +2.2/5.0
- Appreciation +0.0/10.0
$55,000
🖨 Deal sheet 📄 Offer letter ✓ Due diligence
Listing remarks
Welcome to 299 Rips Dr! This well-maintained 2-bedroom, 2-bathroom mobile home offers comfortable living with an open concept layout, generous natural light, and a functional floor plan. The eat-in kitchen features ample cabinet space and flows seamlessly into the living area — ideal for relaxing or entertaining. Both bedrooms are nicely sized, including a primary suite with a private bath. Enjoy the yard, plenty of parking, and a peaceful location close to shopping, dining, and major commuter routes.
Key facts
- Peaceful location
- Private bath
- Ample cabinet space
Tags
Property features AI
Finance
- Other: Income/expense listing notes annual ground rent
- Financial info: Ground rent exists and is paid monthly
- HOA & community: Community pool
Exterior
- Parking: Driveway
- Utilities: Community water; Community septic tank; Electric service
- Home design: Manufactured home; Estimated built/major remodel in 2024; Ownership on ground rent
- Construction: Aluminum siding; Metal roof; Replacement double-pane vinyl-clad windows with screens
- Exterior features: Deck(s); Shed; Secure storage; Sidewalks; Community pool; Above-grade outdoor structure
Interior
- Kitchen: Built-in microwave; Refrigerator; Dishwasher; Electric oven/range
- Bedrooms: 2 bedrooms on the main level
- Flooring: Laminate plank flooring
- Bathrooms: 2 full bathrooms (both on the main level)
- Heating & cooling: Heat pump heating; Central air conditioning (electric); Electric hot water
- Interior features: Open floor plan with kitchen/dining combination; Master bathroom; Recessed lighting; Six-panel doors
- Laundry & utility: Washer; Dryer
Neighborhood map
What this means for you Summary
Snapshot
- This is a 2-bed/2.0-bath single-family listed at $55k. Condition is rated fair.
Deal economics
- At list price, monthly cash flow is $1k ($16k/yr) — positive.
- The deal already cash-flows at list — no discount required.
- Meets the 1% rule at list price ($2k rent vs $55k).
- Recommended offer: $53k (3.0% below list) — sets the bar for market timing.
- Cap rate 35.1% vs local median 9.1% in Marlboro Meadows — top-decile yield for the area; either an underpriced asset or a hidden risk that comps aren't pricing in. Stress-test before assuming the spread holds.
Location & tenants
- Location reads 62/100 on livability (#327 in MD) — a middle-class / working-renter tenant base. Strengths: employment A+, housing A+, crime A-; Watch: amenities F, commute F, cost of living D-.
- Anne Arundel County Public Schools (suburban): math 20% / reading 37% proficiency, ranked #10 of 24 in MD (top 42%) — low school quality limits family demand, transient renter base, plan for 1-2y turnover.
- Zoned schools: Southern High (math 52% / reading 73%, grade B-, #62 of 222 statewide, top 29%, 1,066 students, 40% FRL).
- Zoned-school proficiency averages 62% at this address vs 28% district-wide (+34 pts) — the actual schools serving this property are materially stronger than the Anne Arundel County Public Schools average implies; a family-tenant draw the district grade alone would hide.
- Market conditions: 50 active listings in the ZIP; 1 comparable units currently listed for rent nearby; 1,303 units permitted in Anne Arundel County in 2024 (299 in 5+ unit buildings).
Forward outlook
- Local home prices are declining (-3.0%/yr); year-one equity from $380 of loan paydown is wiped out by about $2k of value loss. Plan a longer hold.
- Anne Arundel County population projected at +17% by 2050 — long-run rental-demand tailwind backs the buy-and-hold thesis.
- At projected returns (-3.0% appreciation + 3.0% rent growth), your $15k cash investment doubles in ~2 years — after that, you're playing with house money.
Negotiation context
- It's been on market 37 days — a 3% lower offer ($53k) is reasonable based on typical stale-listing flexibility.
- 3 sale attempts since 2y ago with the ask held roughly flat each time — persistent listings suggest the price (not the market) is what's stuck; bring a comps-based counter.
Risks & watch-outs
- Climate carrying-cost: major wind risk, 27% chance of damaging wind over 30y; extreme-heat days projected 7→17/yr by 2055 (HVAC capex compounding) — expect insurance premiums to compound above CPI over the hold.
Questions for the listing agent
- It's been on market 37 days. Have you received any prior offers? Is the seller open to a 3% concession, seller financing, or rate buy-down credit?
- Have any recent inspections been done? Can we get a copy of the seller's disclosures and any deferred-maintenance estimates?
- Is there a deadline driving the sale (1031 exchange, divorce, estate, relocation)? That informs how much negotiation room exists.
- Schools are D-rated, which usually means shorter tenancies and higher turnover. Who's the typical renter profile here, and what's been the actual vacancy rate?
- What's the average days-on-market for RENTAL listings here right now (not sales)? A rising rental-DOM trend means longer vacancies and softer asking-rent achievability than the comps imply.
- What's the recent tenant-quality profile in this submarket — average credit score on applications, eviction rate, late-payment / NSF rate, and stable-employment percentage? A property-management company in the area should have these aggregated.
- How much new for-sale + rental construction is in the pipeline within 1–3 miles? Heavy new supply typically softens prices + rents 12–24 months out; constrained supply supports both.
Investment metrics
- 1% rule
- 3.91% ✓
- Cap rate
- 35.06%
- Cash-on-cash
- 102.73%
- DSCR
- 5.57
- GRM
- 2.1
CMA / ARV
- ARV (median comp)
- $70,232
- List price
- $55,000
- Delta
- -21.69%
- Verdict
- UNDERPRICED
- Comps
- 10 within 1.0 mi
Show comp detail 4 sales within ~0.75 mi
| Address | Dist | Beds/Ba | Sqft | Sold | Price | $/sf | Match |
|---|---|---|---|---|---|---|---|
| 190 Boones Dr | 0.28mi | 2/2.0 | 935 (+12%) | 1mo | $71,100 | $76 | 66 |
| 263 Konrad Morgan Way | 0.22mi | 3/2.0 (+1) | 940 (+13%) | 5mo | $65,000 | $69 | 60 |
| 214 Konrad Morgan Way | 0.22mi | 2/2.0 | 960 (+15%) | 6mo | $48,000 | $50 | 60 |
| 445 Sarah Anne Dr | 0.19mi | 3/2.0 (+1) | 952 (+14%) | 11mo | $62,900 | $66 | 54 |
Match score weights: distance 35% · size 25% · config 20% · recency 20%. Top-matched comps best support the ARV.
Projected returns pro-forma
-3.0% appreciation · 3.0% rent growth · sell at horizon
- IRR
- —
- Equity multiple
- 5.88×
- Total profit
- $75,090
- Equity at exit
- $8,201
- IRR
- —
- Equity multiple
- 12.28×
- Total profit
- $173,644
- Equity at exit
- $4,755
Cash invested: $15,400 (down + closing). Projections, not guarantees.
Landlord ↔ Tenant lean methodology
- Overall (STATE)
- 27 Tenant-Leaning
- State Maryland
- 27 Tenant-Leaning · D+14
- County
- — inherits STATE
- City
- — inherits STATE
ZIP-level market 20711
- Active inventory
- 50
- Price-to-rent
- 2.1×
Monthly cashflow live
- Estimated rent
- $2,150 medium interval (Pro) →
- Mortgage (P&I)
- −$288
- Tax est. 1.5%
- −$69 /mo · $825/yr
- Insurance
- −$23
- HOA
- −$0
- Vacancy / Maint / Mgmt
- −$452
- Net cashflow
- $1,318
Break-even live
UW: 25.0% down · 7.5% · 30yr · 1.5% tax · 5.0% vac · 8.0% maint · 8.0% mgmt
Financing live
Cash to close
- Down payment
- $13,750
- Closing costs
- $1,650
- Reserves months
- —
- Total cash needed
- —
Loan-product check · same deal, 3 products live
Conventional
25% down · 7.5% · 30yr
- Down + closing
- —
- Monthly P&I
- —
- Monthly cashflow
- —
- DSCR
- —
- Eligible?
- —
Personal DTI + credit; lowest rate.
DSCR
20% down · 8.5% · 30yr
- Down + closing
- —
- Monthly P&I
- —
- Monthly cashflow
- —
- DSCR
- —
- Eligible?
- —
No personal income docs; deal must DSCR.
Hard money
10% down · 12.0% · 12mo
- Down + closing
- —
- Monthly P&I
- —
- Monthly cashflow
- —
- DSCR
- —
- Eligible?
- —
Short-term bridge; refi at stabilization.
Rent comps 1 comps
| Address | Beds | Baths | Sqft | Rent | $/sqft | DOM | Units | Dist |
|---|---|---|---|---|---|---|---|---|
| 5242 Sands Rd Lothian, MD | 2.0 | 1.0 | 600 | $2,150 | $3.58 | 4d | 1 | 1.28mi |
Listing history 26 events
-
2026-06-18days on market $55,000 Active 37 DOM
-
2026-06-17days on market $55,000 Active 36 DOM
-
2026-06-16days on market $55,000 Active 35 DOM
-
2026-06-15days on market $55,000 Active 34 DOM
-
2026-06-13days on market $55,000 Active 32 DOM
-
2026-06-09days on market $55,000 Active 28 DOM
-
2026-06-08days on market $55,000 Active 27 DOM
-
2026-06-07days on market $55,000 Active 26 DOM
-
2026-06-04days on market $55,000 Active 23 DOM
-
2026-06-03days on market $55,000 Active 22 DOM
-
2026-06-02days on market $55,000 Active 21 DOM
-
2026-06-01days on market $55,000 Active 20 DOM
-
2026-05-31days on market $55,000 Active 19 DOM
-
2026-05-12$55,000 Active 512-char remark
-
2026-05-05historical
-
2026-02-12$60,000 Active
-
2026-02-07historical
-
2025-08-31historical
-
2025-06-12price $60,000
-
2025-05-29price $62,500
-
2025-03-20price $64,900
-
2025-01-30price $67,900
-
2024-11-16price $69,900
-
2024-10-05price $72,500
-
2024-07-30price $74,900
-
2024-07-15$79,900 Active
ⓘ Source: listings_history table (triggers on properties + properties_extension) + one-shot
backfill from property_details.listing_events for pre-trigger history.
Climate risk First Street
- Flood 1/10 Low FEMA zone X (unshaded) · 0% chance over 30 yrs
- Wildfire 1/10 Low
- Heat 9/10 Extreme 7 d/yr ≥103°F today · 17 d/yr by 30 yrs out
- Wind 6/10 Major 27% chance of damaging wind over 30 yrs
- Air quality 3/10 Moderate 2 unhealthy d/yr today · 3 by 30 yrs out
Nearby sold comps map
Loading sold comps map…
Walkable amenities ~0.75 mi
Loading nearby amenities…
Taxation est. · year 1
- Rental income
- $25,800
- − Mortgage interest
- −$3,081
- − Property taxes
- −$825
- − Insurance
- −$275
- − Repairs & maintenance
- −$2,064
- − Management
- −$2,064
- − Depreciation
- −$1,600
- Taxable income
- $15,891
- Est. tax owed @ 24.0%
- −$3,814
- After-tax cash flow
- $12,007/yr
For passive investors: Depreciation is non-cash, so a rental often shows a tax loss while cash-flowing — sheltering income. Rental losses are passive: they offset passive income freely, and up to $25,000/yr can offset ordinary (W-2) income if you actively participate and your MAGI is under $100k (phasing out to $0 by $150k); unused losses carry forward. On sale, claimed depreciation is recaptured at up to 25%, and gains may owe capital-gains tax (a 1031 exchange can defer both). Figures are a year-1 estimate at your 24.0% rate — not tax advice; consult a CPA.
Condition & rehab AI · 12 photos
This mobile home requires moderate repairs and maintenance to improve its condition and value. Fresh paint, new carpet, and updated cabinets would significantly enhance its appeal.
Repairs flagged
- Moderate Kitchen cabinets — Worn condition
- Minor Bathroom fixtures — Need cleaning
- Minor Exterior siding — Some wear
Value-add opportunities
- Both Paint interior walls — Fresh paint enhances curb appeal and interior aesthetics
- Both Replace worn carpet — New carpet improves comfort and adds value
- Both Replace worn kitchen cabinets — New cabinets modernize the kitchen and add value
Renovation cost estimate screening
| Repair item | Severity | Est. cost |
|---|---|---|
| Kitchen cabinets · Worn condition | Moderate | $3,000–15,000 |
| Bathroom fixtures · Need cleaning | Minor | $500–3,000 |
| Exterior siding · Some wear | Minor | $500–3,000 |
| Total estimated repair cost · 3 items | $4,000–21,000 |
Value-add ROI direction
- Both Paint interior walls — Fresh paint enhances curb appeal and interior aesthetics ↑
- Both Replace worn carpet — New carpet improves comfort and adds value ↑
- Both Replace worn kitchen cabinets — New cabinets modernize the kitchen and add value ↑
ⓘ Cost ranges are severity-bucket heuristics (US national rule-of-thumb). Get contractor quotes + a written scope before underwriting a rehab budget.
Schools (NCES district)
- District
- Anne Arundel County Public Schools
- NCES district ID
- 2400060
- Math proficiency
- 20% ▼ -21.00%
- Reading proficiency
- 37% ▼ -13.00%
- Median HH income
- $87,880
- Composite
- 28.52/100
- National rank
- #6733
- State rank
- #10 of 24 in MD
Livability — Marlboro Meadows
- Score
- 62/100
- State rank
- #327
- US rank
- #17129
Category grades
Schools grade is shown separately in the Schools card above.
Census & demographics
- Population (ZIP)
- 7,629
Population outlook (Anne Arundel County) Hauer SSP2
- Today (2025)
- 617,384 people
- By 2030
- 642,094 · +4.0%
- By 2040
- 686,621 · +11.2%
- By 2050
- 723,031 · +17.1%
- By 2075
- 809,346 · +31.1%
- By 2100
- 837,658 · +35.7%
Race, ethnicity, and origin ACS 2023
- Neighborhood character
- Diverse neighborhood (Simpson 0.57)
- Race & ethnicity
- White 60% Hispanic / Latino 24% Two or more races 12% Black 11%
- Hispanic origin (detail)
- Mexican 2% Puerto Rican 2%
- Common ancestry
- Portuguese 3% Scotch-Irish 2% Italian 1%
- Foreign-born
- 10% · Canada
- Languages at home
- 86% English-only · Spanish 10% Other Asian/Pacific 2%
Political lean MEDSL · Anne Arundel
- 2024 margin
- D (+13.9) · D 55.7% · R 41.7% · Other 2.6%
- 2008→2024 swing
- +15.7pp toward D · 2008: -1.8pp · 2024: 13.9pp
- All cycles
- 2024: D+13.9 2020: D+14.5 2016: D+0.7 2012: R+0.9 2008: R+1.8
Not yet ingested
- Civics
- —
Market trends
- HPI YoY
- ▼ -131.12%
- Current HPI
- 232.1067
- Rent YoY
- —
- Metro
- —
- State GDP YoY
- ▲ 2.97%
- F500 in state
- 12
Industry mix (Fortune 500 HQ in MD)
| Industry | F500 HQs | Revenue |
|---|---|---|
| Aerospace / Defense | 1 | $71B |
|
||
| Utilities | 1 | $25B |
|
||
| Hotels | 1 | $24B |
|
||
| Consumer Goods | 1 | $7B |
|
||
| Real Estate | 1 | $6B |
|
||
| Chemicals | 1 | $2B |
|
||
Price history
-31.2% since first listed13 events — show timeline
- 2026-05-12 Listed $55,000 BRIGHT MLS
- 2026-05-05 Listing Removed — BRIGHT MLS
- 2026-02-12 Listed $60,000 BRIGHT MLS
- 2026-02-07 Coming Soon — BRIGHT MLS
- 2025-08-31 Listing Removed — BRIGHT MLS
- 2025-06-12 Price Changed $60,000 BRIGHT MLS
- 2025-05-29 Price Changed $62,500 BRIGHT MLS
- 2025-03-20 Price Changed $64,900 BRIGHT MLS
- 2025-01-30 Price Changed $67,900 BRIGHT MLS
- 2024-11-16 Price Changed $69,900 BRIGHT MLS
- 2024-10-05 Price Changed $72,500 BRIGHT MLS
- 2024-07-30 Price Changed $74,900 BRIGHT MLS
- 2024-07-15 Listed $79,900 BRIGHT MLS
Cash-flow waterfall
monthlySold comps — $/sqft
last 12 mo · ≤1 miLoading sold comps…