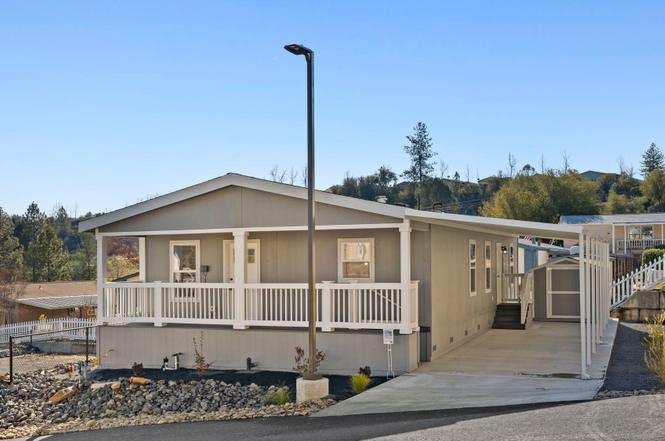
18717 Mill Villa Rd #539 · Jamestown, CA
Flood risk No data
- FEMA flood zone
- —
- Chance of flooding over 30 yrs
- —
- Est. flood insurance / yr
- —
Fire risk No data
- Est. fire insurance / yr
- —
Heat risk No data
- Hot days now (above threshold)
- —
- Hot days in 30 yrs
- —
Wind risk No data
- Chance of severe wind over 30 yrs
- —
Air-quality risk No data
- Unhealthy air days now
- —
- Unhealthy air days in 30 yrs
- —
Risk factors via First Street. Map © Google.
Why this score? — see what drove the F grade
The composite is a weighted blend of 9 inputs, each scored 0–100. Each bar is that input's sub-score; the figure is the points it added to the 100-point composite (weight × sub-score).
- Cash flow +13.6/30.0
- DSCR +4.1/10.0
- 1% rule +3.8/10.0
- Schools +3.3/10.0
- Livability +2.7/5.0
- Rent growth +2.5/5.0
- Condition / age +2.5/5.0
- ARV discount +0.0/15.0
- Appreciation +0.0/10.0
$189,900
🖨 Deal sheet (PDF) 📄 Offer letter ✓ Due diligence
Listing remarks
Welcome Home to Mill Villa Estates! This beautiful 2025 Skyline Stone Harbor home includes the following: 2 Bedrooms & 2 Bathrooms Approx 1,393 Square Feet 26.8' x 52' Front Porch Carpet & Vinyl Flooring Blinds Throughout Full Kitchen Appliance Package Washer & Dryer Hook-Ups Covered Carport & Storage Shed Great Location & Much More! Serial # 237-001775AB
Key facts
- Built 2025
- Listed 517 days
Property features AI
Finance
- Financial info: List price $189,900
Exterior
- Home design: Spec home listed as active; Plan: 18717 Mill Villa #539; Address: 18717 Mill Villa Rd #539, Jamestown, CA 95327
- Construction: Living area approximately 1393
Interior
- Bedrooms: 2 bedrooms
- Bathrooms: 2 full bathrooms
- Interior features: Virtual tour available
Neighborhood map
What this means for you Summary
Snapshot
- This is a 2-bed/2.0-bath manufactured listed at $190k.
Deal economics
- At list price, monthly cash flow is $10 ($121/yr) — positive.
- The deal already cash-flows at list — no discount required.
- To meet the 1% rule (rent ≥ 1% of price), the offer needs to be $167k (11.8% below list).
- Recommended offer: $167k (12.0% below list) — sets the bar for market timing.
- Cap rate 6.4% vs local median 4.9% in Jamestown — meaningfully above typical; check what's discounted (condition, days-on-market, listing class) to confirm the premium yield is real.
Location & tenants
- Location reads 53/100 on livability (#980 in CA) — a working-class tenant base; expect higher turnover. Strengths: crime B; Watch: housing C-, cost of living D, amenities F.
- Sonora Union High (town): math 21% / reading 59% proficiency, ranked #243 of 517 in CA (top 47%) — families likely to look elsewhere, expect single-tenant / working-renter base with shorter leases.
- Zoned schools: Jamestown Elementary (math 17% / reading 27%, grade F, #1,179 of 1,571 statewide, top 78%, 350 students, 75% FRL); Sonora High (math 27% / reading 67%, grade D-, #389 of 1,170 statewide, top 35%, 919 students, 36% FRL).
- Market conditions: 75 active listings in the ZIP; 60 units permitted in Tuolumne County in 2024 (0 in 5+ unit buildings).
Forward outlook
- Local home prices are declining (-3.0%/yr); year-one equity from $1k of loan paydown is wiped out by about $6k of value loss. Plan a longer hold.
- Tuolumne County population projected at -15% by 2050 — secular population decline; favor cash flow + early exit over multi-decade hold.
Negotiation context
- It's been on market 517 days — a 12% lower offer ($167k) is reasonable based on typical stale-listing flexibility.
Questions for the listing agent
- It's been on market 517 days. Have you received any prior offers? Is the seller open to a 12% concession, seller financing, or rate buy-down credit?
- Why hasn't it sold? Are there any deal-killer items the seller is aware of (foundation, flood, title, zoning, code violations)?
- Is there a deadline driving the sale (1031 exchange, divorce, estate, relocation)? That informs how much negotiation room exists.
- Schools are F-rated, which usually means shorter tenancies and higher turnover. Who's the typical renter profile here, and what's been the actual vacancy rate?
- The area grade is low — what's the realistic commute time and amenity access for the typical tenant pool here? Any planned neighborhood developments (good or bad) we should know about?
- What's the average days-on-market for RENTAL listings here right now (not sales)? A rising rental-DOM trend means longer vacancies and softer asking-rent achievability than the comps imply.
- What's the recent tenant-quality profile in this submarket — average credit score on applications, eviction rate, late-payment / NSF rate, and stable-employment percentage? A property-management company in the area should have these aggregated.
- How much new for-sale + rental construction is in the pipeline within 1–3 miles? Heavy new supply typically softens prices + rents 12–24 months out; constrained supply supports both.
Investment metrics
- 1% rule
- 0.88% ✗
- Cap rate
- 6.36%
- Cash-on-cash
- 0.23%
- DSCR
- 1.01
- GRM
- 9.5
CMA / ARV
- ARV (on-the-fly)
- $129,549
- Comps found
- 12
Show comp detail 12 sales within ~0.75 mi
| Address | Dist | Beds/Ba | Sqft | Sold | Price | $/sf | Match |
|---|---|---|---|---|---|---|---|
| 18717 Mill Villa Rd #515 | 0.14mi | 2/2.0 | 1,394 (+0%) | 2mo | $130,000 | $93 | 92 |
| 18717 Mill Villa Rd #636 | 0.14mi | 2/2.0 | 1,344 (-4%) | 3mo | $87,500 | $65 | 85 |
| 18717 Mill Villa Rd. #610 #610 | 0.14mi | 2/2.0 | 1,344 (-4%) | 4mo | $110,000 | $82 | 84 |
| 18717 Mill Villa Rd #310 #310 | 0.14mi | 2/2.0 | 1,344 (-4%) | 7mo | $100,000 | $74 | 82 |
| 18717 Mill Villa Rd #407 #407 | 0.14mi | 2/2.0 | 1,344 (-4%) | 7mo | $118,000 | $88 | 82 |
| 18717 Mill Villa Rd. #100 #100 | 0.14mi | 3/2.0 (+1) | 1,440 (+3%) | 3mo | $151,000 | $105 | 80 |
| 18717 Mill Villa Rd #328 | 0.14mi | 2/2.0 | 1,344 (-4%) | 10mo | $125,000 | $93 | 80 |
| 18717 Mill Villa Rd #314 #314 | 0.14mi | 2/2.0 | 1,344 (-4%) | 10mo | $130,000 | $97 | 79 |
| 18717 Mill Villa Rd #619 | 0.14mi | 3/2.0 (+1) | 1,344 (-4%) | 6mo | $130,000 | $97 | 78 |
| 18717 Mill Villa #547 | 0.14mi | 3/2.0 (+1) | 1,500 (+8%) | 1mo | $133,500 | $89 | 75 |
| 18615 Vista Dr | 0.16mi | 3/2.0 (+1) | 1,458 (+5%) | 8mo | $330,000 | $226 | 73 |
| 11761 Essen Ln | 0.64mi | 3/2.0 (+1) | 1,344 (-4%) | 2mo | $242,000 | $180 | 57 |
Match score weights: distance 35% · size 25% · config 20% · recency 20%. Top-matched comps best support the ARV.
Projected returns pro-forma
-3.0% appreciation · 3.0% rent growth · sell at horizon
- IRR
- -15.9%
- Equity multiple
- 0.43×
- Total profit
- $-30,104
- Equity at exit
- $28,315
- IRR
- -7.5%
- Equity multiple
- 0.52×
- Total profit
- $-25,284
- Equity at exit
- $16,419
Cash invested: $53,172 (down + closing). Projections, not guarantees.
Landlord ↔ Tenant lean methodology
- Overall (STATE)
- 18 Strongly Tenant-Friendly
- State California
- 18 Strongly Tenant-Friendly · D+13
- County
- — inherits STATE
- City
- — inherits STATE
ZIP-level market 95327
- Active inventory
- 75
- Price-to-rent
- 9.5×
Monthly cashflow live
- Estimated rent
- $1,674 medium interval (Pro) →
- Mortgage (P&I)
- −$996
- Tax est. 1.5%
- −$237 /mo · $2,848/yr
- Insurance
- −$79
- HOA
- −$0
- Vacancy / Maint / Mgmt
- −$352
- Net cashflow
- $10
Break-even live
Sensitivity live
| Price | -10% $141 | -5% $76 | +0% $10 | +5% $-56 | +10% $-121 |
|---|---|---|---|---|---|
| Rent | -10% $-122 | -5% $-56 | +0% $10 | +5% $76 | +10% $142 |
| Rate | -1.0pp $106 | -0.5pp $58 | base $10 | +0.5pp $-39 | +1.0pp $-89 |
UW: 25.0% down · 7.5% · 30yr · 1.5% tax · 5.0% vac · 8.0% maint · 8.0% mgmt
Financing live
Cash to close
- Down payment
- $47,475
- Closing costs
- $5,697
- Reserves months
- —
- Total cash needed
- —
Loan-product check · same deal, 3 products live
Conventional
25% down · 7.5% · 30yr
- Down + closing
- —
- Monthly P&I
- —
- Monthly cashflow
- —
- DSCR
- —
- Eligible?
- —
Personal DTI + credit; lowest rate.
DSCR
20% down · 8.5% · 30yr
- Down + closing
- —
- Monthly P&I
- —
- Monthly cashflow
- —
- DSCR
- —
- Eligible?
- —
No personal income docs; deal must DSCR.
Hard money
10% down · 12.0% · 12mo
- Down + closing
- —
- Monthly P&I
- —
- Monthly cashflow
- —
- DSCR
- —
- Eligible?
- —
Short-term bridge; refi at stabilization.
Listing history 17 events
-
2026-06-21days on market $189,900 Active 517 DOM
-
2026-06-18days on market $189,900 Active 514 DOM
-
2026-06-17days on market $189,900 Active 513 DOM
-
2026-06-16days on market $189,900 Active 512 DOM
-
2026-06-15days on market $189,900 Active 511 DOM
-
2026-06-14days on market $189,900 Active 509 DOM
-
2026-06-13days on market $189,900 Active 508 DOM
-
2026-06-10days on market $189,900 Active 506 DOM
-
2026-06-09days on market $189,900 Active 505 DOM
-
2026-06-08days on market $189,900 Active 504 DOM
-
2026-06-07days on market $189,900 Active 503 DOM
-
2026-06-05days on market $189,900 Active 500 DOM
-
2026-06-03days on market $189,900 Active 499 DOM
-
2026-06-02days on market $189,900 Active 498 DOM
-
2026-06-01days on market $189,900 Active 497 DOM
-
2026-05-31days on market $189,900 Active 496 DOM
-
2026-05-30days on market $189,900 Active 495 DOM
ⓘ Source: listings_history table (triggers on properties + properties_extension) + one-shot
backfill from property_details.listing_events for pre-trigger history.
Nearby sold comps map
Loading sold comps map…
Walkable amenities ~0.75 mi
Loading nearby amenities…
Taxation est. · year 1
- Rental income
- $20,088
- − Mortgage interest
- −$10,637
- − Property taxes
- −$2,848
- − Insurance
- −$950
- − Repairs & maintenance
- −$1,607
- − Management
- −$1,607
- − Depreciation
- −$5,524
- Taxable loss
- −$3,086
- Est. tax savings @ 24.0%
- +$741
- After-tax cash flow
- $862/yr
For passive investors: Depreciation is non-cash, so a rental often shows a tax loss while cash-flowing — sheltering income. Rental losses are passive: they offset passive income freely, and up to $25,000/yr can offset ordinary (W-2) income if you actively participate and your MAGI is under $100k (phasing out to $0 by $150k); unused losses carry forward. On sale, claimed depreciation is recaptured at up to 25%, and gains may owe capital-gains tax (a 1031 exchange can defer both). Figures are a year-1 estimate at your 24.0% rate — not tax advice; consult a CPA.
Schools (NCES district)
- District
- Sonora Union High
- NCES district ID
- 0637260
- Math proficiency
- 21% ▼ -12.00%
- Reading proficiency
- 59% ▼ -5.00%
- Median HH income
- $40,252
- Composite
- 33.41/100
- National rank
- #5470
- State rank
- #243 of 517 in CA
Livability — Jamestown
- Score
- 53/100
- State rank
- #980
- US rank
- #24642
Category grades
Schools grade is shown separately in the Schools card above.
Census & demographics
- Census place
- Jamestown, CA
- Population (ZIP)
- 8,799
Population outlook (Tuolumne County) Hauer SSP2
- Today (2025)
- 50,349 people
- By 2030
- 48,708 · -3.3%
- By 2040
- 45,284 · -10.1%
- By 2050
- 42,575 · -15.4%
- By 2075
- 36,827 · -26.9%
- By 2100
- 30,369 · -39.7%
Race, ethnicity, and origin ACS 2023
- Neighborhood character
- Majority White (63%)
- Race & ethnicity
- White 63% Hispanic / Latino 24% Two or more races 13% Black 7% Native American 3% Asian 1%
- Hispanic origin (detail)
- Mexican 15%
- Common ancestry
- Slovak 4% Serbian 3% Lithuanian 2%
- Foreign-born
- 5% · Canada
- Languages at home
- 87% English-only · Spanish 11% Other Asian/Pacific 1%
Political lean MEDSL · Tuolumne
- 2024 margin
- Strong R (+21.9) · D 37.9% · R 59.7% · Other 2.4%
- 2008→2024 swing
- -9.2pp toward R · 2008: -12.7pp · 2024: -21.9pp
- All cycles
- 2024: R+21.9 2020: R+18.8 2016: R+20.9 2012: R+15.9 2008: R+12.7
Not yet ingested
- Civics
- —
Market trends
- HPI YoY
- ▼ -129.96%
- Current HPI
- 100.2616
- Rent YoY
- —
- Metro
- —
- State GDP YoY
- ▲ 3.21%
- F500 in state
- 116
Industry mix (Fortune 500 HQ in CA)
| Industry | F500 HQs | Revenue |
|---|---|---|
| Technology | 27 | $1,492B |
|
||
| Financial Services | 3 | $174B |
|
||
| Retail | 3 | $44B |
|
||
| Insurance | 3 | $26B |
|
||
| Media / Entertainment | 2 | $115B |
|
||
| Pharmaceuticals / Biotech | 2 | $62B |
|
||
Cash-flow waterfall
monthlySold comps — $/sqft
last 12 mo · ≤1 miLoading sold comps…