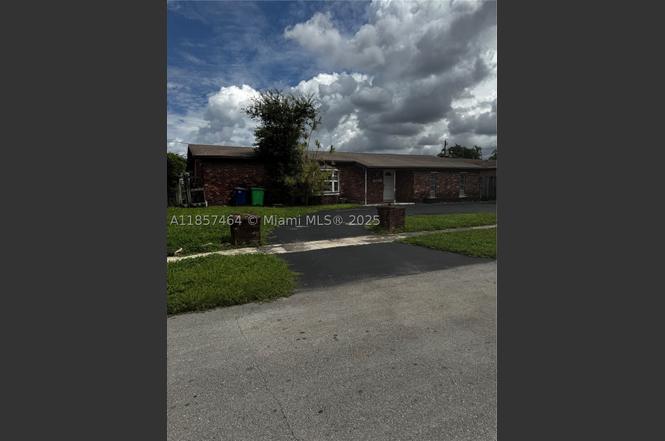
9661 NW 19th Pl · Sunrise, FL
Flood risk 1/10 · Minimal
- FEMA flood zone
- X (shaded)
- Chance of flooding over 30 yrs
- 0.0%
- Est. flood insurance / yr
- $507 – $1,088
Fire risk 1/10 · Minimal
- Est. fire insurance / yr
- $947 – $1,759
Heat risk 9/10 · Severe
- Hot days now (above 106°F)
- 4 days/yr
- Hot days in 30 yrs
- 15 days/yr
Wind risk 10/10 · Severe
- Chance of severe wind over 30 yrs
- 99.0%
Air-quality risk 3/10 · Minor
- Unhealthy air days now
- 2 days/yr
- Unhealthy air days in 30 yrs
- 3 days/yr
Risk factors via First Street. Map © Google.
Why this score? — see what drove the C- grade
The composite is a weighted blend of 9 inputs, each scored 0–100. Each bar is that input's sub-score; the figure is the points it added to the 100-point composite (weight × sub-score).
- ARV discount +15.0/15.0
- Cash flow +13.8/30.0
- DSCR +4.2/10.0
- Livability +4.2/5.0
- Schools +4.1/10.0
- 1% rule +4.0/10.0
- Rent growth +2.7/5.0
- Condition / age +2.5/5.0
- Appreciation +0.0/10.0
$415,000
🖨 Deal sheet (PDF) 📄 Offer letter ✓ Due diligence
Listing remarks
4-bedroom, three-bathroom home with converted garage.
Key facts
- 7,500 sq ft lot
- Parking
- Pool
Neighborhood map
What this means for you Summary
Snapshot
- This is a 4-bed/3.0-bath single-family listed at $415k.
Deal economics
- At list price, monthly cash flow is $35 ($423/yr) — positive.
- The deal already cash-flows at list — no discount required.
- To meet the 1% rule (rent ≥ 1% of price), the offer needs to be $374k (9.9% below list).
- Recommended offer: $374k (9.9% below list) — sets the bar for 1% rule.
- Cap rate 6.4% vs local median 4.9% in Sunrise — top-decile yield for the area; either an underpriced asset or a hidden risk that comps aren't pricing in. Stress-test before assuming the spread holds.
Location & tenants
- Location reads 83/100 on livability (#56 in FL, #986 nationally) — a professional / high-income tenant draw. Strengths: commute A+, housing A+, health & safety A+; Watch: employment C-, amenities F.
- Broward (suburban): math 42% / reading 53% proficiency, ranked #46 of 73 in FL (top 63%) — families likely to look elsewhere, expect single-tenant / working-renter base with shorter leases.
- Zoned schools: Nova Blanche Forman Elementary (math 35% / reading 55%, grade D-, #1,271 of 2,144 statewide, top 60%, 769 students, 72% FRL); Nova Middle School (math 44% / reading 53%, grade C-, #274 of 571 statewide, top 50%, 1,284 students, 68% FRL); Piper High School (math 12% / reading 35%, grade F, #533 of 667 statewide, top 80%, 2,310 students, 65% FRL) — zoned schools average 68% FRL vs 51% district-wide (17 pts higher); higher-poverty schools than district average — tighter screening recommended.
- Market conditions: Rents flat; 560 active listings in the ZIP; 40 comparable units currently listed for rent nearby; rentals at typical pace (median 24d on market — plan ~3-4 weeks tenant-placement turnaround); 2,111 units permitted in Broward County in 2024 (1,265 in 5+ unit buildings).
- At $3,741/mo this rent would consume 63% of the median local household income ($72k/yr) (locally 931% of renters already pay >50% of income on rent) — very limited rent-growth headroom before tenants either downsize or default.
Forward outlook
- Local home prices are declining (-3.0%/yr); year-one equity from $3k of loan paydown is wiped out by about $12k of value loss. Plan a longer hold.
- Broward County population projected at +34% by 2050 — long-run rental-demand tailwind backs the buy-and-hold thesis.
Negotiation context
- Only 2 days on market — expect competitive offers; lowballing is unlikely to land.
- Current owner paid $310k; 34% above their basis — modest negotiation headroom, anchor on the comps not their cost.
Risks & watch-outs
- Climate carrying-cost: severe wind risk, 99% chance of damaging wind over 30y; extreme-heat days projected 4→15/yr by 2055 (HVAC capex compounding) — expect insurance premiums to compound above CPI over the hold.
Questions for the listing agent
- Built in 1973 — when were the roof, HVAC, electrical panel, plumbing, and water heater last replaced?
- Is there a deadline driving the sale (1031 exchange, divorce, estate, relocation)? That informs how much negotiation room exists.
- What's the average days-on-market for RENTAL listings here right now (not sales)? A rising rental-DOM trend means longer vacancies and softer asking-rent achievability than the comps imply.
- What's the recent tenant-quality profile in this submarket — average credit score on applications, eviction rate, late-payment / NSF rate, and stable-employment percentage? A property-management company in the area should have these aggregated.
- How much new for-sale + rental construction is in the pipeline within 1–3 miles? Heavy new supply typically softens prices + rents 12–24 months out; constrained supply supports both.
Investment metrics
- 1% rule
- 0.90% ✗
- Cap rate
- 6.39%
- Cash-on-cash
- 0.36%
- DSCR
- 1.02
- GRM
- 9.2
CMA / ARV
- ARV (on-the-fly)
- $632,944
- Comps found
- 10
Show comp detail 10 sales within ~0.75 mi
| Address | Dist | Beds/Ba | Sqft | Sold | Price | $/sf | Match |
|---|---|---|---|---|---|---|---|
| 9360 NW 21st Mnr | 0.28mi | 4/2.0 | 1,819 (+3%) | 11mo | $575,000 | $316 | 69 |
| 9701 NW 18th Ct | 0.26mi | 3/2.0 (-1) | 1,731 (-2%) | 9mo | $675,000 | $390 | 68 |
| 9431 NW NW 24th St | 0.27mi | 3/2.0 (-1) | 1,932 (+9%) | 1mo | $520,000 | $269 | 62 |
| 10431 NW 20th Ct | 0.56mi | 3/2.0 (-1) | 1,641 (-7%) | 2mo | $420,000 | $256 | 51 |
| 10640 NW 20th Ct | 0.73mi | 3/2.0 (-1) | 1,683 (-5%) | 3mo | $585,000 | $348 | 46 |
| 2440 NW 94th Way | 0.31mi | 3/2.0 (-1) | 1,580 (-11%) | 16mo | $598,500 | $379 | 46 |
| 9354 NW 18th Mnr | 0.27mi | 3/2.0 (-1) | 1,568 (-11%) | 18mo | $624,900 | $399 | 45 |
| 1950 NW 91st Way | 0.44mi | 3/2.0 (-1) | 1,580 (-11%) | 12mo | $610,000 | $386 | 42 |
| 2331 NW 93rd Ln | 0.29mi | 3/2.0 (-1) | 1,542 (-13%) | 23mo | $520,000 | $337 | 37 |
| 9081 NW 25th St | 0.63mi | 3/2.0 (-1) | 1,537 (-13%) | 21mo | $550,000 | $358 | 23 |
Match score weights: distance 35% · size 25% · config 20% · recency 20%. Top-matched comps best support the ARV.
Projected returns pro-forma
-3.0% appreciation · 0.6% rent growth · sell at horizon
- IRR
- -18.5%
- Equity multiple
- 0.37×
- Total profit
- $-73,738
- Equity at exit
- $61,878
- IRR
- -16.6%
- Equity multiple
- 0.18×
- Total profit
- $-95,462
- Equity at exit
- $35,882
Cash invested: $116,200 (down + closing). Projections, not guarantees.
Landlord ↔ Tenant lean methodology
- Overall (STATE)
- 87 Strongly Landlord-Friendly
- State Florida
- 87 Strongly Landlord-Friendly · R+3
- County
- — inherits STATE
- City
- — inherits STATE
ZIP-level market 33322
- Home prices YoY
- -33.3%
- Rents YoY
- 0.6%
- Active inventory
- 560
- Price-to-rent
- 9.2×
Monthly cashflow live
- Estimated rent
- $3,741 high interval (Pro) →
- Mortgage (P&I)
- −$2,176
- Tax from tax record
- −$571 /mo · $6,850/yr
- Insurance
- −$173
- HOA
- −$0
- Vacancy / Maint / Mgmt
- −$786
- Net cashflow
- $35
Break-even live
Sensitivity live
| Price | -10% $270 | -5% $153 | +0% $35 | +5% $-82 | +10% $-200 |
|---|---|---|---|---|---|
| Rent | -10% $-260 | -5% $-113 | +0% $35 | +5% $183 | +10% $331 |
| Rate | -1.0pp $244 | -0.5pp $141 | base $35 | +0.5pp $-72 | +1.0pp $-182 |
UW: 25.0% down · 7.5% · 30yr · 1.5% tax · 5.0% vac · 8.0% maint · 8.0% mgmt
Financing live
Cash to close
- Down payment
- $103,750
- Closing costs
- $12,450
- Reserves months
- —
- Total cash needed
- —
Loan-product check · same deal, 3 products live
Conventional
25% down · 7.5% · 30yr
- Down + closing
- —
- Monthly P&I
- —
- Monthly cashflow
- —
- DSCR
- —
- Eligible?
- —
Personal DTI + credit; lowest rate.
DSCR
20% down · 8.5% · 30yr
- Down + closing
- —
- Monthly P&I
- —
- Monthly cashflow
- —
- DSCR
- —
- Eligible?
- —
No personal income docs; deal must DSCR.
Hard money
10% down · 12.0% · 12mo
- Down + closing
- —
- Monthly P&I
- —
- Monthly cashflow
- —
- DSCR
- —
- Eligible?
- —
Short-term bridge; refi at stabilization.
Rent comps 40 comps
| Address | Beds | Baths | Sqft | Rent | $/sqft | DOM | Units | Dist |
|---|---|---|---|---|---|---|---|---|
| 9551 NW 19th Pl Fort Lauderdale, FL | 3.0 | 2.0 | 1577 | $3,700 | $2.35 | 23d | 1 | 0.11mi |
| 9571 Sunset Strip Sunrise, FL | 3.0 | 2.0 | 1418 | $3,450 | $2.43 | 23d | 1 | 0.17mi |
| 9571 Sunset Strip Sunrise, FL | 3.0 | 2.0 | 1418 | $3,450 | $2.43 | 26d | 1 | 0.17mi |
| 9650 NW 24th St Sunrise, FL | 3.0 | 2.0 | 1542 | $3,500 | $2.27 | 9d | 1 | 0.17mi |
| 9650 NW 24th St Sunrise, FL | 3.0 | 2.0 | 1542 | $3,500 | $2.27 | 26d | 1 | 0.17mi |
| 9840 NW 19th Pl Sunrise, FL | 3.0 | 2.5 | 1727 | $3,395 | $1.97 | 26d | 1 | 0.17mi |
| 9561 NW 18th Ct Plantation, FL | 3.0 | 2.5 | 2350 | $4,500 | $1.91 | 7d | 1 | 0.23mi |
| 9831 NW 24th St Sunrise, FL | 3.0 | 2.5 | 1887 | $3,250 | $1.72 | 9d | 1 | 0.25mi |
| 9831 NW 24th St Unit 9831 Sunrise, FL | 3.0 | 2.5 | 1887 | $3,500 | $1.85 | 26d | 1 | 0.25mi |
| 9970 NW 19th Pl Sunrise, FL | 3.0 | 2.5 | 1727 | $3,199 | $1.85 | 26d | 1 | 0.26mi |
| 9151 W Sunrise Blvd #9151 Plantation, FL | 3.0 | 2.0 | 1482 | $2,750 | $1.86 | 26d | 1 | 0.36mi |
| 2440 NW 99th Way Sunrise, FL | 3.0 | 2.5 | 1887 | $3,495 | $1.85 | 18d | 1 | 0.38mi |
| 9521 NW 25th St Sunrise, FL | 3.0 | 2.0 | 1616 | $2,935 | $1.82 | 0d | 1 | 0.39mi |
| 8811 W Sunrise Blvd #8811 Plantation, FL | 3.0 | 3.0 | 1457 | $3,450 | $2.37 | 0d | 1 | 0.48mi |
| 9015 W Sunrise Blvd Plantation, FL | 3.0 | 3.0 | 1318 | $3,200 | $2.43 | 14d | 1 | 0.50mi |
| 2920 NW 99th Ter Sunrise, FL | 3.0 | 2.5 | 1680 | $4,800 | $2.86 | 26d | 1 | 0.80mi |
| 1066 NW 97th Ave Plantation, FL | 4.0 | 2.0 | 2432 | $4,650 | $1.91 | 0d | 1 | 0.86mi |
| 8690 NW 24th Pl Sunrise, FL | 4.0 | 2.0 | 1360 | $4,000 | $2.94 | 26d | 1 | 0.86mi |
| 10784 NW 23rd Ct Sunrise, FL | 3.0 | 2.0 | 1430 | $3,150 | $2.20 | 13d | 1 | 0.88mi |
| 9090 NW 11th Ct Plantation, FL | 3.0 | 2.0 | 2112 | $5,000 | $2.37 | 22d | 1 | 0.88mi |
| 10731 NW 16th Ct Plantation, FL | 4.0 | 2.0 | 2060 | $3,900 | $1.89 | 26d | 1 | 0.94mi |
| 10731 NW 16th Ct Plantation, FL | 4.0 | 2.0 | 2060 | $3,900 | $1.89 | 9d | 1 | 0.94mi |
| 10731 NW 16th Ct Plantation, FL | 4.0 | 2.0 | 2060 | $3,800 | $1.84 | 5d | 1 | 0.94mi |
| 10691 NW 28th St Sunrise, FL | 4.0 | 2.0 | 1438 | $4,500 | $3.13 | 19d | 1 | 0.97mi |
| 10691 NW 28th St Sunrise, FL | 4.0 | 2.0 | 1603 | $4,500 | $2.81 | 26d | 1 | 0.97mi |
| 10900 NW 17th St Plantation, FL | 1.0–3.0 | 1.0–2.5 | 1270 | $2,950 | $2.32 | 0d | 19 | 0.98mi |
| 10900 NW 18th Ct Plantation, FL | 4.0 | 3.0 | 1984 | $4,800 | $2.42 | 18d | 1 | 1.00mi |
| 3160 NW 101st Ave Sunrise, FL | 3.0 | 2.0 | 1780 | $4,000 | $2.25 | 26d | 1 | 1.04mi |
| 8460 NW 21st St Sunrise, FL | 3.0 | 2.0 | 1520 | $4,000 | $2.63 | 23d | 1 | 1.08mi |
| 8460 NW 21st St Sunrise, FL | 3.0 | 2.0 | 1520 | $4,000 | $2.63 | 13d | 1 | 1.08mi |
| 9841 NW 9th Ct Plantation, FL | 3.0 | 2.5 | 1516 | $3,800 | $2.51 | 26d | 1 | 1.10mi |
| 8421 NW 21st Ct Sunrise, FL | 3.0 | 2.0 | 1915 | $3,250 | $1.70 | 12d | 1 | 1.11mi |
| 9581 NW 9th Ct Plantation, FL | 4.0 | 2.5 | 2005 | $5,400 | $2.69 | 26d | 1 | 1.11mi |
| 9812 NW 9th Ct Plantation, FL | 3.0 | 2.5 | 1516 | $3,500 | $2.31 | 5d | 1 | 1.11mi |
| 10271 NW 10th Ct Plantation, FL | 4.0 | 3.0 | 2505 | $4,199 | $1.68 | 18d | 1 | 1.11mi |
| 8401 NW 20th Ct Sunrise, FL | 3.0 | 2.0 | 1580 | $4,300 | $2.72 | 26d | 1 | 1.12mi |
| 8401 NW 20th Ct Sunrise, FL | 3.0 | 2.0 | 1580 | $4,000 | $2.53 | 9d | 1 | 1.12mi |
| 11100 NW 21st St Sunrise, FL | 4.0 | 3.0 | 1529 | $4,000 | $2.62 | 26d | 1 | 1.12mi |
| 10900 NW 28th St Sunrise, FL | 4.0 | 2.0 | 1459 | $4,250 | $2.91 | 26d | 1 | 1.13mi |
| 9832 NW 9th Ct Plantation, FL | 3.0 | 2.5 | 1473 | $3,450 | $2.34 | 23d | 1 | 1.13mi |
Listing history 5 events
-
2025-08-27status Pending
-
2025-08-11$415,000 Active
-
2017-07-12soldstatus $310,000
-
1993-07-21soldstatus $110,000
-
1977-04-01soldstatus $49,000
ⓘ Source: listings_history table (triggers on properties + properties_extension) + one-shot
backfill from property_details.listing_events for pre-trigger history.
Tax reassessment forecast FL · Resets to sale price
- Current annual tax
- $6,850 · $571/mo
- Projected year-2 tax
- $6,850 · $571/mo
- Expected delta
- $0/yr ($0/mo · 0.0%)
ⓘ Screening estimate from a state-policy table — verify with the county assessor before closing.
Climate risk First Street
- Flood 1/10 Low FEMA zone X (shaded) · 0% chance over 30 yrs
- Wildfire 1/10 Low
- Heat 9/10 Extreme 4 d/yr ≥106°F today · 15 d/yr by 30 yrs out
- Wind 10/10 Extreme 99% chance of damaging wind over 30 yrs
- Air quality 3/10 Moderate 2 unhealthy d/yr today · 3 by 30 yrs out
Nearby sold comps map
Loading sold comps map…
Walkable amenities ~0.75 mi
Loading nearby amenities…
Taxation est. · year 1
- Rental income
- $44,890
- − Mortgage interest
- −$23,246
- − Property taxes
- −$6,850
- − Insurance
- −$2,075
- − Repairs & maintenance
- −$3,591
- − Management
- −$3,591
- − Depreciation
- −$12,073
- Taxable loss
- −$6,536
- Est. tax savings @ 24.0%
- +$1,569
- After-tax cash flow
- $1,991/yr
For passive investors: Depreciation is non-cash, so a rental often shows a tax loss while cash-flowing — sheltering income. Rental losses are passive: they offset passive income freely, and up to $25,000/yr can offset ordinary (W-2) income if you actively participate and your MAGI is under $100k (phasing out to $0 by $150k); unused losses carry forward. On sale, claimed depreciation is recaptured at up to 25%, and gains may owe capital-gains tax (a 1031 exchange can defer both). Figures are a year-1 estimate at your 24.0% rate — not tax advice; consult a CPA.
Schools (NCES district)
- District
- Broward
- NCES district ID
- 1200180
- Math proficiency
- 42% ▼ -18.00%
- Reading proficiency
- 53% ▼ -5.00%
- Median HH income
- $52,139
- Composite
- 40.88/100
- National rank
- #3621
- State rank
- #46 of 73 in FL
Livability — Sunrise
- Score
- 83/100
- State rank
- #56
- US rank
- #986
Category grades
Schools grade is shown separately in the Schools card above.
Census & demographics
- Census place
- Sunrise, FL
- County
- Broward County · 1,963,430 people
- City population
- 77,492
- Metro
- Miami-Fort Lauderdale-Pompano Beach, FL
- Population (ZIP)
- 41,128
- Household income
- $71,755
- Rent vs Own
- Severe rent burden
- 931.0
Population outlook (Broward County) Hauer SSP2
- Today (2025)
- 2,207,033 people
- By 2030
- 2,360,704 · +7.0%
- By 2040
- 2,661,208 · +20.6%
- By 2050
- 2,946,698 · +33.5%
- By 2075
- 3,602,273 · +63.2%
- By 2100
- 3,970,984 · +79.9%
Race, ethnicity, and origin ACS 2023
- Neighborhood character
- Highly diverse neighborhood (Simpson 0.72)
- Race & ethnicity
- Hispanic / Latino 35% White 32% Black 24% Two or more races 22% Asian 4%
- Hispanic origin (detail)
- Puerto Rican 5% Cuban 6% Dominican 2% Salvadoran 1%
- Common ancestry
- Hispanic 5% Romanian 2% Scotch-Irish 2%
- Foreign-born
- 41% · Canada, Jamaica, South Korea
- Languages at home
- 58% English-only · Spanish 30% French/Haitian/Cajun 6% Other Indo-European 1%
Political lean MEDSL · Broward
- 2024 margin
- D (+17.0) · D 58.0% · R 41.0%
- 2008→2024 swing
- -17.8pp toward R · 2008: 34.7pp · 2024: 17.0pp
- All cycles
- 2024: D+17.0 2020: D+29.8 2016: D+35.0 2012: D+34.9 2008: D+34.7
Not yet ingested
- Civics
- —
Market trends
- HPI YoY
- ▼ -203.34%
- Current HPI
- 407.5452
- Rent YoY
- ▲ 0.60%
- Metro
- Miami-Fort Lauderdale-Pompano Beach, FL
- State GDP YoY
- ▲ 3.28%
- F500 in state
- 36
Industry mix (Fortune 500 HQ in FL)
| Industry | F500 HQs | Revenue |
|---|---|---|
| Industrial Technology | 2 | $29B |
|
||
| Insurance | 2 | $17B |
|
||
| Retail | 1 | $60B |
|
||
| Technology Distribution | 1 | $58B |
|
||
| Homebuilding | 1 | $35B |
|
||
| Technology Manufacturing | 1 | $35B |
|
||
Price history
+746.9% since first listed5 events — show timeline
- 2025-08-27 Pending — MARMLS
- 2025-08-11 Listed $415,000 MARMLS
- 2017-07-12 Sold (Public Records) $310,000 Public Records
- 1993-07-21 Sold (Public Records) $110,000 Public Records
- 1977-04-01 Sold (Public Records) $49,000 Public Records
Property tax history
+9.3%/yrLatest (2025): $6,850 · +3.0% YoY. Source: county tax records.
Cash-flow waterfall
monthlySold comps — $/sqft
last 12 mo · ≤1 miLoading sold comps…