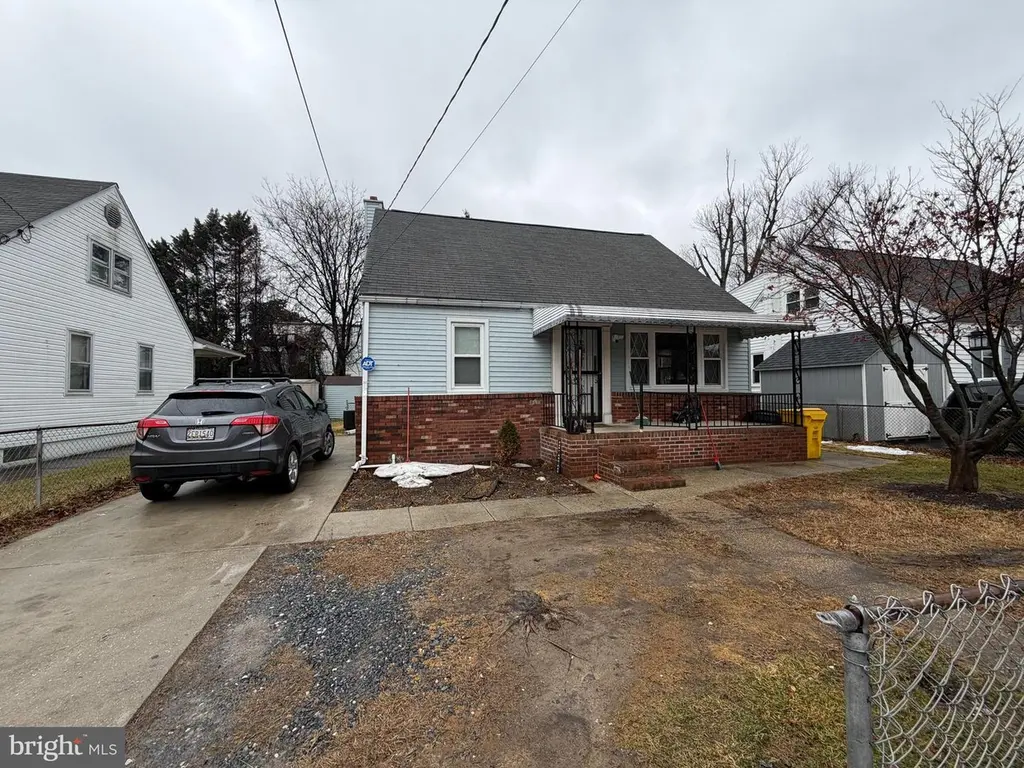
103 Vista Ave · Ferndale, MD
Flood risk 8/10 · Major
- FEMA flood zone
- X (unshaded)
- Chance of flooding over 30 yrs
- 0.99%
- Est. flood insurance / yr
- $473 – $860
Fire risk 1/10 · Minimal
- Est. fire insurance / yr
- $755 – $1,403
Heat risk 8/10 · Major
- Hot days now (above 104°F)
- 7 days/yr
- Hot days in 30 yrs
- 15 days/yr
Wind risk 6/10 · Moderate
- Chance of severe wind over 30 yrs
- 27.0%
Air-quality risk 4/10 · Minor
- Unhealthy air days now
- 5 days/yr
- Unhealthy air days in 30 yrs
- 7 days/yr
Risk factors via First Street. Map © Google.
Why this score? — see what drove the C- grade
The composite is a weighted blend of 9 inputs, each scored 0–100. Each bar is that input's sub-score; the figure is the points it added to the 100-point composite (weight × sub-score).
- Cash flow +15.1/30.0
- ARV discount +15.0/15.0
- DSCR +4.6/10.0
- 1% rule +3.8/10.0
- Livability +3.7/5.0
- Rent growth +3.5/5.0
- Schools +2.9/10.0
- Condition / age +2.5/5.0
- Appreciation +0.0/10.0
$300,000
🖨 Deal sheet (PDF) 📄 Offer letter ✓ Due diligence
Key facts
- 5,500 sq ft lot
- Built 1955
- Listed 24 days
Neighborhood map
What this means for you Summary
Snapshot
- This is a 4-bed/1.5-bath single-family listed at $300k.
Deal economics
- At list price, monthly cash flow is $41 ($488/yr) — positive.
- The deal already cash-flows at list — no discount required.
- To meet the 1% rule (rent ≥ 1% of price), the offer needs to be $265k (11.7% below list).
- Recommended offer: $265k (11.7% below list) — sets the bar for 1% rule.
- Cap rate 6.7% vs local median 4.5% in Ferndale — top-decile yield for the area; either an underpriced asset or a hidden risk that comps aren't pricing in. Stress-test before assuming the spread holds.
Location & tenants
- Location reads 73/100 on livability (#128 in MD) — a middle-class / working-renter tenant base. Strengths: commute A+, housing A+, employment A; Watch: cost of living C-, crime F, amenities F.
- Anne Arundel County Public Schools (suburban): math 20% / reading 37% proficiency, ranked #10 of 24 in MD (top 42%) — low school quality limits family demand, transient renter base, plan for 1-2y turnover.
- Zoned schools: Monarch Global Academy Pcs Laurel Campus (math 13% / reading 28%, grade F, #341 of 860 statewide, top 40%, 830 students, 53% FRL); Lindale Middle (math 9% / reading 35%, grade F, #125 of 225 statewide, top 58%, 1,178 students, 59% FRL); North County High (math 33% / reading 58%, grade D-, #121 of 222 statewide, top 55%, 2,451 students, 63% FRL) — zoned schools average 58% FRL vs 25% district-wide (33 pts higher); higher-poverty schools than district average — tighter screening recommended.
- Market conditions: Rents rising (+3.9%/yr); 142 active listings in the ZIP; 13 comparable units currently listed for rent nearby; rentals at typical pace (median 20d on market — plan ~3-4 weeks tenant-placement turnaround); solid renter incomes; 1,303 units permitted in Anne Arundel County in 2024 (299 in 5+ unit buildings).
- This rent runs 36% of the median local income ($88k/yr) — at the standard rent-burdened threshold; future hikes will face affordability resistance.
Forward outlook
- Local home prices are declining (-3.0%/yr); year-one equity from $2k of loan paydown is wiped out by about $9k of value loss. Plan a longer hold.
- Anne Arundel County population projected at +17% by 2050 — long-run rental-demand tailwind backs the buy-and-hold thesis.
Negotiation context
- It's been on market 24 days — a 2% lower offer ($296k) is reasonable based on typical stale-listing flexibility.
- 4 sale attempts since 3y ago with the ask held roughly flat each time — persistent listings suggest the price (not the market) is what's stuck; bring a comps-based counter.
Risks & watch-outs
- Watch-outs: flood insurance adds $56/mo; built in 1955 — expect roof / HVAC / electrical / plumbing capex.
- Climate carrying-cost: severe flood risk; major wind risk, 27% chance of damaging wind over 30y; extreme-heat days projected 7→15/yr by 2055 (HVAC capex compounding) — expect insurance premiums to compound above CPI over the hold.
Questions for the listing agent
- Built in 1955 — when were the roof, HVAC, electrical panel, plumbing, and water heater last replaced?
- What's the actual annual flood-insurance premium (NFIP or private), and is the property in a SFHA with mandatory coverage?
- Is there a deadline driving the sale (1031 exchange, divorce, estate, relocation)? That informs how much negotiation room exists.
- Schools are B-rated — typically a magnet for longer-tenancy family renters. What's the average tenant stay here, and is there a school-zone premium baked into asking?
- Crime grade is F in this area — have there been break-ins, vandalism, or insurance claims at this property in the last 3 years? What carrier currently insures it and at what premium?
- What's the average days-on-market for RENTAL listings here right now (not sales)? A rising rental-DOM trend means longer vacancies and softer asking-rent achievability than the comps imply.
- What's the recent tenant-quality profile in this submarket — average credit score on applications, eviction rate, late-payment / NSF rate, and stable-employment percentage? A property-management company in the area should have these aggregated.
- How much new for-sale + rental construction is in the pipeline within 1–3 miles? Heavy new supply typically softens prices + rents 12–24 months out; constrained supply supports both.
Investment metrics
- 1% rule
- 0.88% ✗
- Cap rate
- 6.68%
- Cash-on-cash
- 1.37%
- DSCR
- 1.06
- GRM
- 9.4
CMA / ARV
- ARV (on-the-fly)
- $407,160
- Comps found
- 12
Show comp detail 12 sales within ~0.75 mi
| Address | Dist | Beds/Ba | Sqft | Sold | Price | $/sf | Match |
|---|---|---|---|---|---|---|---|
| 104 Baltimore Ave | 0.09mi | 4/2.0 | 1,612 (+3%) | 3mo | $315,000 | $195 | 86 |
| 402 Glenmont Ave | 0.27mi | 5/2.0 (+1) | 1,710 (+9%) | 1mo | $416,000 | $243 | 64 |
| 1463 Gordon Dr | 0.47mi | 4/2.0 | 1,466 (-6%) | 2mo | $457,000 | $312 | 64 |
| 1628 Pleasantville Dr | 0.51mi | 3/1.5 (-1) | 1,496 (-4%) | 2mo | $405,000 | $271 | 62 |
| 1531 Tieman Dr | 0.53mi | 4/2.0 | 1,680 (+7%) | 2mo | $372,000 | $221 | 60 |
| 205 Wicklow Rd | 0.65mi | 3/2.0 (-1) | 1,525 (-3%) | 3mo | $458,000 | $300 | 56 |
| 804 Bentwillow Dr | 0.53mi | 3/2.0 (-1) | 1,696 (+8%) | 0mo | $385,000 | $227 | 54 |
| 1420 Rowe Dr | 0.47mi | 3/1.0 (-1) | 1,416 (-10%) | 2mo | $365,000 | $258 | 53 |
| 3 Belvedere Ave | 0.59mi | 3/3.0 (-1) | 1,440 (-8%) | 1mo | $470,000 | $326 | 47 |
| 819 Bentwillow Dr | 0.52mi | 3/1.0 (-1) | 1,346 (-14%) | 0mo | $350,000 | $260 | 45 |
| 1633 Tieman Dr | 0.60mi | 3/1.0 (-1) | 1,344 (-14%) | 1mo | $360,000 | $268 | 41 |
| 216 Allwood Dr | 0.74mi | 4/3.0 | 1,786 (+14%) | 1mo | $445,000 | $249 | 35 |
Match score weights: distance 35% · size 25% · config 20% · recency 20%. Top-matched comps best support the ARV.
Projected returns pro-forma
-3.0% appreciation · 3.87% rent growth · sell at horizon
- IRR
- -14.4%
- Equity multiple
- 0.48×
- Total profit
- $-43,657
- Equity at exit
- $44,731
- IRR
- -4.3%
- Equity multiple
- 0.70×
- Total profit
- $-24,801
- Equity at exit
- $25,939
Cash invested: $84,000 (down + closing). Projections, not guarantees.
Landlord ↔ Tenant lean methodology
- Overall (STATE)
- 27 Tenant-Leaning
- State Maryland
- 27 Tenant-Leaning · D+14
- County
- — inherits STATE
- City
- — inherits STATE
ZIP-level market 21061
- Rents YoY
- 3.9%
- Active inventory
- 142
- Price-to-rent
- 9.4×
Monthly cashflow live
- Estimated rent
- $2,649 high interval (Pro) →
- Mortgage (P&I)
- −$1,573
- Tax from tax record
- −$298 /mo · $3,581/yr
- Insurance
- −$125
- Flood insurance flood zone
- −$56 /mo · $666/yr
- HOA
- −$0
- Vacancy / Maint / Mgmt
- −$556
- Net cashflow
- $41
Break-even live
Sensitivity live
| Price | -10% $210 | -5% $126 | +0% $41 | +5% $-44 | +10% $-129 |
|---|---|---|---|---|---|
| Rent | -10% $-169 | -5% $-64 | +0% $41 | +5% $145 | +10% $250 |
| Rate | -1.0pp $192 | -0.5pp $117 | base $41 | +0.5pp $-37 | +1.0pp $-116 |
UW: 25.0% down · 7.5% · 30yr · 1.5% tax · 5.0% vac · 8.0% maint · 8.0% mgmt
Financing live
Cash to close
- Down payment
- $75,000
- Closing costs
- $9,000
- Reserves months
- —
- Total cash needed
- —
Loan-product check · same deal, 3 products live
Conventional
25% down · 7.5% · 30yr
- Down + closing
- —
- Monthly P&I
- —
- Monthly cashflow
- —
- DSCR
- —
- Eligible?
- —
Personal DTI + credit; lowest rate.
DSCR
20% down · 8.5% · 30yr
- Down + closing
- —
- Monthly P&I
- —
- Monthly cashflow
- —
- DSCR
- —
- Eligible?
- —
No personal income docs; deal must DSCR.
Hard money
10% down · 12.0% · 12mo
- Down + closing
- —
- Monthly P&I
- —
- Monthly cashflow
- —
- DSCR
- —
- Eligible?
- —
Short-term bridge; refi at stabilization.
Rent comps 13 comps
| Address | Beds | Baths | Sqft | Rent | $/sqft | DOM | Units | Dist |
|---|---|---|---|---|---|---|---|---|
| 105 Dinsmore Ave Glen Burnie, MD | 3.0 | 2.5 | 1731 | $2,800 | $1.62 | 19d | 1 | 0.13mi |
| 1515 Baby Baer Ct Glen Burnie, MD | 4.0 | 3.0 | 1900 | $3,550 | $1.87 | 45d | 1 | 0.31mi |
| 1407 Gordon Dr Glen Burnie, MD | 3.0 | 2.0 | 1404 | $2,750 | $1.96 | 25d | 1 | 0.49mi |
| 323 Lindera Ct Glen Burnie, MD | 4.0 | 2.5 | 1240 | $2,200 | $1.77 | 19d | 1 | 0.81mi |
| 906 Rosedale Ave Glen Burnie, MD | 3.0 | 2.0 | 1128 | $3,000 | $2.66 | 3d | 1 | 0.86mi |
| 220 Poplar Ave Glen Burnie, MD | 3.0 | 1.0 | 1512 | $2,250 | $1.49 | 19d | 1 | 0.90mi |
| 6455 Heritage Hill Dr Glen Burnie, MD | 3.0 | 1.5 | 1152 | $1,700 | $1.48 | 5d | 1 | 1.13mi |
| 6401 Jefferson Pl Glen Burnie, MD | 3.0 | 1.5 | 1216 | $1,895 | $1.56 | 4d | 1 | 1.20mi |
| 101 S Charter Rd Glen Burnie, MD | 1.0–3.0 | 1.0–2.0 | 823 | $1,845 | $2.24 | 0d | 1 | 1.21mi |
| 6456 Washington Sq Glen Burnie, MD | 3.0 | 1.5 | 1216 | $1,799 | $1.48 | 23d | 1 | 1.22mi |
| 6449 Union Ct Glen Burnie, MD | 3.0 | 1.5 | 1152 | $2,200 | $1.91 | 45d | 1 | 1.25mi |
| 6319 Harris Heights Ave Glen Burnie, MD | 3.0 | 1.5 | 1280 | $2,200 | $1.72 | 25d | 1 | 1.26mi |
| 1 Brownshade Dr Glen Burnie, MD | 3.0 | 1.0 | 2085 | $2,900 | $1.39 | 25d | 1 | 1.28mi |
Listing history 15 events
-
2026-04-16status Pending
-
2026-03-23$300,000 Active
-
2026-02-14historical
-
2026-01-15price $330,000
-
2025-11-06$345,000 Active
-
2025-11-03historical
-
2025-04-10historical
-
2025-03-26$345,000 Active
-
2024-01-30soldstatus $300,000
-
2024-01-24soldstatus $300,000 Closed
-
2024-01-11status Pending
-
2023-12-24historical Active Under Contract
-
2023-12-20$300,000 Active
-
2023-12-17historical $300,000
-
2016-10-06soldstatus $120,000
ⓘ Source: listings_history table (triggers on properties + properties_extension) + one-shot
backfill from property_details.listing_events for pre-trigger history.
Tax reassessment forecast MD · Partial reset (capped growth)
- Current annual tax
- $3,581 · $298/mo
- Projected year-2 tax
- $3,581 · $298/mo
- Expected delta
- $0/yr ($0/mo · 0.0%)
ⓘ Screening estimate from a state-policy table — verify with the county assessor before closing.
Climate risk First Street
- Flood 8/10 Severe FEMA zone X (unshaded) · 99% chance over 30 yrs
- Wildfire 1/10 Low
- Heat 8/10 Severe 7 d/yr ≥104°F today · 15 d/yr by 30 yrs out
- Wind 6/10 Major 27% chance of damaging wind over 30 yrs
- Air quality 4/10 Moderate 5 unhealthy d/yr today · 7 by 30 yrs out
Nearby sold comps map
Loading sold comps map…
Walkable amenities ~0.75 mi
Loading nearby amenities…
Taxation est. · year 1
- Rental income
- $31,791
- − Mortgage interest
- −$16,805
- − Property taxes
- −$3,581
- − Insurance
- −$2,166
- − Repairs & maintenance
- −$2,543
- − Management
- −$2,543
- − Depreciation
- −$8,727
- Taxable loss
- −$4,576
- Est. tax savings @ 24.0%
- +$1,098
- After-tax cash flow
- $1,586/yr
For passive investors: Depreciation is non-cash, so a rental often shows a tax loss while cash-flowing — sheltering income. Rental losses are passive: they offset passive income freely, and up to $25,000/yr can offset ordinary (W-2) income if you actively participate and your MAGI is under $100k (phasing out to $0 by $150k); unused losses carry forward. On sale, claimed depreciation is recaptured at up to 25%, and gains may owe capital-gains tax (a 1031 exchange can defer both). Figures are a year-1 estimate at your 24.0% rate — not tax advice; consult a CPA.
Schools (NCES district)
- District
- Anne Arundel County Public Schools
- NCES district ID
- 2400060
- Math proficiency
- 20% ▼ -21.00%
- Reading proficiency
- 37% ▼ -13.00%
- Median HH income
- $87,880
- Composite
- 28.52/100
- National rank
- #6733
- State rank
- #10 of 24 in MD
Livability — Ferndale
- Score
- 73/100
- State rank
- #128
- US rank
- #5483
Category grades
Schools grade is shown separately in the Schools card above.
Census & demographics
- Census place
- Ferndale, MD
- County
- Anne Arundel County · 535,653 people
- Metro
- Baltimore-Columbia-Towson, MD
- Population (ZIP)
- 57,230
- Household income
- $87,751
- Rent vs Own
- Severe rent burden
- 2134.0
Population outlook (Anne Arundel County) Hauer SSP2
- Today (2025)
- 617,384 people
- By 2030
- 642,094 · +4.0%
- By 2040
- 686,621 · +11.2%
- By 2050
- 723,031 · +17.1%
- By 2075
- 809,346 · +31.1%
- By 2100
- 837,658 · +35.7%
Race, ethnicity, and origin ACS 2023
- Neighborhood character
- Diverse neighborhood (Simpson 0.67)
- Race & ethnicity
- White 50% Black 26% Hispanic / Latino 11% Two or more races 10% Asian 4%
- Hispanic origin (detail)
- Mexican 2% Puerto Rican 1%
- Common ancestry
- Romanian 3% Lithuanian 1% Slovak 1%
- Foreign-born
- 12% · Canada, Dominican Republic
- Languages at home
- 84% English-only · Spanish 9% Tagalog/Filipino 2% Other Indo-European 2%
Political lean MEDSL · Anne Arundel
- 2024 margin
- D (+13.9) · D 55.7% · R 41.7% · Other 2.6%
- 2008→2024 swing
- +15.7pp toward D · 2008: -1.8pp · 2024: 13.9pp
- All cycles
- 2024: D+13.9 2020: D+14.5 2016: D+0.7 2012: R+0.9 2008: R+1.8
Not yet ingested
- Civics
- —
Market trends
- HPI YoY
- ▼ -341.00%
- Current HPI
- 300.196
- Rent YoY
- ▲ 3.87%
- Metro
- Baltimore-Columbia-Towson, MD
- State GDP YoY
- ▲ 2.97%
- F500 in state
- 12
Industry mix (Fortune 500 HQ in MD)
| Industry | F500 HQs | Revenue |
|---|---|---|
| Aerospace / Defense | 1 | $71B |
|
||
| Utilities | 1 | $25B |
|
||
| Hotels | 1 | $24B |
|
||
| Consumer Goods | 1 | $7B |
|
||
| Real Estate | 1 | $6B |
|
||
| Chemicals | 1 | $2B |
|
||
Price history
+150.0% since first listed15 events — show timeline
- 2026-04-16 Pending — BRIGHT MLS
- 2026-03-23 Listed $300,000 BRIGHT MLS
- 2026-02-14 Listing Removed — BRIGHT MLS
- 2026-01-15 Price Changed $330,000 BRIGHT MLS
- 2025-11-06 Listed $345,000 BRIGHT MLS
- 2025-11-03 Coming Soon — BRIGHT MLS
- 2025-04-10 Listing Removed — BRIGHT MLS
- 2025-03-26 Listed $345,000 BRIGHT MLS
- 2024-01-30 Sold (Public Records) $300,000 Public Records
- 2024-01-24 Sold (MLS) $300,000 BRIGHT MLS
- 2024-01-11 Pending — BRIGHT MLS
- 2023-12-24 Contingent — BRIGHT MLS
- 2023-12-20 Listed $300,000 BRIGHT MLS
- 2023-12-17 Coming Soon $300,000 BRIGHT MLS
- 2016-10-06 Sold (Public Records) $120,000 Public Records
Property tax history
+6.4%/yrLatest (2025): $3,581 · +4.6% YoY. Source: county tax records.
Cash-flow waterfall
monthlySold comps — $/sqft
last 12 mo · ≤1 miLoading sold comps…