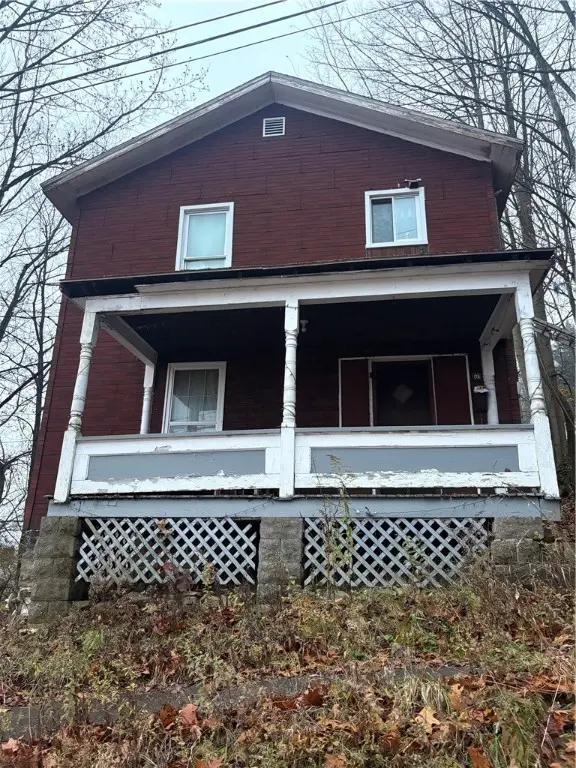
621 Hillside Ave · Franklin, PA
Flood risk 1/10 · Minimal
- FEMA flood zone
- X (unshaded)
- Chance of flooding over 30 yrs
- 0.0%
- Est. flood insurance / yr
- $473 – $860
Fire risk 3/10 · Minor
- Est. fire insurance / yr
- $511 – $949
Heat risk 3/10 · Minor
- Hot days now (above 93°F)
- 8 days/yr
- Hot days in 30 yrs
- 19 days/yr
Wind risk 1/10 · Minimal
- Chance of severe wind over 30 yrs
- —
Air-quality risk 2/10 · Minimal
- Unhealthy air days now
- 1 days/yr
- Unhealthy air days in 30 yrs
- 2 days/yr
Risk factors via First Street. Map © Google.
Why this score? — see what drove the C- grade
The composite is a weighted blend of 9 inputs, each scored 0–100. Each bar is that input's sub-score; the figure is the points it added to the 100-point composite (weight × sub-score).
- Cash flow +15.0/30.0
- Appreciation +10.0/10.0
- ARV discount +7.5/15.0
- 1% rule +5.0/10.0
- DSCR +5.0/10.0
- Livability +3.5/5.0
- Schools +3.2/10.0
- Rent growth +2.5/5.0
- Condition / age +2.5/5.0
$25,000
🖨 Deal sheet 📄 Offer letter ✓ Due diligence
Listing remarks MLS
4-Bedroom Home – Perfect for Investors. Discover the potential in this spacious 4-bedroom, 1.5-bath home located close to walking trails, parks, and a variety of local amenities. Whether you're looking for your next investment opportunity or searching for the ideal handyperson special. With its flexible layout this home could easily become a great investment or short-term rental.
Key facts
- Outdoor recreation
- Flexible layout
- Local amenities
Tags
Neighborhood map
What this means for you Summary
Snapshot
- This is a 4-bed/1.5-bath single-family listed at $25k.
Deal economics
- At list price, monthly cash flow is $657 ($8k/yr) — positive.
- The deal already cash-flows at list — no discount required.
- Meets the 1% rule at list price ($1k rent vs $25k).
- Recommended offer: $22k (12.0% below list) — sets the bar for market timing.
- Cap rate 37.8% vs local median 4.8% in Franklin — top-decile yield for the area; either an underpriced asset or a hidden risk that comps aren't pricing in. Stress-test before assuming the spread holds.
Location & tenants
- Location reads 69/100 on livability (#812 in PA) — a middle-class / working-renter tenant base. Strengths: cost of living A+, housing A+, crime B+; Watch: health & safety C-, schools D, employment D.
- Franklin Area SD (rural): math 29% / reading 46% proficiency, ranked #388 of 539 in PA (top 72%) — families likely to look elsewhere, expect single-tenant / working-renter base with shorter leases.
- Market conditions: 51 active listings in the ZIP; 2 comparable units currently listed for rent nearby; 42 units permitted in Venango County in 2024 (0 in 5+ unit buildings).
Forward outlook
- In year one you build about $3k of equity ($173 loan paydown + $2k appreciation (10.0% local appreciation)).
- Venango County population projected at -30% by 2050 — secular population decline; favor cash flow + early exit over multi-decade hold.
- At projected returns (10.0% appreciation + 3.0% rent growth), your $7k cash investment doubles in ~1 year — after that, you're playing with house money.
- By year 10, paydown + projected appreciation supports a ~$32k cash-out refi (75% LTV) — recoverable capital for the next deal without selling this one.
Negotiation context
- It's been on market 212 days — a 12% lower offer ($22k) is reasonable based on typical stale-listing flexibility.
Risks & watch-outs
- Watch-outs: built in 1925 — expect roof / HVAC / electrical / plumbing capex.
Questions for the listing agent
- It's been on market 212 days. Have you received any prior offers? Is the seller open to a 12% concession, seller financing, or rate buy-down credit?
- Built in 1925 — when were the roof, HVAC, electrical panel, plumbing, and water heater last replaced?
- Why hasn't it sold? Are there any deal-killer items the seller is aware of (foundation, flood, title, zoning, code violations)?
- Is there a deadline driving the sale (1031 exchange, divorce, estate, relocation)? That informs how much negotiation room exists.
- Schools are D-rated, which usually means shorter tenancies and higher turnover. Who's the typical renter profile here, and what's been the actual vacancy rate?
- What's the average days-on-market for RENTAL listings here right now (not sales)? A rising rental-DOM trend means longer vacancies and softer asking-rent achievability than the comps imply.
- What's the recent tenant-quality profile in this submarket — average credit score on applications, eviction rate, late-payment / NSF rate, and stable-employment percentage? A property-management company in the area should have these aggregated.
- How much new for-sale + rental construction is in the pipeline within 1–3 miles? Heavy new supply typically softens prices + rents 12–24 months out; constrained supply supports both.
Investment metrics
- 1% rule
- 4.20% ✓
- Cap rate
- 37.82%
- Cash-on-cash
- 112.58%
- DSCR
- 6.01
- GRM
- 2.0
CMA / ARV
- ARV (median comp)
- $93,909
- List price
- $25,000
- Delta
- -73.38%
- Verdict
- UNDERPRICED
- Comps
- 20 within 1.0 mi
Show comp detail 12 sales within ~0.75 mi
| Address | Dist | Beds/Ba | Sqft | Sold | Price | $/sf | Match |
|---|---|---|---|---|---|---|---|
| 750 15th St | 0.47mi | 3/1.0 (-1) | 1,536 (-2%) | 3mo | $15,000 | $10 | 65 |
| 523 15th St | 0.48mi | 4/1.0 | 1,548 (-1%) | 11mo | $94,000 | $61 | 64 |
| 1104 Chestnut St | 0.14mi | 3/1.5 (-1) | 1,680 (+7%) | 16mo | $157,000 | $93 | 63 |
| 640 Buffalo St | 0.46mi | 3/2.0 (-1) | 1,564 (-0%) | 15mo | $26,500 | $17 | 59 |
| 1541 Elk St | 0.68mi | 3/1.5 (-1) | 1,578 (+1%) | 4mo | $152,500 | $97 | 59 |
| 1316 Otter St | 0.56mi | 3/1.0 (-1) | 1,612 (+3%) | 11mo | $33,000 | $20 | 54 |
| 729 15th St | 0.43mi | 3/1.0 (-1) | 1,716 (+9%) | 5mo | $15,500 | $9 | 53 |
| 642 Buffalo St | 0.45mi | 3/1.5 (-1) | 1,358 (-13%) | 0mo | $79,900 | $59 | 52 |
| 1433 Chestnut St | 0.45mi | 4/1.5 | 1,772 (+13%) | 11mo | $47,000 | $27 | 48 |
| 1001 Elk St | 0.26mi | 3/2.0 (-1) | 1,792 (+14%) | 13mo | $180,000 | $100 | 47 |
| 611 12th St | 0.19mi | 3/1.0 (-1) | 1,344 (-14%) | 17mo | $119,900 | $89 | 46 |
| 645 Forest Ln | 0.75mi | 3/3.0 (-1) | 1,519 (-3%) | 8mo | $230,000 | $151 | 43 |
Match score weights: distance 35% · size 25% · config 20% · recency 20%. Top-matched comps best support the ARV.
Projected returns pro-forma
10.0% appreciation · 3.0% rent growth · sell at horizon
- IRR
- —
- Equity multiple
- 8.92×
- Total profit
- $55,459
- Equity at exit
- $22,522
- IRR
- —
- Equity multiple
- 19.64×
- Total profit
- $130,456
- Equity at exit
- $48,570
Cash invested: $7,000 (down + closing). Projections, not guarantees.
Landlord ↔ Tenant lean methodology
- Overall (STATE)
- 62 Landlord-Friendly
- State Pennsylvania
- 62 Landlord-Friendly · EVEN
- County
- — inherits STATE
- City
- — inherits STATE
ZIP-level market 16323
- Home prices YoY
- 12.2%
- Active inventory
- 51
- Price-to-rent
- 2.0×
Monthly cashflow live
- Estimated rent
- $1,050 medium interval (Pro) →
- Mortgage (P&I)
- −$131
- Tax est. 1.5%
- −$31 /mo · $375/yr
- Insurance
- −$10
- HOA
- −$0
- Vacancy / Maint / Mgmt
- −$220
- Net cashflow
- $657
Break-even live
UW: 25.0% down · 7.5% · 30yr · 1.5% tax · 5.0% vac · 8.0% maint · 8.0% mgmt
Financing live
Cash to close
- Down payment
- $6,250
- Closing costs
- $750
- Reserves months
- —
- Total cash needed
- —
Loan-product check · same deal, 3 products live
Conventional
25% down · 7.5% · 30yr
- Down + closing
- —
- Monthly P&I
- —
- Monthly cashflow
- —
- DSCR
- —
- Eligible?
- —
Personal DTI + credit; lowest rate.
DSCR
20% down · 8.5% · 30yr
- Down + closing
- —
- Monthly P&I
- —
- Monthly cashflow
- —
- DSCR
- —
- Eligible?
- —
No personal income docs; deal must DSCR.
Hard money
10% down · 12.0% · 12mo
- Down + closing
- —
- Monthly P&I
- —
- Monthly cashflow
- —
- DSCR
- —
- Eligible?
- —
Short-term bridge; refi at stabilization.
Rent comps 2 comps
| Address | Beds | Baths | Sqft | Rent | $/sqft | DOM | Units | Dist |
|---|---|---|---|---|---|---|---|---|
| 1341 Sassafrass St Franklin, PA | 3.0 | 1.0 | 1300 | $1,050 | $0.81 | 44d | 1 | 0.31mi |
| 29 Bleakley Ave Franklin, PA | 4.0 | 1.0 | 1179 | $1,050 | $0.89 | 13d | 1 | 1.23mi |
Listing history 18 events
-
2026-06-19days on market $25,000 Active 212 DOM
-
2026-06-18days on market $25,000 Active 211 DOM
-
2026-06-17days on market $25,000 Active 210 DOM
-
2026-06-16days on market $25,000 Active 209 DOM
-
2026-06-15days on market $25,000 Active 208 DOM
-
2026-06-14days on market $25,000 Active 206 DOM
-
2026-06-13days on market $25,000 Active 205 DOM
-
2026-06-10days on market $25,000 Active 203 DOM
-
2026-06-09days on market $25,000 Active 202 DOM
-
2026-06-08days on market $25,000 Active 201 DOM
-
2026-06-07days on market $25,000 Active 200 DOM
-
2026-06-02days on market $25,000 Active 195 DOM
-
2026-06-01days on market $25,000 Active 194 DOM
-
2026-05-31days on market $25,000 Active 193 DOM
-
2026-05-30days on market $25,000 Active 192 DOM
-
2025-12-03price $25,000 388-char remark
Show marketing remark (388 chars)
4-Bedroom Home – Perfect for Investors. Discover the potential in this spacious 4-bedroom, 1.5-bath home located close to walking trails, parks, and a variety of local amenities. Whether you're looking for your next investment opportunity or searching for the ideal handyperson special. With its flexible layout this home could easily become a great investment or short-term rental.
-
2025-11-20price $30,000 388-char remark
Show marketing remark (388 chars)
4-Bedroom Home – Perfect for Investors. Discover the potential in this spacious 4-bedroom, 1.5-bath home located close to walking trails, parks, and a variety of local amenities. Whether you're looking for your next investment opportunity or searching for the ideal handyperson special. With its flexible layout this home could easily become a great investment or short-term rental.
-
2025-11-19$45,000 Active 388-char remark
Show marketing remark (388 chars)
4-Bedroom Home – Perfect for Investors. Discover the potential in this spacious 4-bedroom, 1.5-bath home located close to walking trails, parks, and a variety of local amenities. Whether you're looking for your next investment opportunity or searching for the ideal handyperson special. With its flexible layout this home could easily become a great investment or short-term rental.
ⓘ Source: listings_history table (triggers on properties + properties_extension) + one-shot
backfill from property_details.listing_events for pre-trigger history.
Climate risk First Street
- Flood 1/10 Low FEMA zone X (unshaded) · 0% chance over 30 yrs
- Wildfire 3/10 Moderate
- Heat 3/10 Moderate 8 d/yr ≥93°F today · 19 d/yr by 30 yrs out
- Wind 1/10 Low
- Air quality 2/10 Low 1 unhealthy d/yr today · 2 by 30 yrs out
Nearby sold comps map
Loading sold comps map…
Walkable amenities ~0.75 mi
Loading nearby amenities…
Taxation est. · year 1
- Rental income
- $12,600
- − Mortgage interest
- −$1,400
- − Property taxes
- −$375
- − Insurance
- −$125
- − Repairs & maintenance
- −$1,008
- − Management
- −$1,008
- − Depreciation
- −$727
- Taxable income
- $7,956
- Est. tax owed @ 24.0%
- −$1,910
- After-tax cash flow
- $5,971/yr
For passive investors: Depreciation is non-cash, so a rental often shows a tax loss while cash-flowing — sheltering income. Rental losses are passive: they offset passive income freely, and up to $25,000/yr can offset ordinary (W-2) income if you actively participate and your MAGI is under $100k (phasing out to $0 by $150k); unused losses carry forward. On sale, claimed depreciation is recaptured at up to 25%, and gains may owe capital-gains tax (a 1031 exchange can defer both). Figures are a year-1 estimate at your 24.0% rate — not tax advice; consult a CPA.
Schools (NCES district)
- District
- Franklin Area SD
- NCES district ID
- 4210200
- Math proficiency
- 29% ▼ -6.00%
- Reading proficiency
- 46% ▼ -12.00%
- Median HH income
- $43,451
- Composite
- 31.73/100
- National rank
- #5910
- State rank
- #388 of 539 in PA
Livability — Franklin
- Score
- 69/100
- State rank
- #812
- US rank
- #8260
Category grades
Schools grade is shown separately in the Schools card above.
Census & demographics
- Census place
- Franklin, PA
- Population (ZIP)
- 14,694
Population outlook (Venango County) Hauer SSP2
- Today (2025)
- 48,827 people
- By 2030
- 46,061 · -5.7%
- By 2040
- 39,989 · -18.1%
- By 2050
- 34,094 · -30.2%
- By 2075
- 22,500 · -53.9%
- By 2100
- 13,659 · -72.0%
Race, ethnicity, and origin ACS 2023
- Neighborhood character
- Predominantly White (92%)
- Race & ethnicity
- White 92% Two or more races 3% Black 2%
- Common ancestry
- Romanian 4% Iranian 3% Serbian 2%
- Foreign-born
- 1% · Canada
Political lean MEDSL · Venango
- 2024 margin
- Solid R (+42.1) · D 28.5% · R 70.6%
- 2008→2024 swing
- -22.9pp toward R · 2008: -19.2pp · 2024: -42.1pp
- All cycles
- 2024: R+42.1 2020: R+41.4 2016: R+42.4 2012: R+26.3 2008: R+19.2
Not yet ingested
- Civics
- —
Market trends
- HPI YoY
- ▲ 26.68%
- Current HPI
- 245.9766
- Rent YoY
- —
- Metro
- —
- State GDP YoY
- ▲ 1.68%
- F500 in state
- 34
Industry mix (Fortune 500 HQ in PA)
| Industry | F500 HQs | Revenue |
|---|---|---|
| Healthcare | 2 | $309B |
|
||
| Insurance | 2 | $27B |
|
||
| Telecommunications / Media | 1 | $124B |
|
||
| Industrial Distribution | 1 | $22B |
|
||
| Financial Services | 1 | $20B |
|
||
| Chemicals / Materials | 1 | $18B |
|
||
Price history
-44.4% since first listed3 events — show timeline
- 2025-12-03 Price Changed $25,000 West Penn MLS
- 2025-11-20 Price Changed $30,000 West Penn MLS
- 2025-11-19 Listed $45,000 West Penn MLS
Property tax history
-22.7%/yrLatest (2026): $27 · -95.4% YoY. Source: county tax records.
Cash-flow waterfall
monthlySold comps — $/sqft
last 12 mo · ≤1 miLoading sold comps…