 Fourplex
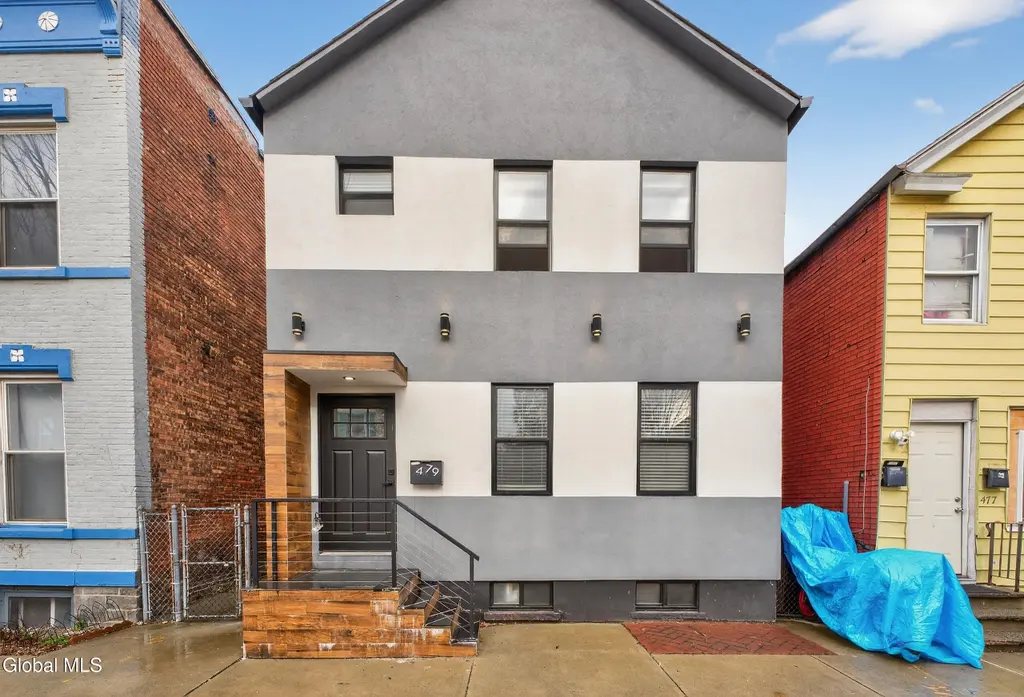
479 2nd St · Troy, NY
Flood risk 9/10 · Severe
- FEMA flood zone
- AE
- Chance of flooding over 30 yrs
- 0.99%
- Est. flood insurance / yr
- $1,737 – $8,500
Fire risk 3/10 · Minor
- Est. fire insurance / yr
- $691 – $1,283
Heat risk 4/10 · Minor
- Hot days now (above 96°F)
- 7 days/yr
- Hot days in 30 yrs
- 17 days/yr
Wind risk 3/10 · Minor
- Chance of severe wind over 30 yrs
- 6.0%
Air-quality risk 2/10 · Minimal
- Unhealthy air days now
- 0 days/yr
- Unhealthy air days in 30 yrs
- 1 days/yr
Risk factors via First Street. Map © Google.
Why this score? — see what drove the B- grade
The composite is a weighted blend of 9 inputs, each scored 0–100. Each bar is that input's sub-score; the figure is the points it added to the 100-point composite (weight × sub-score).
- Cash flow +30.0/30.0
- DSCR +10.0/10.0
- 1% rule +7.8/10.0
- ARV discount +7.5/15.0
- Livability +4.0/5.0
- Schools +3.8/10.0
- Rent growth +3.7/5.0
- Condition / age +2.5/5.0
- Appreciation +0.0/10.0
$379,000
🖨 Deal sheet 📄 Offer letter ✓ Due diligence
Multi-family units
County records classify this as Multi-Family (2-4 Unit). Listing-text estimate: 4 units. confirmed
Listing remarks MLS
Welcome to this fabulous turnkey investment opportunity. You'll find yourself in a newly renovated multi-unit. This house has new everything like Roof, Windows, HVAC, and Plumbing. To new floors, bathrooms, kitchens, and appliances. Live on one floor and rent out the other. Simple as that. There is even potential for additional units. Turn this 2-unit into 4 and watch the cash flow! Don't miss out on this hot opportunity.
Key facts
- Off street parking
- Backyard patio
- 2nd floor rear deck
Tags
Neighborhood map
What this means for you Summary
Snapshot
- This is a 4 × 1-bed/1-bath units multifamily listed at $379k.
Deal economics
- At list price, monthly cash flow is $1k ($12k/yr) — positive. Per door: $256/mo.
- The deal already cash-flows at list — no discount required.
- Meets the 1% rule at list price ($5k rent vs $379k).
- Cap rate 10.9% vs local median 5.3% in Troy — top-decile yield for the area; either an underpriced asset or a hidden risk that comps aren't pricing in. Stress-test before assuming the spread holds.
Location & tenants
- Location reads 81/100 on livability (#88 in NY, #1,350 nationally) — a professional / high-income tenant draw. Strengths: amenities A+, commute A+, housing A+; Watch: schools C-, employment C-, crime F.
- Troy City School District (urban): math 44% / reading 46% proficiency, ranked #467 of 590 in NY (top 79%) — families likely to look elsewhere, expect single-tenant / working-renter base with shorter leases; 62% free/reduced lunch — lower-income household profile, screen leases tightly.
- Market conditions: Rents rising fast (+4.9%/yr); 220 active listings in the ZIP; solid renter incomes; 405 units permitted in Rensselaer County in 2024 (224 in 5+ unit buildings).
- At $4,843/mo this rent would consume 77% of the median local household income ($76k/yr) (locally 2698% of renters already pay >50% of income on rent) — very limited rent-growth headroom before tenants either downsize or default.
Forward outlook
- Local home prices are declining (-3.0%/yr); year-one equity from $3k of loan paydown is wiped out by about $11k of value loss. Plan a longer hold.
- Rensselaer County population projected to shrink 6% by 2050 — rents likely to lag national; underwrite the cash flow, not the appreciation.
- At projected returns (-3.0% appreciation + 4.9% rent growth), your $106k cash investment doubles in ~9 years — after that, you're playing with house money.
Negotiation context
- Only 9 days on market — expect competitive offers; lowballing is unlikely to land.
- 10 sale attempts since 27y ago with the ask held roughly flat each time — persistent listings suggest the price (not the market) is what's stuck; bring a comps-based counter.
- Current owner paid $305k; 24% above their basis — modest negotiation headroom, anchor on the comps not their cost.
Risks & watch-outs
- Watch-outs: flood insurance adds $427/mo; built in 1930 — expect roof / HVAC / electrical / plumbing capex.
- Climate carrying-cost: in FEMA flood zone AE (mandatory federal flood insurance) — expect insurance premiums to compound above CPI over the hold.
Questions for the listing agent
- Can we see the unit-by-unit rent roll, current vacancy, and any below-market leases? What's the average tenancy length?
- What capital expenditures (roof, boiler, parking lot, exteriors) have been made in the last 5 years, and what's planned in the next 2?
- Built in 1930 — when were the roof, HVAC, electrical panel, plumbing, and water heater last replaced?
- What's the actual annual flood-insurance premium (NFIP or private), and is the property in a SFHA with mandatory coverage?
- Is there a deadline driving the sale (1031 exchange, divorce, estate, relocation)? That informs how much negotiation room exists.
- Crime grade is F in this area — have there been break-ins, vandalism, or insurance claims at this property in the last 3 years? What carrier currently insures it and at what premium?
- What's the average days-on-market for RENTAL listings here right now (not sales)? A rising rental-DOM trend means longer vacancies and softer asking-rent achievability than the comps imply.
- What's the recent tenant-quality profile in this submarket — average credit score on applications, eviction rate, late-payment / NSF rate, and stable-employment percentage? A property-management company in the area should have these aggregated.
- How much new apartment / multifamily construction is in the pipeline within 1–3 miles? Heavy new supply (>2% of stock underway) typically softens rents 12–24 months out; light construction supports rent growth.
Investment metrics
- 1% rule
- 1.28% ✓
- Cap rate
- 10.88%
- Cash-on-cash
- 16.40%
- DSCR
- 1.73
- GRM
- 6.5
CMA / ARV
- ARV (on-the-fly)
- $106,596
- Comps found
- 1
Show comp detail 1 sale within ~0.75 mi
| Address | Dist | Beds/Ba | Sqft | Sold | Price | $/sf | Match |
|---|---|---|---|---|---|---|---|
| 427 1st St | 0.08mi | 7/2.0 (-1) | 2,024 (+2%) | 19mo | $110,000 | $54 | 63 |
Match score weights: distance 35% · size 25% · config 20% · recency 20%. Top-matched comps best support the ARV.
Projected returns pro-forma
-3.0% appreciation · 4.88% rent growth · sell at horizon
- IRR
- 3.2%
- Equity multiple
- 1.13×
- Total profit
- $13,288
- Equity at exit
- $56,510
- IRR
- 14.5%
- Equity multiple
- 2.28×
- Total profit
- $136,056
- Equity at exit
- $32,769
Cash invested: $106,120 (down + closing). Projections, not guarantees.
Landlord ↔ Tenant lean methodology
- Overall (STATE)
- 15 Strongly Tenant-Friendly
- State New York
- 15 Strongly Tenant-Friendly · D+10
- County
- — inherits STATE
- City
- — inherits STATE
ZIP-level market 12180
- Home prices YoY
- -33.3%
- Rents YoY
- 4.9%
- Active inventory
- 220
- Price-to-rent
- 26.1×
Monthly cashflow live
- Estimated rent
- $4,843 medium interval (Pro) →
- Mortgage (P&I)
- −$1,988
- Tax from tax record
- −$231 /mo · $2,767/yr
- Insurance
- −$158
- Flood insurance flood zone
- −$427 /mo · $5,118/yr
- HOA
- −$0
- Vacancy / Maint / Mgmt
- −$1,017
- Net cashflow
- $1,023
Break-even live
4-unit breakdown (identical units grouped — click to expand)
| Units | Beds | Baths | Est. rent |
|---|---|---|---|
| 4× units | 1 | 1 | $4,844 |
| #1 | 1 | 1 | $1,211 |
| #2 | 1 | 1 | $1,211 |
| #3 | 1 | 1 | $1,211 |
| #4 | 1 | 1 | $1,211 |
| Total (4 units) | $4,843 | ||
UW: 25.0% down · 7.5% · 30yr · 1.5% tax · 5.0% vac · 8.0% maint · 8.0% mgmt
Financing live
Cash to close
- Down payment
- $94,750
- Closing costs
- $11,370
- Reserves months
- —
- Total cash needed
- —
Loan-product check · same deal, 3 products live
Conventional
25% down · 7.5% · 30yr
- Down + closing
- —
- Monthly P&I
- —
- Monthly cashflow
- —
- DSCR
- —
- Eligible?
- —
Personal DTI + credit; lowest rate.
DSCR
20% down · 8.5% · 30yr
- Down + closing
- —
- Monthly P&I
- —
- Monthly cashflow
- —
- DSCR
- —
- Eligible?
- —
No personal income docs; deal must DSCR.
Hard money
10% down · 12.0% · 12mo
- Down + closing
- —
- Monthly P&I
- —
- Monthly cashflow
- —
- DSCR
- —
- Eligible?
- —
Short-term bridge; refi at stabilization.
Listing history 26 events
-
2026-04-18status Pending
-
2026-04-09$379,000 Active
-
2026-02-09historical $1,450
-
2025-09-25$1,450
-
2025-09-12historical $1,450
-
2025-08-08$1,450
-
2025-04-23historical $1,450
-
2025-03-11$1,450
-
2025-02-07historical $1,450
-
2025-01-14$1,450
-
2024-12-09historical $1,450
-
2024-10-18$1,450
-
2024-01-03historical $1,425
-
2023-12-19$1,425
-
2022-05-19soldstatus $305,000
-
2022-02-01status Pending 432-char remark
Show marketing remark (432 chars)
Welcome to this fabulous turnkey investment opportunity. You'll find yourself in a newly renovated multi-unit. This house has new everything like Roof, Windows, HVAC, and Plumbing. To new floors, bathrooms, kitchens, and appliances. Live on one floor and rent out the other. Simple as that. There is even potential for additional units. Turn this 2-unit into 4 and watch the cash flow! Don't miss out on this hot opportunity.
-
2022-01-19price $315,000 432-char remark
Show marketing remark (432 chars)
Welcome to this fabulous turnkey investment opportunity. You'll find yourself in a newly renovated multi-unit. This house has new everything like Roof, Windows, HVAC, and Plumbing. To new floors, bathrooms, kitchens, and appliances. Live on one floor and rent out the other. Simple as that. There is even potential for additional units. Turn this 2-unit into 4 and watch the cash flow! Don't miss out on this hot opportunity.
-
2022-01-11$320,000 Active 432-char remark
Show marketing remark (432 chars)
Welcome to this fabulous turnkey investment opportunity. You'll find yourself in a newly renovated multi-unit. This house has new everything like Roof, Windows, HVAC, and Plumbing. To new floors, bathrooms, kitchens, and appliances. Live on one floor and rent out the other. Simple as that. There is even potential for additional units. Turn this 2-unit into 4 and watch the cash flow! Don't miss out on this hot opportunity.
-
2002-10-07soldstatus $30,000
-
2002-10-07soldstatus $13,000
-
2002-07-10soldstatus $13,000 33-char remark
Show marketing remark (33 chars)
CORPORATE OWNED -- Good Condition
-
2001-10-22$13,900 33-char remark
Show marketing remark (33 chars)
CORPORATE OWNED -- Good Condition
-
2000-03-10soldstatus $32,000
-
2000-03-06soldstatus $65,900
-
2000-01-17historical
-
1999-08-25$65,900
ⓘ Source: listings_history table (triggers on properties + properties_extension) + one-shot
backfill from property_details.listing_events for pre-trigger history.
Tax reassessment forecast NY · Partial reset (capped growth)
- Current annual tax
- $2,767 · $231/mo
- Projected year-2 tax
- $4,586 · $382/mo
- Expected delta
- +$1,819/yr (+$152/mo · 65.8%)
ⓘ Screening estimate from a state-policy table — verify with the county assessor before closing.
Climate risk First Street
- Flood 9/10 Extreme FEMA zone AE · 99% chance over 30 yrs
- Wildfire 3/10 Moderate
- Heat 4/10 Moderate 7 d/yr ≥96°F today · 17 d/yr by 30 yrs out
- Wind 3/10 Moderate 6% chance of damaging wind over 30 yrs
- Air quality 2/10 Low 0 unhealthy d/yr today · 1 by 30 yrs out
Nearby sold comps map
Loading sold comps map…
Walkable amenities ~0.75 mi
Loading nearby amenities…
Taxation est. · year 1
- Rental income
- $58,116
- − Mortgage interest
- −$21,230
- − Property taxes
- −$2,767
- − Insurance
- −$7,014
- − Repairs & maintenance
- −$4,649
- − Management
- −$4,649
- − Depreciation
- −$11,025
- Taxable income
- $6,782
- Est. tax owed @ 24.0%
- −$1,628
- After-tax cash flow
- $10,654/yr
For passive investors: Depreciation is non-cash, so a rental often shows a tax loss while cash-flowing — sheltering income. Rental losses are passive: they offset passive income freely, and up to $25,000/yr can offset ordinary (W-2) income if you actively participate and your MAGI is under $100k (phasing out to $0 by $150k); unused losses carry forward. On sale, claimed depreciation is recaptured at up to 25%, and gains may owe capital-gains tax (a 1031 exchange can defer both). Figures are a year-1 estimate at your 24.0% rate — not tax advice; consult a CPA.
Schools (NCES district)
- District
- Troy City School District
- NCES district ID
- 3628950
- Math proficiency
- 44% ▲ 6.00%
- Reading proficiency
- 46% ▲ 6.00%
- Median HH income
- $42,143
- Composite
- 37.89/100
- National rank
- #4318
- State rank
- #467 of 590 in NY
Livability — Troy
- Score
- 81/100
- State rank
- #88
- US rank
- #1350
Category grades
Schools grade is shown separately in the Schools card above.
Census & demographics
- Census place
- Troy, NY
- County
- Rensselaer County · 75,590 people
- City population
- 53,479
- Metro
- Albany-Schenectady-Troy, NY
- Population (ZIP)
- 53,479
- Household income
- $75,851
- Rent vs Own
- Severe rent burden
- 2698.0
Population outlook (Rensselaer County) Hauer SSP2
- Today (2025)
- 162,400 people
- By 2030
- 161,746 · -0.4%
- By 2040
- 158,095 · -2.7%
- By 2050
- 152,966 · -5.8%
- By 2075
- 140,767 · -13.3%
- By 2100
- 124,727 · -23.2%
Race, ethnicity, and origin ACS 2023
- Neighborhood character
- Predominantly White (70%)
- Race & ethnicity
- White 70% Black 12% Hispanic / Latino 8% Two or more races 8% Asian 5%
- Hispanic origin (detail)
- Mexican 1% Puerto Rican 4%
- Common ancestry
- Romanian 5% Lithuanian 5% Slovak 1%
- Foreign-born
- 10% · Canada, China
- Languages at home
- 88% English-only · Spanish 4% Other Indo-European 2% Arabic 2%
Political lean MEDSL · Rensselaer
- 2024 margin
- Toss-up / Even · D 50.7% · R 49.3%
- 2008→2024 swing
- -8.0pp toward R · 2008: 9.3pp · 2024: 1.4pp
- All cycles
- 2024: D+1.4 2020: D+5.6 2016: R+2.9 2012: D+11.8 2008: D+9.3
Not yet ingested
- Civics
- —
Market trends
- HPI YoY
- ▼ -142.53%
- Current HPI
- 285.0762
- Rent YoY
- ▲ 4.88%
- Metro
- Albany-Schenectady-Troy, NY
- State GDP YoY
- ▲ 2.60%
- F500 in state
- 92
Industry mix (Fortune 500 HQ in NY)
| Industry | F500 HQs | Revenue |
|---|---|---|
| Financial Services | 10 | $950B |
|
||
| Consumer Goods | 9 | $162B |
|
||
| Insurance | 4 | $225B |
|
||
| Telecommunications | 2 | $144B |
|
||
| Pharmaceuticals | 2 | $112B |
|
||
| Media / Entertainment | 2 | $69B |
|
||
Price history
+475.1% since first listed26 events — show timeline
- 2026-04-18 Pending — Global MLS
- 2026-04-09 Listed $379,000 Global MLS
- 2026-02-09 Rental Removed $1,450 GLOBALMLS
- 2025-09-25 Listed for Rent $1,450 GLOBALMLS
- 2025-09-12 Rental Removed $1,450 GLOBALMLS
- 2025-08-08 Listed for Rent $1,450 GLOBALMLS
- 2025-04-23 Rental Removed $1,450 GLOBALMLS
- 2025-03-11 Listed for Rent $1,450 GLOBALMLS
- 2025-02-07 Rental Removed $1,450 GLOBALMLS
- 2025-01-14 Listed for Rent $1,450 GLOBALMLS
- 2024-12-09 Rental Removed $1,450 GLOBALMLS
- 2024-10-18 Listed for Rent $1,450 GLOBALMLS
- 2024-01-03 Rental Removed $1,425 APPFOLIO
- 2023-12-19 Listed for Rent $1,425 APPFOLIO
- 2022-05-19 Sold (Public Records) $305,000 Public Records
- 2022-02-01 Pending — Global MLS
- 2022-01-19 Price Changed $315,000 Global MLS
- 2022-01-11 Listed $320,000 Global MLS
- 2002-10-07 Sold (Public Records) $13,000 Public Records
- 2002-10-07 Sold (Public Records) $30,000 Public Records
- 2002-07-10 Sold (MLS) $13,000 Global MLS
- 2001-10-22 Listed $13,900 Global MLS
- 2000-03-10 Sold (MLS) $32,000 Global MLS
- 2000-03-06 Sold (Public Records) $65,900 Public Records
- 2000-01-17 Listing Removed — Global MLS
- 1999-08-25 Listed $65,900 Global MLS
Property tax history
+1.6%/yrLatest (2025): $2,767 · -31.8% YoY. Source: county tax records.
Cash-flow waterfall
monthlySold comps — $/sqft
last 12 mo · ≤1 miLoading sold comps…