 🔨 Auction
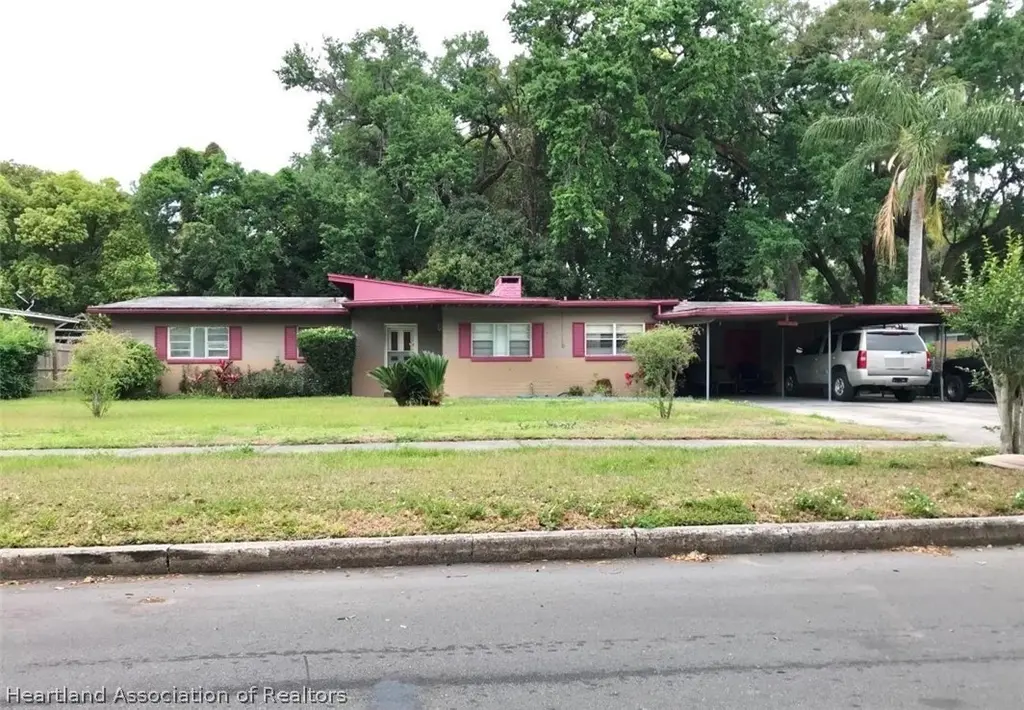
600 Madison Ave · Orlando, FL
Flood risk 1/10 · Minimal
- FEMA flood zone
- X (unshaded)
- Chance of flooding over 30 yrs
- 0.0%
- Est. flood insurance / yr
- $507 – $1,088
Fire risk 1/10 · Minimal
- Est. fire insurance / yr
- $947 – $1,759
Heat risk 9/10 · Severe
- Hot days now (above 108°F)
- 7 days/yr
- Hot days in 30 yrs
- 22 days/yr
Wind risk 9/10 · Severe
- Chance of severe wind over 30 yrs
- 99.0%
Air-quality risk 2/10 · Minimal
- Unhealthy air days now
- 0 days/yr
- Unhealthy air days in 30 yrs
- 1 days/yr
Risk factors via First Street. Map © Google.
Why this score? — see what drove the F grade
The composite is a weighted blend of 9 inputs, each scored 0–100. Each bar is that input's sub-score; the figure is the points it added to the 100-point composite (weight × sub-score).
- ARV discount +7.5/15.0
- Livability +4.3/5.0
- Schools +4.1/10.0
- Rent growth +2.9/5.0
- Cash flow +2.8/30.0
- Condition / age +2.5/5.0
- 1% rule +0.0/10.0
- DSCR +0.0/10.0
- Appreciation +0.0/10.0
$5,000
🖨 Deal sheet 📄 Offer letter ✓ Due diligence
Listing remarks
Foreclosure Auction Ends June 16, 2026 at 11:00 AM EST. Explore this charming 4-bedroom, 2-bath residence set in a peaceful and well-located Orlando community. The list price is the opening bid for the online auction. Sold As-is. Explore more details and submit your bid through Federa Home App.
Key facts
- 0.31 acre lot
- 2 parking spots
- Built 1953
Property features AI
Finance
- Other: Residential property
Exterior
- Parking: Carport (2 spaces)
- Utilities: Water: Other; Sewer: Other
- Home design: Single family residence; One level
- Construction: Construction materials: See remarks; Other roof
- Exterior features: Front porch; Road surface: Other; Zoned R-1AA/T
Interior
- Bedrooms: Total of 1 room (room count listed as 1)
- Flooring: Other flooring
- Bathrooms: 2 full bathrooms
- Heating & cooling: No heating; No cooling
- Interior features: Other flooring
Neighborhood map
What this means for you Summary
Snapshot
- This is a 4-bed/2.0-bath single-family listed at $5k.
Deal economics
- At list price, monthly cash flow is $-2k ($-29k/yr) — negative.
- The deal already cash-flows at list — no discount required.
- Meets the 1% rule at list price ($3k rent vs $5k).
- Cap rate 2.3% vs local median 3.0% in Orlando — below-typical yield; the buyer is paying a premium for something (appreciation thesis, condition, location) that the cap rate doesn't capture.
Location & tenants
- Location reads 86/100 on livability (#12 in FL, #360 nationally) — a professional / high-income tenant draw. Strengths: amenities A+, commute A+, housing A+.
- Orange (suburban): math 46% / reading 51% proficiency, ranked #43 of 73 in FL (top 59%) — families likely to look elsewhere, expect single-tenant / working-renter base with shorter leases.
- Market conditions: Rents rising (+1.4%/yr); 140 active listings in the ZIP; 16 comparable units currently listed for rent nearby; rentals at typical pace (median 18d on market — plan ~3-4 weeks tenant-placement turnaround); lower-income renter base — watch delinquency; 8,053 units permitted in Orange County in 2024 (3,133 in 5+ unit buildings).
- At $3,294/mo this rent would consume 98% of the median local household income ($41k/yr) (locally 1597% of renters already pay >50% of income on rent) — very limited rent-growth headroom before tenants either downsize or default.
Forward outlook
- Local home prices are declining (-3.0%/yr); year-one equity from $5k of loan paydown is wiped out by about $22k of value loss. Plan a longer hold.
- Orange County population projected at +52% by 2050 — long-run rental-demand tailwind backs the buy-and-hold thesis.
Negotiation context
- Only 7 days on market — expect competitive offers; lowballing is unlikely to land.
Risks & watch-outs
- Watch-outs: property tax is 219.1% of price; built in 1953 — expect roof / HVAC / electrical / plumbing capex.
- Climate carrying-cost: severe wind risk, 99% chance of damaging wind over 30y; extreme-heat days projected 7→22/yr by 2055 (HVAC capex compounding) — expect insurance premiums to compound above CPI over the hold.
Questions for the listing agent
- What do current leases actually rent for vs. the listed asking? Can we see a recent rent roll and the last 12 months of T-12 income?
- Built in 1953 — when were the roof, HVAC, electrical panel, plumbing, and water heater last replaced?
- Property tax is high relative to price — has the assessment been appealed recently, and will the sale trigger a re-assessment?
- Is there a deadline driving the sale (1031 exchange, divorce, estate, relocation)? That informs how much negotiation room exists.
- Schools are B-rated — typically a magnet for longer-tenancy family renters. What's the average tenant stay here, and is there a school-zone premium baked into asking?
- The area grade is low — what's the realistic commute time and amenity access for the typical tenant pool here? Any planned neighborhood developments (good or bad) we should know about?
- What's the average days-on-market for RENTAL listings here right now (not sales)? A rising rental-DOM trend means longer vacancies and softer asking-rent achievability than the comps imply.
- What's the recent tenant-quality profile in this submarket — average credit score on applications, eviction rate, late-payment / NSF rate, and stable-employment percentage? A property-management company in the area should have these aggregated.
- How much new for-sale + rental construction is in the pipeline within 1–3 miles? Heavy new supply typically softens prices + rents 12–24 months out; constrained supply supports both.
Investment metrics
- 1% rule
- 0.45% ✗
- Cap rate
- 2.28%
- Cash-on-cash
- -14.35%
- DSCR
- 0.36
- GRM
- 18.5
CMA / ARV
- ARV (on-the-fly)
- $730,422
- Comps found
- 5
Show comp detail 5 sales within ~0.75 mi
| Address | Dist | Beds/Ba | Sqft | Sold | Price | $/sf | Match |
|---|---|---|---|---|---|---|---|
| 1420 Rock Lake Dr | 0.11mi | 3/2.0 (-1) | 2,064 (-4%) | 11mo | $425,000 | $206 | 74 |
| 747 Clifford Dr | 0.35mi | 4/3.0 | 2,200 (+3%) | 11mo | $750,000 | $341 | 66 |
| 833 Ellwood Ave | 0.52mi | 3/2.5 (-1) | 1,826 (-15%) | 16mo | $749,900 | $411 | 31 |
| 816 Putnam Ave | 0.71mi | 4/3.0 | 2,378 (+11%) | 19mo | $710,000 | $299 | 28 |
| 2116 Alameda St | 0.66mi | 3/2.0 (-1) | 1,835 (-14%) | 16mo | $700,000 | $381 | 27 |
Match score weights: distance 35% · size 25% · config 20% · recency 20%. Top-matched comps best support the ARV.
Projected returns pro-forma
-3.0% appreciation · 1.42% rent growth · sell at horizon
- IRR
- -45.2%
- Equity multiple
- -0.37×
- Total profit
- $-279,223
- Equity at exit
- $108,908
- IRR
- -93.3%
- Equity multiple
- -1.27×
- Total profit
- $-463,998
- Equity at exit
- $63,154
Cash invested: $204,518 (down + closing). Projections, not guarantees.
Landlord ↔ Tenant lean methodology
- Overall (STATE)
- 87 Strongly Landlord-Friendly
- State Florida
- 87 Strongly Landlord-Friendly · R+3
- County
- — inherits STATE
- City
- — inherits STATE
ZIP-level market 32805
- Home prices YoY
- -7.6%
- Rents YoY
- 1.4%
- Active inventory
- 140
- Price-to-rent
- 0.1×
Monthly cashflow live
- Estimated rent
- $3,294 high interval (Pro) →
- Mortgage (P&I)
- −$3,830
- Tax est. 1.5%
- −$913 /mo · $10,956/yr
- Insurance
- −$304
- HOA
- −$0
- Vacancy / Maint / Mgmt
- −$692
- Net cashflow
- $-2,446
Break-even live
UW: 25.0% down · 7.5% · 30yr · 1.5% tax · 5.0% vac · 8.0% maint · 8.0% mgmt
Financing live
Cash to close
- Down payment
- $182,606
- Closing costs
- $21,913
- Reserves months
- —
- Total cash needed
- —
Loan-product check · same deal, 3 products live
Conventional
25% down · 7.5% · 30yr
- Down + closing
- —
- Monthly P&I
- —
- Monthly cashflow
- —
- DSCR
- —
- Eligible?
- —
Personal DTI + credit; lowest rate.
DSCR
20% down · 8.5% · 30yr
- Down + closing
- —
- Monthly P&I
- —
- Monthly cashflow
- —
- DSCR
- —
- Eligible?
- —
No personal income docs; deal must DSCR.
Hard money
10% down · 12.0% · 12mo
- Down + closing
- —
- Monthly P&I
- —
- Monthly cashflow
- —
- DSCR
- —
- Eligible?
- —
Short-term bridge; refi at stabilization.
Rent comps 16 comps
| Address | Beds | Baths | Sqft | Rent | $/sqft | DOM | Units | Dist |
|---|---|---|---|---|---|---|---|---|
| 722 Ellwood Ave Orlando, FL | 5.0 | 3.0 | 2375 | $4,350 | $1.83 | 14d | 1 | 0.36mi |
| 816 Putnam Ave Orlando, FL | 3.0 | 2.0 | 1678 | $2,750 | $1.64 | 23d | 1 | 0.72mi |
| 732 Edgewater Dr Orlando, FL | 4.0 | 2.5 | 2112 | $3,740 | $1.77 | 23d | 1 | 0.77mi |
| 505 Chatham Ave Orlando, FL | 3.0 | 1.0–2.0 | 1022 | $3,144 | $3.08 | 3d | 27 | 0.88mi |
| 1028 Yates St Orlando, FL | 3.0 | 2.0 | 1808 | $900 | $0.50 | 14d | 1 | 1.10mi |
| 2314 W South St Orlando, FL | 3.0 | 2.0 | 1440 | $2,000 | $1.39 | 14d | 1 | 1.13mi |
| 416 Sun Ct Orlando, FL | 5.0 | 2.0 | 3000 | $2,000 | $0.67 | 23d | 1 | 1.23mi |
| 97 N Goldwyn Ave Orlando, FL | 3.0 | 2.0 | 1531 | $2,400 | $1.57 | 23d | 1 | 1.24mi |
| 732 S Lee Ave Orlando, FL | 3.0 | 2.5 | 1914 | $2,295 | $1.20 | 17d | 1 | 1.31mi |
| 2236 Brix St Orlando, FL | 3.0 | 3.5 | 2059 | $3,500 | $1.70 | 10d | 1 | 1.35mi |
| 612 Stetson St Orlando, FL | 3.0 | 1.0 | 1400 | $2,599 | $1.86 | 23d | 1 | 1.42mi |
| 335 N Magnolia Ave Orlando, FL | 3.0 | 1.0–3.0 | 1041 | $2,640 | $2.54 | 1d | 35 | 1.42mi |
| 2332 Brix St Orlando, FL | 4.0 | 3.5 | 2059 | $3,500 | $1.70 | 17d | 1 | 1.45mi |
| 2419 Orange Center Blvd Orlando, FL | 3.0 | 2.0 | 1526 | $2,600 | $1.70 | 23d | 1 | 1.46mi |
| 151 E Robinson St Orlando, FL | 4.0 | 1.0–3.5 | 1815 | $10,000 | $5.51 | 14d | 2 | 1.48mi |
| 111 E Washington St Orlando, FL | 3.0 | 3.5 | 2895 | $9,000 | $3.11 | 23d | 1 | 1.48mi |
Listing history 6 events
-
2026-06-16days on market $5,000 Active 7 DOM
-
2026-06-15days on market $5,000 Active 6 DOM
-
2026-06-13days on market $5,000 Active 4 DOM
-
2026-06-13days on market $5,000 Active 3 DOM
-
2026-06-10remarks 295-char remark
-
2026-06-10$5,000 Active 1 DOM
ⓘ Source: listings_history table (triggers on properties + properties_extension) + one-shot
backfill from property_details.listing_events for pre-trigger history.
Climate risk First Street
- Flood 1/10 Low FEMA zone X (unshaded) · 0% chance over 30 yrs
- Wildfire 1/10 Low
- Heat 9/10 Extreme 7 d/yr ≥108°F today · 22 d/yr by 30 yrs out
- Wind 9/10 Extreme 99% chance of damaging wind over 30 yrs
- Air quality 2/10 Low 0 unhealthy d/yr today · 1 by 30 yrs out
Nearby sold comps map
Loading sold comps map…
Walkable amenities ~0.75 mi
Loading nearby amenities…
Taxation est. · year 1
- Rental income
- $39,528
- − Mortgage interest
- −$40,915
- − Property taxes
- −$10,956
- − Insurance
- −$3,652
- − Repairs & maintenance
- −$3,162
- − Management
- −$3,162
- − Depreciation
- −$21,249
- Taxable loss
- −$43,569
- Est. tax savings @ 24.0%
- +$10,456
- After-tax cash flow
- $-18,890/yr
For passive investors: Depreciation is non-cash, so a rental often shows a tax loss while cash-flowing — sheltering income. Rental losses are passive: they offset passive income freely, and up to $25,000/yr can offset ordinary (W-2) income if you actively participate and your MAGI is under $100k (phasing out to $0 by $150k); unused losses carry forward. On sale, claimed depreciation is recaptured at up to 25%, and gains may owe capital-gains tax (a 1031 exchange can defer both). Figures are a year-1 estimate at your 24.0% rate — not tax advice; consult a CPA.
Schools (NCES district)
- District
- Orange
- NCES district ID
- 1201440
- Math proficiency
- 46% ▼ -9.00%
- Reading proficiency
- 51% ▼ -2.00%
- Median HH income
- $49,350
- Composite
- 41.47/100
- National rank
- #3461
- State rank
- #43 of 73 in FL
Livability — Orlando
- Score
- 86/100
- State rank
- #12
- US rank
- #360
Category grades
Schools grade is shown separately in the Schools card above.
Census & demographics
- Census place
- Orlando, FL
- County
- Orange County · 1,471,359 people
- City population
- 964,969
- Metro
- Orlando-Kissimmee-Sanford, FL
- Population (ZIP)
- 19,294
- Household income
- $40,515
- Rent vs Own
- Severe rent burden
- 1597.0
Population outlook (Orange County) Hauer SSP2
- Today (2025)
- 1,618,226 people
- By 2030
- 1,787,404 · +10.5%
- By 2040
- 2,125,621 · +31.4%
- By 2050
- 2,454,016 · +51.6%
- By 2075
- 3,173,711 · +96.1%
- By 2100
- 3,607,781 · +122.9%
Race, ethnicity, and origin ACS 2023
- Neighborhood character
- Predominantly Black (70%)
- Race & ethnicity
- Black 70% Hispanic / Latino 15% White 13% Two or more races 8%
- Hispanic origin (detail)
- Mexican 3% Puerto Rican 4% Cuban 1% Dominican 3%
- Common ancestry
- Hispanic 9% Russian 1%
- Foreign-born
- 16% · Canada, Jamaica
- Languages at home
- 80% English-only · Spanish 11% French/Haitian/Cajun 8%
Political lean MEDSL · Orange
- 2024 margin
- D (+13.6) · D 56.1% · R 42.5% · Other 1.3%
- 2008→2024 swing
- -5.0pp toward R · 2008: 18.6pp · 2024: 13.6pp
- All cycles
- 2024: D+13.6 2020: D+23.1 2016: D+24.6 2012: D+18.2 2008: D+18.6
Not yet ingested
- Civics
- —
Market trends
- HPI YoY
- ▼ -35.19%
- Current HPI
- 429.3242
- Rent YoY
- ▲ 1.42%
- Metro
- Orlando-Kissimmee-Sanford, FL
- State GDP YoY
- ▲ 3.28%
- F500 in state
- 36
Industry mix (Fortune 500 HQ in FL)
| Industry | F500 HQs | Revenue |
|---|---|---|
| Industrial Technology | 2 | $29B |
|
||
| Insurance | 2 | $17B |
|
||
| Retail | 1 | $60B |
|
||
| Technology Distribution | 1 | $58B |
|
||
| Homebuilding | 1 | $35B |
|
||
| Technology Manufacturing | 1 | $35B |
|
||
Price history
-86.1% since first listed3 events — show timeline
- 2026-06-09 Listed $5,000 HAOR as distributed by MLS GRID
- 1978-06-01 Sold (Public Records) $34,500 Public Records
- 1973-06-01 Sold (Public Records) $36,000 Public Records
Property tax history
+16.6%/yrLatest (2025): $5,642 · +4.2% YoY. Source: county tax records.
Cash-flow waterfall
monthlySold comps — $/sqft
last 12 mo · ≤1 miLoading sold comps…