6641 Washington St · St. Joseph, MO
Flood risk 5/10 · Moderate
- FEMA flood zone
- X (shaded)
- Chance of flooding over 30 yrs
- 0.24%
- Est. flood insurance / yr
- $473 – $860
Fire risk 2/10 · Minimal
- Est. fire insurance / yr
- $1,054 – $1,958
Heat risk 4/10 · Minor
- Hot days now (above 107°F)
- 7 days/yr
- Hot days in 30 yrs
- 16 days/yr
Wind risk 2/10 · Minimal
- Chance of severe wind over 30 yrs
- —
Air-quality risk 2/10 · Minimal
- Unhealthy air days now
- 0 days/yr
- Unhealthy air days in 30 yrs
- 1 days/yr
Risk factors via First Street. Map © Google.
Why this score? — see what drove the D+ grade
The composite is a weighted blend of 9 inputs, each scored 0–100. Each bar is that input's sub-score; the figure is the points it added to the 100-point composite (weight × sub-score).
- Cash flow +17.2/30.0
- ARV discount +12.9/15.0
- DSCR +5.4/10.0
- 1% rule +3.7/10.0
- Schools +2.8/10.0
- Rent growth +2.5/5.0
- Livability +2.5/5.0
- Condition / age +2.5/5.0
- Appreciation +0.0/10.0
$114,900
🖨 Deal sheet 📄 Offer letter ✓ Due diligence
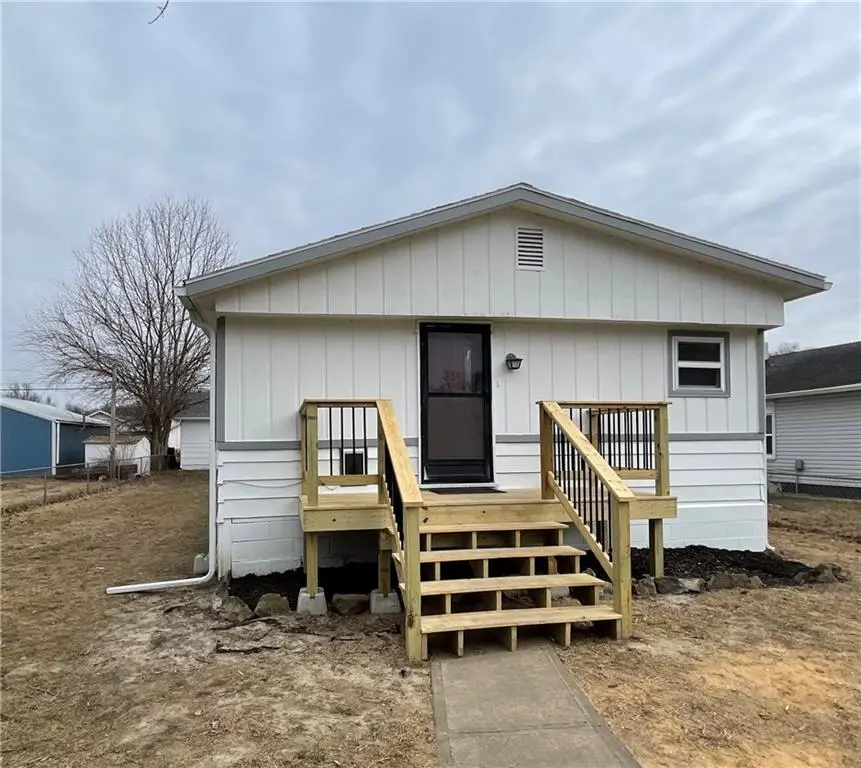
Listing remarks MLS
Back on the market, buyer's financing fell through so NOW is your chance to have the Wow factor at a very affordable price! This incredible one level living property offers a new front deck, new exterior paint, new composition roof, new fascia, soffit and new guttering! New heating and cooling mini-splits! Check out the large open kitchen, living room with fireplace and dining room concept all with new flooring! Home provides 2 nice size bedrooms, updated flooring, has a fenced yard and a large detached 2 car garage with large car pad. You will love sitting enclosed outdoor patio that could be used all 4 seasons. Come check out all of wonderful amenities this property offers! Home is perfect for entertaining!
Key facts
- New composition roof
- Dining room concept
- New guttering
Tags
Neighborhood map
What this means for you Summary
Snapshot
- This is a 2-bed/1.0-bath single-family listed at $115k.
Deal economics
- At list price, monthly cash flow is $83 ($993/yr) — positive.
- The deal already cash-flows at list — no discount required.
- To meet the 1% rule (rent ≥ 1% of price), the offer needs to be $100k (13.0% below list).
- Recommended offer: $100k (13.0% below list) — sets the bar for 1% rule.
- Cap rate 7.2% vs local median 4.7% in St. Joseph — top-decile yield for the area; either an underpriced asset or a hidden risk that comps aren't pricing in. Stress-test before assuming the spread holds.
Location & tenants
- Location reads: area grade D — affects rentability + tenant quality, not the cash-flow math above.
- St. Joseph (urban): math 28% / reading 38% proficiency, ranked #241 of 324 in MO (top 74%) — families likely to look elsewhere, expect single-tenant / working-renter base with shorter leases.
- Market conditions: 54 active listings in the ZIP; 1 comparable units currently listed for rent nearby; 70 units permitted in Buchanan County in 2024 (0 in 5+ unit buildings).
Forward outlook
- Local home prices are declining (-3.0%/yr); year-one equity from $794 of loan paydown is wiped out by about $3k of value loss. Plan a longer hold.
- Buchanan County population projected to shrink 6% by 2050 — rents likely to lag national; underwrite the cash flow, not the appreciation.
Negotiation context
- It's been on market 121 days — a 12% lower offer ($101k) is reasonable based on typical stale-listing flexibility.
- 5 sale attempts since 3y ago with the ask held roughly flat each time — persistent listings suggest the price (not the market) is what's stuck; bring a comps-based counter.
Risks & watch-outs
- Climate carrying-cost: moderate flood risk — expect insurance premiums to compound above CPI over the hold.
Questions for the listing agent
- It's been on market 121 days. Have you received any prior offers? Is the seller open to a 13% concession, seller financing, or rate buy-down credit?
- Built in 1972 — when were the roof, HVAC, electrical panel, plumbing, and water heater last replaced?
- Why hasn't it sold? Are there any deal-killer items the seller is aware of (foundation, flood, title, zoning, code violations)?
- Is there a deadline driving the sale (1031 exchange, divorce, estate, relocation)? That informs how much negotiation room exists.
- The area grade is low — what's the realistic commute time and amenity access for the typical tenant pool here? Any planned neighborhood developments (good or bad) we should know about?
- What's the average days-on-market for RENTAL listings here right now (not sales)? A rising rental-DOM trend means longer vacancies and softer asking-rent achievability than the comps imply.
- What's the recent tenant-quality profile in this submarket — average credit score on applications, eviction rate, late-payment / NSF rate, and stable-employment percentage? A property-management company in the area should have these aggregated.
- How much new for-sale + rental construction is in the pipeline within 1–3 miles? Heavy new supply typically softens prices + rents 12–24 months out; constrained supply supports both.
Investment metrics
- 1% rule
- 0.87% ✗
- Cap rate
- 7.16%
- Cash-on-cash
- 3.09%
- DSCR
- 1.14
- GRM
- 9.6
CMA / ARV
- ARV (median comp)
- $130,616
- List price
- $114,900
- Delta
- -12.03%
- Verdict
- UNDERPRICED
- Comps
- 20 within 1.0 mi
Show comp detail 12 sales within ~0.75 mi
| Address | Dist | Beds/Ba | Sqft | Sold | Price | $/sf | Match |
|---|---|---|---|---|---|---|---|
| 6802 Binswanger St | 0.10mi | 3/1.0 (+1) | 1,152 (-2%) | 4mo | $174,950 | $152 | 83 |
| 6620 Vancil Pkwy | 0.22mi | 2/1.0 | 1,038 (-12%) | 2mo | $150,000 | $145 | 68 |
| 6408 Sherman St | 0.29mi | 3/1.0 (+1) | 1,082 (-8%) | 3mo | $68,000 | $63 | 66 |
| 6407 Pryor Ave | 0.38mi | 3/2.0 (+1) | 1,250 (+6%) | 5mo | $219,000 | $175 | 59 |
| 312 Harrington Ave | 0.55mi | 3/1.0 (+1) | 1,212 (+3%) | 6mo | $130,000 | $107 | 59 |
| 323 W Hyde Park Ave | 0.44mi | 3/1.0 (+1) | 1,076 (-9%) | 4mo | $164,950 | $153 | 57 |
| 326 Ohio St | 0.67mi | 3/1.0 (+1) | 1,200 (+2%) | 5mo | $130,000 | $108 | 57 |
| 510-512 Ohio St | 0.67mi | 2/1.0 | 1,064 (-10%) | 2mo | $129,900 | $122 | 51 |
| 6425 Eureka St | 0.44mi | 2/2.0 | 1,008 (-14%) | 3mo | $138,000 | $137 | 49 |
| 7027 Ollmeda St | 0.69mi | 2/1.0 | 1,070 (-9%) | 6mo | $134,900 | $126 | 48 |
| 6601 Ridgeway St | 0.43mi | 3/2.0 (+1) | 1,352 (+15%) | 5mo | $175,000 | $129 | 42 |
| 214 Michigan St | 0.75mi | 3/1.0 (+1) | 1,294 (+10%) | 2mo | $90,000 | $70 | 42 |
Match score weights: distance 35% · size 25% · config 20% · recency 20%. Top-matched comps best support the ARV.
Projected returns pro-forma
-3.0% appreciation · 3.0% rent growth · sell at horizon
- IRR
- -11.5%
- Equity multiple
- 0.58×
- Total profit
- $-13,389
- Equity at exit
- $17,132
- IRR
- -2.3%
- Equity multiple
- 0.84×
- Total profit
- $-5,031
- Equity at exit
- $9,934
Cash invested: $32,172 (down + closing). Projections, not guarantees.
Landlord ↔ Tenant lean methodology
- Overall (STATE)
- 81 Strongly Landlord-Friendly
- State Missouri
- 81 Strongly Landlord-Friendly · R+10
- County
- — inherits STATE
- City
- — inherits STATE
ZIP-level market 64504
- Active inventory
- 54
- Price-to-rent
- 9.6×
Monthly cashflow live
- Estimated rent
- $1,000 medium interval (Pro) →
- Mortgage (P&I)
- −$603
- Tax from tax record
- −$57 /mo · $682/yr
- Insurance
- −$48
- HOA
- −$0
- Vacancy / Maint / Mgmt
- −$210
- Net cashflow
- $83
Break-even live
UW: 25.0% down · 7.5% · 30yr · 1.5% tax · 5.0% vac · 8.0% maint · 8.0% mgmt
Financing live
Cash to close
- Down payment
- $28,725
- Closing costs
- $3,447
- Reserves months
- —
- Total cash needed
- —
Loan-product check · same deal, 3 products live
Conventional
25% down · 7.5% · 30yr
- Down + closing
- —
- Monthly P&I
- —
- Monthly cashflow
- —
- DSCR
- —
- Eligible?
- —
Personal DTI + credit; lowest rate.
DSCR
20% down · 8.5% · 30yr
- Down + closing
- —
- Monthly P&I
- —
- Monthly cashflow
- —
- DSCR
- —
- Eligible?
- —
No personal income docs; deal must DSCR.
Hard money
10% down · 12.0% · 12mo
- Down + closing
- —
- Monthly P&I
- —
- Monthly cashflow
- —
- DSCR
- —
- Eligible?
- —
Short-term bridge; refi at stabilization.
Rent comps 1 comps
| Address | Beds | Baths | Sqft | Rent | $/sqft | DOM | Units | Dist |
|---|---|---|---|---|---|---|---|---|
| 5206 King Hill Ave Unit C St Joseph, MO | 2.0 | 1.0 | 1122 | $1,000 | $0.89 | 43d | 1 | 1.12mi |
Listing history 34 events
-
2026-06-19days on market $114,900 Active 121 DOM
-
2026-06-18days on market $114,900 Active 120 DOM
-
2026-06-17days on market $114,900 Active 119 DOM
-
2026-06-16days on market $114,900 Active 118 DOM
-
2026-06-15days on market $114,900 Active 117 DOM
-
2026-06-14days on market $114,900 Active 115 DOM
-
2026-06-12days on market $114,900 Active 114 DOM
-
2026-06-09days on market $114,900 Active 111 DOM
-
2026-06-08days on market $114,900 Active 110 DOM
-
2026-06-07days on market $114,900 Active 109 DOM
-
2026-06-03days on market $114,900 Active 105 DOM
-
2026-06-02days on market $114,900 Active 104 DOM
-
2026-06-01days on market $114,900 Active 103 DOM
-
2026-05-31days on market $114,900 Active 102 DOM
-
2026-05-30days on market $114,900 Active 101 DOM
-
2026-04-24status Active 719-char remark
Show marketing remark (719 chars)
Back on the market, buyer's financing fell through so NOW is your chance to have the Wow factor at a very affordable price! This incredible one level living property offers a new front deck, new exterior paint, new composition roof, new fascia, soffit and new guttering! New heating and cooling mini-splits! Check out the large open kitchen, living room with fireplace and dining room concept all with new flooring! Home provides 2 nice size bedrooms, updated flooring, has a fenced yard and a large detached 2 car garage with large car pad. You will love sitting enclosed outdoor patio that could be used all 4 seasons. Come check out all of wonderful amenities this property offers! Home is perfect for entertaining!
-
2026-04-03historical Active Under Contract 719-char remark
Show marketing remark (719 chars)
Back on the market, buyer's financing fell through so NOW is your chance to have the Wow factor at a very affordable price! This incredible one level living property offers a new front deck, new exterior paint, new composition roof, new fascia, soffit and new guttering! New heating and cooling mini-splits! Check out the large open kitchen, living room with fireplace and dining room concept all with new flooring! Home provides 2 nice size bedrooms, updated flooring, has a fenced yard and a large detached 2 car garage with large car pad. You will love sitting enclosed outdoor patio that could be used all 4 seasons. Come check out all of wonderful amenities this property offers! Home is perfect for entertaining!
-
2026-02-18$114,900 Active 719-char remark
Show marketing remark (719 chars)
Back on the market, buyer's financing fell through so NOW is your chance to have the Wow factor at a very affordable price! This incredible one level living property offers a new front deck, new exterior paint, new composition roof, new fascia, soffit and new guttering! New heating and cooling mini-splits! Check out the large open kitchen, living room with fireplace and dining room concept all with new flooring! Home provides 2 nice size bedrooms, updated flooring, has a fenced yard and a large detached 2 car garage with large car pad. You will love sitting enclosed outdoor patio that could be used all 4 seasons. Come check out all of wonderful amenities this property offers! Home is perfect for entertaining!
-
2024-06-18soldstatus
-
2024-06-07historical
-
2024-05-24status Active
-
2024-05-10status Pending
-
2024-05-06status Active
-
2024-04-19status Pending
-
2024-04-16price $50,000
-
2024-03-20price $60,000
-
2024-02-21price $65,000
-
2024-01-29price $70,000
-
2024-01-09price $73,000
-
2023-11-16price $75,000
-
2023-11-02price $80,000
-
2023-10-17price $85,000
-
2023-09-22$90,000 Active
-
2001-01-03soldstatus
ⓘ Source: listings_history table (triggers on properties + properties_extension) + one-shot
backfill from property_details.listing_events for pre-trigger history.
Tax reassessment forecast MO · Resets to sale price
- Current annual tax
- $682 · $57/mo
- Projected year-2 tax
- $1,115 · $93/mo
- Expected delta
- +$432/yr (+$36/mo · 63.3%)
ⓘ Screening estimate from a state-policy table — verify with the county assessor before closing.
Climate risk First Street
- Flood 5/10 Major FEMA zone X (shaded) · 24% chance over 30 yrs
- Wildfire 2/10 Low
- Heat 4/10 Moderate 7 d/yr ≥107°F today · 16 d/yr by 30 yrs out
- Wind 2/10 Low
- Air quality 2/10 Low 0 unhealthy d/yr today · 1 by 30 yrs out
Nearby sold comps map
Loading sold comps map…
Walkable amenities ~0.75 mi
Loading nearby amenities…
Taxation est. · year 1
- Rental income
- $12,000
- − Mortgage interest
- −$6,436
- − Property taxes
- −$682
- − Insurance
- −$574
- − Repairs & maintenance
- −$960
- − Management
- −$960
- − Depreciation
- −$3,343
- Taxable loss
- −$956
- Est. tax savings @ 24.0%
- +$229
- After-tax cash flow
- $1,222/yr
For passive investors: Depreciation is non-cash, so a rental often shows a tax loss while cash-flowing — sheltering income. Rental losses are passive: they offset passive income freely, and up to $25,000/yr can offset ordinary (W-2) income if you actively participate and your MAGI is under $100k (phasing out to $0 by $150k); unused losses carry forward. On sale, claimed depreciation is recaptured at up to 25%, and gains may owe capital-gains tax (a 1031 exchange can defer both). Figures are a year-1 estimate at your 24.0% rate — not tax advice; consult a CPA.
Schools (NCES district)
- District
- St. Joseph
- NCES district ID
- 2927060
- Math proficiency
- 28% ▼ -6.00%
- Reading proficiency
- 38% ▼ -1.00%
- Median HH income
- $43,007
- Composite
- 27.99/100
- National rank
- #6853
- State rank
- #241 of 324 in MO
Livability — St. Joseph
No livability data for this city. (Only ~50 U.S. cities are tracked.)
Census & demographics
- Census place
- St. Joseph, MO
- City population
- 44,382
- Population (ZIP)
- 10,286
Population outlook (Buchanan County) Hauer SSP2
- Today (2025)
- 89,041 people
- By 2030
- 88,401 · -0.7%
- By 2040
- 86,220 · -3.2%
- By 2050
- 83,603 · -6.1%
- By 2075
- 76,750 · -13.8%
- By 2100
- 67,623 · -24.1%
Race, ethnicity, and origin ACS 2023
- Neighborhood character
- Predominantly White (83%)
- Race & ethnicity
- White 83% Hispanic / Latino 9% Two or more races 7% Black 3% Native American 1%
- Hispanic origin (detail)
- Mexican 4% Cuban 2%
- Common ancestry
- Lithuanian 2% Romanian 2% Slovak 2%
- Foreign-born
- 4% · Canada
- Languages at home
- 94% English-only · Spanish 5%
Political lean MEDSL · Buchanan
- 2024 margin
- Strong R (+28.0) · D 35.2% · R 63.3% · Other 1.5%
- 2008→2024 swing
- -28.2pp toward R · 2008: 0.1pp · 2024: -28.0pp
- All cycles
- 2024: R+28.0 2020: R+24.6 2016: R+26.2 2012: R+8.7 2008: D+0.1
Not yet ingested
- Civics
- —
Market trends
- HPI YoY
- ▼ -100.84%
- Current HPI
- 149.9895
- Rent YoY
- —
- Metro
- —
- State GDP YoY
- ▲ 1.84%
- F500 in state
- 20
Industry mix (Fortune 500 HQ in MO)
| Industry | F500 HQs | Revenue |
|---|---|---|
| Healthcare | 1 | $163B |
|
||
| Insurance | 1 | $21B |
|
||
| Industrial Technology | 1 | $17B |
|
||
| Retail | 1 | $16B |
|
||
| Industrial Distribution | 1 | $10B |
|
||
| Utilities | 1 | $9B |
|
||
Price history
+27.7% since first listed19 events — show timeline
- 2026-04-24 Relisted — Heartland MLS as Distributed by MLS Grid
- 2026-04-03 Contingent — Heartland MLS as Distributed by MLS Grid
- 2026-02-18 Listed $114,900 Heartland MLS as Distributed by MLS Grid
- 2024-06-18 Sold (Public Records) — Public Records
- 2024-06-07 Listing Removed — Heartland MLS as Distributed by MLS Grid
- 2024-05-24 Relisted — Heartland MLS as Distributed by MLS Grid
- 2024-05-10 Pending — Heartland MLS as Distributed by MLS Grid
- 2024-05-06 Relisted — Heartland MLS as Distributed by MLS Grid
- 2024-04-19 Pending — Heartland MLS as Distributed by MLS Grid
- 2024-04-16 Price Changed $50,000 Heartland MLS as Distributed by MLS Grid
- 2024-03-20 Price Changed $60,000 Heartland MLS as Distributed by MLS Grid
- 2024-02-21 Price Changed $65,000 Heartland MLS as Distributed by MLS Grid
- 2024-01-29 Price Changed $70,000 Heartland MLS as Distributed by MLS Grid
- 2024-01-09 Price Changed $73,000 Heartland MLS as Distributed by MLS Grid
- 2023-11-16 Price Changed $75,000 Heartland MLS as Distributed by MLS Grid
- 2023-11-02 Price Changed $80,000 Heartland MLS as Distributed by MLS Grid
- 2023-10-17 Price Changed $85,000 Heartland MLS as Distributed by MLS Grid
- 2023-09-22 Listed $90,000 Heartland MLS as Distributed by MLS Grid
- 2001-01-03 Sold (Public Records) — Public Records
Property tax history
+1.5%/yrLatest (2025): $682 · +5.8% YoY. Source: county tax records.
Cash-flow waterfall
monthlySold comps — $/sqft
last 12 mo · ≤1 miLoading sold comps…