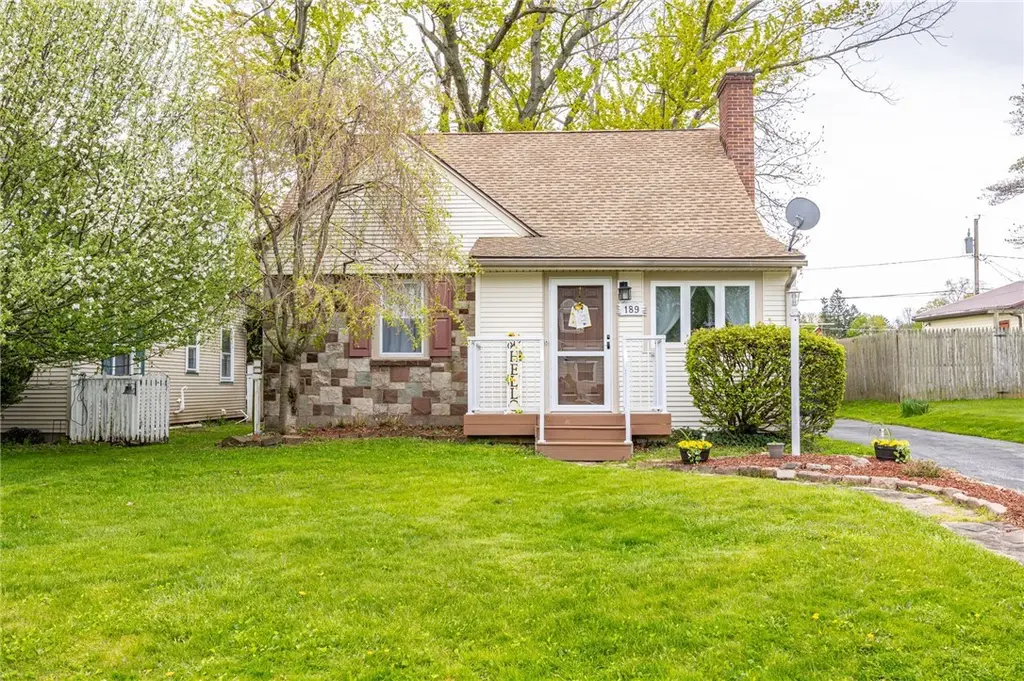
189 Cinnabar Rd · Irondequoit, NY
Flood risk 1/10 · Minimal
- FEMA flood zone
- X (unshaded)
- Chance of flooding over 30 yrs
- 0.0%
- Est. flood insurance / yr
- $473 – $860
Fire risk 3/10 · Minor
- Est. fire insurance / yr
- $691 – $1,283
Heat risk 2/10 · Minimal
- Hot days now (above 95°F)
- 7 days/yr
- Hot days in 30 yrs
- 16 days/yr
Wind risk 1/10 · Minimal
- Chance of severe wind over 30 yrs
- —
Air-quality risk 2/10 · Minimal
- Unhealthy air days now
- 1 days/yr
- Unhealthy air days in 30 yrs
- 2 days/yr
Risk factors via First Street. Map © Google.
Why this score? — see what drove the B+ grade
The composite is a weighted blend of 9 inputs, each scored 0–100. Each bar is that input's sub-score; the figure is the points it added to the 100-point composite (weight × sub-score).
- Cash flow +29.1/30.0
- ARV discount +15.0/15.0
- DSCR +10.0/10.0
- 1% rule +9.4/10.0
- Schools +6.2/10.0
- Livability +4.0/5.0
- Rent growth +2.5/5.0
- Condition / age +2.5/5.0
- Appreciation +0.0/10.0
$199,900
🖨 Deal sheet 📄 Offer letter ✓ Due diligence
Listing remarks
Move right into this West Irondequoit cape cod/ranch style home! Ideal location and layout all wrapped into one charming property! Situated on a low traffic neighborhood with sidewalk lined streets just steps from schools and close to beautiful Lake Ontario. Fantastic curb appeal welcomes you with a charming front porch, the perfect spot to sip your morning cup of coffee. Inside offers over 1,300 SqFt with 3 beds and 2 full baths plus the convenience of main floor living! The first floor features a spacious living room with a cozy wood burning fireplace, fresh paint '20 and hardwoods hiding under the carpet ready to shine. The eat-in kitchen includes a new stainless steel microwave '25, amp
Key facts
- Charming front porch
- Steps from schools
- Spacious living room
Tags
Property features AI
Exterior
- Parking: Detached garage (1-car)
- Utilities: High-speed internet available; Public water (connected); Sewer connected; Electric with circuit breakers
- Home design: Single-story home; Brick and vinyl siding exterior; Resale property
- Construction: Block foundation; Existing construction
- Exterior features: Blacktop driveway; Deck; Fully fenced yard; Gazebo
Interior
- Kitchen: Electric oven; Electric range; Microwave; Dishwasher; Refrigerator; Eat-in kitchen layout
- Bedrooms: Two main-level bedrooms
- Flooring: Carpet; Luxury vinyl; Varied flooring
- Bathrooms: Two full bathrooms (one on the main level)
- Heating & cooling: Gas forced-air heating; Central air; Window AC units
- Interior features: Entrance foyer; Eat-in kitchen; Separate/formal living room; Living/dining room; Attic access; Sliding glass doors
- Laundry & utility: Washer and dryer (main level)
Neighborhood map
What this means for you Summary
Snapshot
- This is a 3-bed/2.0-bath single-family listed at $200k.
Deal economics
- At list price, monthly cash flow is $687 ($8k/yr) — positive.
- The deal already cash-flows at list — no discount required.
- Meets the 1% rule at list price ($3k rent vs $200k).
- Cap rate 10.4% vs local median 4.5% in Irondequoit — top-decile yield for the area; either an underpriced asset or a hidden risk that comps aren't pricing in. Stress-test before assuming the spread holds.
Location & tenants
- Location reads 81/100 on livability (#92 in NY, #1,414 nationally) — a professional / high-income tenant draw. Strengths: housing A+, health & safety A+, crime B+; Watch: amenities F.
- West Irondequoit Central School District (suburban): math 73% / reading 70% proficiency, ranked #126 of 590 in NY (top 21%) — strong family-tenant draw, lease renewals of 3-5y typical; only 18% free/reduced lunch — higher-income household profile.
- Market conditions: 102 active listings in the ZIP; 3 comparable units currently listed for rent nearby; rentals at typical pace (median 14d on market — plan ~3-4 weeks tenant-placement turnaround); solid renter incomes; 1,169 units permitted in Monroe County in 2024 (591 in 5+ unit buildings).
- This rent runs 38% of the median local income ($90k/yr) — at the standard rent-burdened threshold; future hikes will face affordability resistance.
Forward outlook
- Local home prices are declining (-3.0%/yr); year-one equity from $1k of loan paydown is wiped out by about $6k of value loss. Plan a longer hold.
- Monroe County population projected to shrink 6% by 2050 — rents likely to lag national; underwrite the cash flow, not the appreciation.
- At projected returns (-3.0% appreciation + 3.0% rent growth), your $56k cash investment doubles in ~8 years — after that, you're playing with house money.
Negotiation context
- Only 7 days on market — expect competitive offers; lowballing is unlikely to land.
Risks & watch-outs
- Watch-outs: property tax is 2.7% of price; built in 1949 — expect roof / HVAC / electrical / plumbing capex.
Questions for the listing agent
- Built in 1949 — when were the roof, HVAC, electrical panel, plumbing, and water heater last replaced?
- Property tax is high relative to price — has the assessment been appealed recently, and will the sale trigger a re-assessment?
- Is there a deadline driving the sale (1031 exchange, divorce, estate, relocation)? That informs how much negotiation room exists.
- Schools are B-rated — typically a magnet for longer-tenancy family renters. What's the average tenant stay here, and is there a school-zone premium baked into asking?
- What's the average days-on-market for RENTAL listings here right now (not sales)? A rising rental-DOM trend means longer vacancies and softer asking-rent achievability than the comps imply.
- What's the recent tenant-quality profile in this submarket — average credit score on applications, eviction rate, late-payment / NSF rate, and stable-employment percentage? A property-management company in the area should have these aggregated.
- How much new for-sale + rental construction is in the pipeline within 1–3 miles? Heavy new supply typically softens prices + rents 12–24 months out; constrained supply supports both.
Investment metrics
- 1% rule
- 1.44% ✓
- Cap rate
- 10.42%
- Cash-on-cash
- 14.74%
- DSCR
- 1.66
- GRM
- 5.8
CMA / ARV
- ARV (on-the-fly)
- $291,540
- Comps found
- 12
Show comp detail 12 sales within ~0.75 mi
| Address | Dist | Beds/Ba | Sqft | Sold | Price | $/sf | Match |
|---|---|---|---|---|---|---|---|
| 62 Shorewood Dr | 0.09mi | 3/1.0 | 1,364 (+1%) | 5mo | $293,000 | $215 | 86 |
| 117 Shorewood Dr | 0.04mi | 3/1.0 | 1,395 (+3%) | 5mo | $260,000 | $186 | 86 |
| 539 Washington Ave | 0.29mi | 3/2.0 | 1,361 (+0%) | 1mo | $222,000 | $163 | 86 |
| 46 Dewey Ave | 0.31mi | 3/2.5 | 1,443 (+6%) | 4mo | $280,000 | $194 | 70 |
| 63 Shorewood Dr | 0.08mi | 3/1.0 | 1,556 (+15%) | 0mo | $210,000 | $135 | 67 |
| 37 Oakmount Dr | 0.57mi | 4/2.0 (+1) | 1,368 (+1%) | 1mo | $295,000 | $216 | 66 |
| 79 Norcrest Dr | 0.45mi | 3/1.5 | 1,268 (-6%) | 2mo | $256,600 | $202 | 64 |
| 173 Eaton Rd | 0.66mi | 3/1.5 | 1,332 (-2%) | 1mo | $302,000 | $227 | 64 |
| 36 Madison Ter | 0.60mi | 2/1.5 (-1) | 1,282 (-6%) | 5mo | $385,000 | $300 | 52 |
| 549 Turtle Rock Ln | 0.61mi | 3/1.5 | 1,506 (+11%) | 0mo | $653,000 | $434 | 51 |
| 50 Anchor | 0.63mi | 4/1.0 (+1) | 1,248 (-8%) | 2mo | $195,000 | $156 | 47 |
| 439 Rock Beach Rd | 0.53mi | 2/1.0 (-1) | 1,168 (-14%) | 3mo | $303,010 | $259 | 40 |
Match score weights: distance 35% · size 25% · config 20% · recency 20%. Top-matched comps best support the ARV.
Projected returns pro-forma
-3.0% appreciation · 3.0% rent growth · sell at horizon
- IRR
- 5.3%
- Equity multiple
- 1.21×
- Total profit
- $11,554
- Equity at exit
- $29,806
- IRR
- 14.8%
- Equity multiple
- 2.20×
- Total profit
- $67,119
- Equity at exit
- $17,284
Cash invested: $55,972 (down + closing). Projections, not guarantees.
Landlord ↔ Tenant lean methodology
- Overall (STATE)
- 15 Strongly Tenant-Friendly
- State New York
- 15 Strongly Tenant-Friendly · D+10
- County
- — inherits STATE
- City
- — inherits STATE
ZIP-level market 14617
- Active inventory
- 102
- Price-to-rent
- 5.8×
Monthly cashflow live
- Estimated rent
- $2,878 medium interval (Pro) →
- Mortgage (P&I)
- −$1,048
- Tax from tax record
- −$455 /mo · $5,459/yr
- Insurance
- −$83
- HOA
- −$0
- Vacancy / Maint / Mgmt
- −$604
- Net cashflow
- $687
Break-even live
UW: 25.0% down · 7.5% · 30yr · 1.5% tax · 5.0% vac · 8.0% maint · 8.0% mgmt
Financing live
Cash to close
- Down payment
- $49,975
- Closing costs
- $5,997
- Reserves months
- —
- Total cash needed
- —
Loan-product check · same deal, 3 products live
Conventional
25% down · 7.5% · 30yr
- Down + closing
- —
- Monthly P&I
- —
- Monthly cashflow
- —
- DSCR
- —
- Eligible?
- —
Personal DTI + credit; lowest rate.
DSCR
20% down · 8.5% · 30yr
- Down + closing
- —
- Monthly P&I
- —
- Monthly cashflow
- —
- DSCR
- —
- Eligible?
- —
No personal income docs; deal must DSCR.
Hard money
10% down · 12.0% · 12mo
- Down + closing
- —
- Monthly P&I
- —
- Monthly cashflow
- —
- DSCR
- —
- Eligible?
- —
Short-term bridge; refi at stabilization.
Rent comps 3 comps
| Address | Beds | Baths | Sqft | Rent | $/sqft | DOM | Units | Dist |
|---|---|---|---|---|---|---|---|---|
| 485 Oakridge Dr Rochester, NY | 3.0 | 1.5 | 1826 | $4,000 | $2.19 | 2d | 1 | 0.47mi |
| 37 Oakmount Dr Rochester, NY | 4.0 | 2.0 | 1368 | $2,500 | $1.83 | 14d | 1 | 0.59mi |
| 4302 Lake Ave Unit 1 Rochester, NY | 3.0 | 1.5 | 1600 | $3,000 | $1.88 | 43d | 1 | 1.21mi |
Listing history 2 events
-
2026-05-20status Pending
-
2026-05-13$199,900 Active
ⓘ Source: listings_history table (triggers on properties + properties_extension) + one-shot
backfill from property_details.listing_events for pre-trigger history.
Tax reassessment forecast NY · Partial reset (capped growth)
- Current annual tax
- $5,459 · $455/mo
- Projected year-2 tax
- $5,459 · $455/mo
- Expected delta
- $0/yr ($0/mo · 0.0%)
ⓘ Screening estimate from a state-policy table — verify with the county assessor before closing.
Climate risk First Street
- Flood 1/10 Low FEMA zone X (unshaded) · 0% chance over 30 yrs
- Wildfire 3/10 Moderate
- Heat 2/10 Low 7 d/yr ≥95°F today · 16 d/yr by 30 yrs out
- Wind 1/10 Low
- Air quality 2/10 Low 1 unhealthy d/yr today · 2 by 30 yrs out
Nearby sold comps map
Loading sold comps map…
Walkable amenities ~0.75 mi
Loading nearby amenities…
Taxation est. · year 1
- Rental income
- $34,540
- − Mortgage interest
- −$11,198
- − Property taxes
- −$5,459
- − Insurance
- −$1,000
- − Repairs & maintenance
- −$2,763
- − Management
- −$2,763
- − Depreciation
- −$5,815
- Taxable income
- $5,542
- Est. tax owed @ 24.0%
- −$1,330
- After-tax cash flow
- $6,918/yr
For passive investors: Depreciation is non-cash, so a rental often shows a tax loss while cash-flowing — sheltering income. Rental losses are passive: they offset passive income freely, and up to $25,000/yr can offset ordinary (W-2) income if you actively participate and your MAGI is under $100k (phasing out to $0 by $150k); unused losses carry forward. On sale, claimed depreciation is recaptured at up to 25%, and gains may owe capital-gains tax (a 1031 exchange can defer both). Figures are a year-1 estimate at your 24.0% rate — not tax advice; consult a CPA.
Schools (NCES district)
- District
- West Irondequoit Central School District
- NCES district ID
- 3615390
- Math proficiency
- 73% ▲ 3.00%
- Reading proficiency
- 70% ▲ 5.00%
- Median HH income
- $60,218
- Composite
- 61.61/100
- National rank
- #748
- State rank
- #126 of 590 in NY
Livability — Irondequoit
- Score
- 81/100
- State rank
- #92
- US rank
- #1414
Category grades
Schools grade is shown separately in the Schools card above.
Census & demographics
- Census place
- Irondequoit, NY
- County
- Monroe County · 674,131 people
- City population
- 74,252
- Metro
- Rochester, NY
- Population (ZIP)
- 21,788
- Household income
- $90,192
- Rent vs Own
- Severe rent burden
- 426.0
Population outlook (Monroe County) Hauer SSP2
- Today (2025)
- 759,460 people
- By 2030
- 757,154 · -0.3%
- By 2040
- 740,644 · -2.5%
- By 2050
- 714,443 · -5.9%
- By 2075
- 645,883 · -15.0%
- By 2100
- 547,084 · -28.0%
Race, ethnicity, and origin ACS 2023
- Neighborhood character
- Predominantly White (85%)
- Race & ethnicity
- White 85% Hispanic / Latino 8% Two or more races 6% Black 4%
- Hispanic origin (detail)
- Puerto Rican 4%
- Common ancestry
- Romanian 6% Iranian 3% Lithuanian 3%
- Foreign-born
- 4% · Canada
- Languages at home
- 93% English-only · Spanish 4% Other Indo-European 1% Russian/Polish/Slavic 1%
Political lean MEDSL · Monroe
- 2024 margin
- D (+19.1) · D 59.5% · R 40.5%
- 2008→2024 swing
- +1.4pp toward D · 2008: 17.7pp · 2024: 19.1pp
- All cycles
- 2024: D+19.1 2020: D+21.0 2016: D+14.1 2012: D+17.4 2008: D+17.7
Not yet ingested
- Civics
- —
Market trends
- HPI YoY
- ▼ -148.22%
- Current HPI
- 263.9973
- Rent YoY
- —
- Metro
- Rochester, NY
- State GDP YoY
- ▲ 2.60%
- F500 in state
- 92
Industry mix (Fortune 500 HQ in NY)
| Industry | F500 HQs | Revenue |
|---|---|---|
| Financial Services | 10 | $950B |
|
||
| Consumer Goods | 9 | $162B |
|
||
| Insurance | 4 | $225B |
|
||
| Telecommunications | 2 | $144B |
|
||
| Pharmaceuticals | 2 | $112B |
|
||
| Media / Entertainment | 2 | $69B |
|
||
Price history
2 events — show timeline
- 2026-05-20 Pending — UNYREIS
- 2026-05-13 Listed $199,900 UNYREIS
Property tax history
+3.2%/yrLatest (2025): $5,459 · +52.0% YoY. Source: county tax records.
Cash-flow waterfall
monthlySold comps — $/sqft
last 12 mo · ≤1 miLoading sold comps…