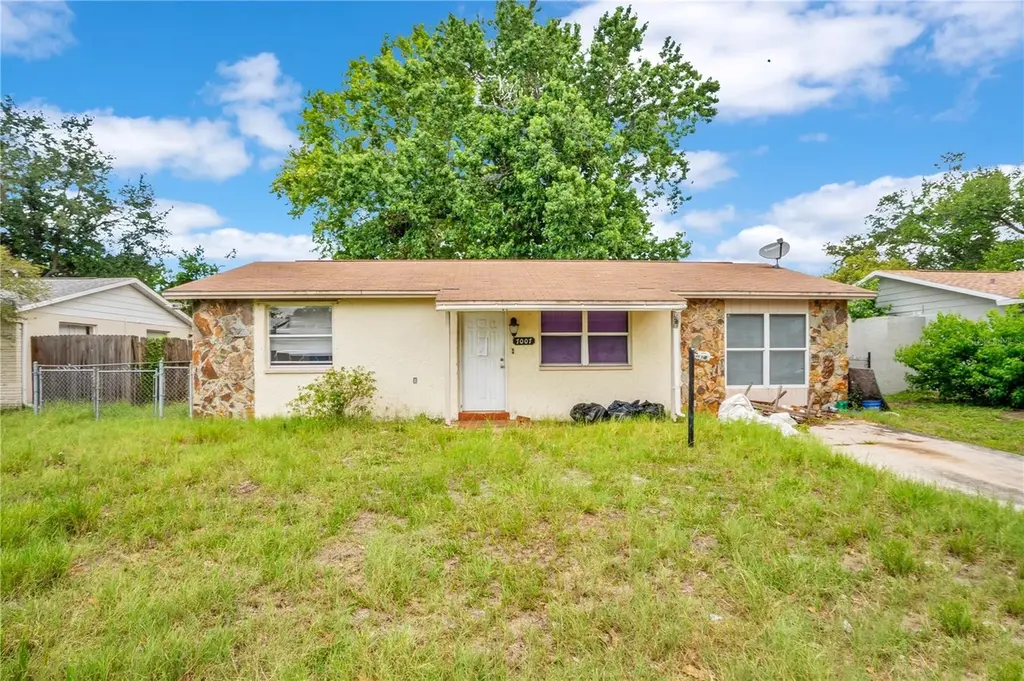
7007 Nova Scotia Dr · Jasmine Estates, FL
Flood risk 1/10 · Minimal
- FEMA flood zone
- X (unshaded)
- Chance of flooding over 30 yrs
- 0.0%
- Est. flood insurance / yr
- $507 – $1,088
Fire risk 4/10 · Minor
- Est. fire insurance / yr
- $947 – $1,759
Heat risk 10/10 · Severe
- Hot days now (above 109°F)
- 7 days/yr
- Hot days in 30 yrs
- 27 days/yr
Wind risk 10/10 · Severe
- Chance of severe wind over 30 yrs
- 99.0%
Air-quality risk 2/10 · Minimal
- Unhealthy air days now
- 1 days/yr
- Unhealthy air days in 30 yrs
- 3 days/yr
Risk factors via First Street. Map © Google.
Why this score? — see what drove the C grade
The composite is a weighted blend of 9 inputs, each scored 0–100. Each bar is that input's sub-score; the figure is the points it added to the 100-point composite (weight × sub-score).
- Cash flow +18.6/30.0
- ARV discount +15.0/15.0
- DSCR +5.8/10.0
- 1% rule +4.6/10.0
- Schools +4.3/10.0
- Livability +3.4/5.0
- Rent growth +2.8/5.0
- Condition / age +2.5/5.0
- Appreciation +0.0/10.0
$175,000
🖨 Deal sheet 📄 Offer letter ✓ Due diligence
Listing remarks MLS
PRICE REDUCED!!! Garage converted to living space (3rd bedroom). Needs work and is offered in AS IS condition.
Key facts
- 5,525 sq ft lot
- Built 1977
- Listed 4 days
Property features AI
Finance
- Other: Zoning: R4; Property type: Residential - Single family residence
- Financial info: No lease restrictions; Unfurnished
- HOA & community: Pets allowed
Exterior
- Parking: Driveway
- Utilities: Public water; Public sewer; Broadband/high-speed internet available; Public utilities
- Home design: Single family residence; One story; Faces south
- Construction: Block, concrete and stucco construction; Shingle roof; Slab foundation; Built on 0.13-acre lot
- Exterior features: Private mailbox; Asphalt road access
Interior
- Kitchen: No appliances included
- Bedrooms: 2 bedrooms
- Flooring: Other
- Bathrooms: 1 full bathroom
- Heating & cooling: Central heating (electric); Central air conditioning
- Interior features: Open floorplan
- Laundry & utility: Washer hookup; Electric dryer hookup
Neighborhood map
What this means for you Summary
Snapshot
- This is a 2-bed/1.0-bath single-family listed at $175k.
Deal economics
- At list price, monthly cash flow is $170 ($2k/yr) — positive.
- The deal already cash-flows at list — no discount required.
- To meet the 1% rule (rent ≥ 1% of price), the offer needs to be $169k (3.6% below list).
- Recommended offer: $169k (3.6% below list) — sets the bar for 1% rule.
- Cap rate 7.5% vs local median 4.7% in Jasmine Estates — top-decile yield for the area; either an underpriced asset or a hidden risk that comps aren't pricing in. Stress-test before assuming the spread holds.
Location & tenants
- Location reads 67/100 on livability (#555 in FL) — a middle-class / working-renter tenant base. Strengths: cost of living A+, housing A+, health & safety A+; Watch: crime D+, schools F, amenities F.
- Pasco (suburban): math 50% / reading 52% proficiency, ranked #32 of 73 in FL (top 44%) — acceptable for families but not a draw, mixed tenant base, ~2y average lease.
- Market conditions: Rents rising (+1.3%/yr); 577 active listings in the ZIP; 40 comparable units currently listed for rent nearby; rentals at typical pace (median 24d on market — plan ~3-4 weeks tenant-placement turnaround); 6,765 units permitted in Pasco County in 2024 (1,250 in 5+ unit buildings).
- This rent runs 43% of the median local income ($47k/yr) — at the standard rent-burdened threshold; future hikes will face affordability resistance.
Forward outlook
- Local home prices are declining (-3.0%/yr); year-one equity from $1k of loan paydown is wiped out by about $5k of value loss. Plan a longer hold.
- Pasco County population projected at +29% by 2050 — long-run rental-demand tailwind backs the buy-and-hold thesis.
Negotiation context
- Only 5 days on market — expect competitive offers; lowballing is unlikely to land.
- 5 sale attempts since 21y ago with the ask held roughly flat each time — persistent listings suggest the price (not the market) is what's stuck; bring a comps-based counter.
- Current owner paid $65k; list at $175k implies a 169% gain — meaningful room to come down on a strong offer.
Risks & watch-outs
- Climate carrying-cost: severe wind risk, 99% chance of damaging wind over 30y; extreme-heat days projected 7→27/yr by 2055 (HVAC capex compounding) — expect insurance premiums to compound above CPI over the hold.
Questions for the listing agent
- Built in 1977 — when were the roof, HVAC, electrical panel, plumbing, and water heater last replaced?
- Is there a deadline driving the sale (1031 exchange, divorce, estate, relocation)? That informs how much negotiation room exists.
- Schools are F-rated, which usually means shorter tenancies and higher turnover. Who's the typical renter profile here, and what's been the actual vacancy rate?
- Crime grade is D in this area — have there been break-ins, vandalism, or insurance claims at this property in the last 3 years? What carrier currently insures it and at what premium?
- What's the average days-on-market for RENTAL listings here right now (not sales)? A rising rental-DOM trend means longer vacancies and softer asking-rent achievability than the comps imply.
- What's the recent tenant-quality profile in this submarket — average credit score on applications, eviction rate, late-payment / NSF rate, and stable-employment percentage? A property-management company in the area should have these aggregated.
- How much new for-sale + rental construction is in the pipeline within 1–3 miles? Heavy new supply typically softens prices + rents 12–24 months out; constrained supply supports both.
Investment metrics
- 1% rule
- 0.96% ✗
- Cap rate
- 7.46%
- Cash-on-cash
- 4.15%
- DSCR
- 1.18
- GRM
- 8.6
CMA / ARV
- ARV (on-the-fly)
- $231,264
- Comps found
- 12
Show comp detail 12 sales within ~0.75 mi
| Address | Dist | Beds/Ba | Sqft | Sold | Price | $/sf | Match |
|---|---|---|---|---|---|---|---|
| 7130 Isle Dr | 0.27mi | 2/2.0 | 1,048 (-1%) | 1mo | $300,000 | $286 | 81 |
| 9330 Saint Regis Ln | 0.58mi | 3/1.0 (+1) | 1,040 (-2%) | 1mo | $227,500 | $219 | 65 |
| 9315 Palm Ave | 0.53mi | 2/2.0 | 1,012 (-4%) | 6mo | $229,000 | $226 | 60 |
| 9105 Lunar Ln | 0.73mi | 2/1.0 | 1,038 (-2%) | 5mo | $214,900 | $207 | 59 |
| 8915 Chilton Dr | 0.61mi | 2/1.0 | 974 (-8%) | 1mo | $194,900 | $200 | 58 |
| 8634 Velvet Dr | 0.31mi | 3/1.0 (+1) | 1,208 (+14%) | 1mo | $219,000 | $181 | 56 |
| 6432 Juniper Rd | 0.57mi | 2/2.0 | 980 (-7%) | 5mo | $189,900 | $194 | 53 |
| 6331 Ridge Crest Dr | 0.65mi | 2/2.0 | 980 (-7%) | 5mo | $235,000 | $240 | 50 |
| 9405 Gableton Ln | 0.72mi | 2/2.0 | 1,133 (+7%) | 1mo | $250,000 | $221 | 49 |
| 9300 W Cochise Ln | 0.53mi | 3/2.0 (+1) | 1,187 (+12%) | 1mo | $239,900 | $202 | 45 |
| 9030 Unicorn Ave | 0.59mi | 3/1.0 (+1) | 928 (-12%) | 6mo | $210,000 | $226 | 42 |
| 6318 Ridge Crest Dr | 0.68mi | 3/2.0 (+1) | 1,191 (+13%) | 3mo | $261,000 | $219 | 36 |
Match score weights: distance 35% · size 25% · config 20% · recency 20%. Top-matched comps best support the ARV.
Projected returns pro-forma
-3.0% appreciation · 1.28% rent growth · sell at horizon
- IRR
- -11.7%
- Equity multiple
- 0.58×
- Total profit
- $-20,425
- Equity at exit
- $26,093
- IRR
- -5.2%
- Equity multiple
- 0.69×
- Total profit
- $-15,259
- Equity at exit
- $15,131
Cash invested: $49,000 (down + closing). Projections, not guarantees.
Landlord ↔ Tenant lean methodology
- Overall (STATE)
- 87 Strongly Landlord-Friendly
- State Florida
- 87 Strongly Landlord-Friendly · R+3
- County
- — inherits STATE
- City
- — inherits STATE
ZIP-level market 34668
- Home prices YoY
- -17.4%
- Rents YoY
- 1.3%
- Active inventory
- 577
- Price-to-rent
- 8.6×
Monthly cashflow live
- Estimated rent
- $1,686 high interval (Pro) →
- Mortgage (P&I)
- −$918
- Tax from tax record
- −$172 /mo · $2,062/yr
- Insurance
- −$73
- HOA
- −$0
- Vacancy / Maint / Mgmt
- −$354
- Net cashflow
- $170
Break-even live
UW: 25.0% down · 7.5% · 30yr · 1.5% tax · 5.0% vac · 8.0% maint · 8.0% mgmt
Financing live
Cash to close
- Down payment
- $43,750
- Closing costs
- $5,250
- Reserves months
- —
- Total cash needed
- —
Loan-product check · same deal, 3 products live
Conventional
25% down · 7.5% · 30yr
- Down + closing
- —
- Monthly P&I
- —
- Monthly cashflow
- —
- DSCR
- —
- Eligible?
- —
Personal DTI + credit; lowest rate.
DSCR
20% down · 8.5% · 30yr
- Down + closing
- —
- Monthly P&I
- —
- Monthly cashflow
- —
- DSCR
- —
- Eligible?
- —
No personal income docs; deal must DSCR.
Hard money
10% down · 12.0% · 12mo
- Down + closing
- —
- Monthly P&I
- —
- Monthly cashflow
- —
- DSCR
- —
- Eligible?
- —
Short-term bridge; refi at stabilization.
Rent comps 40 comps
| Address | Beds | Baths | Sqft | Rent | $/sqft | DOM | Units | Dist |
|---|---|---|---|---|---|---|---|---|
| 7125 Sandalwood Dr Port Richey, FL | 2.0 | 2.0 | 1324 | $1,681 | $1.27 | 5d | 1 | 0.17mi |
| 9035 Cochise Ln Port Richey, FL | 3.0 | 2.0 | 1095 | $1,395 | $1.27 | 14d | 1 | 0.35mi |
| 8712 Roble Way Port Richey, FL | 3.0 | 2.0 | 1134 | $1,841 | $1.62 | 24d | 1 | 0.40mi |
| 8356 Journet Blvd Port Richey, FL | 1.0–2.0 | 1.0 | 843 | $1,315 | $1.56 | 24d | 1 | 0.43mi |
| 9110 Saint Clair Ln Port Richey, FL | 2.0 | 2.0 | 730 | $2,100 | $2.88 | 24d | 1 | 0.44mi |
| 8540 Robilina Rd Port Richey, FL | 1.0–2.0 | 1.0 | 722 | $1,432 | $1.98 | 3d | 14 | 0.50mi |
| 7034 Coral Reef Dr Port Richey, FL | 3.0 | 2.0 | 1325 | $1,795 | $1.35 | 24d | 1 | 0.50mi |
| 7435 San Miguel Dr Port Richey, FL | 2.0 | 2.0 | 1136 | $1,500 | $1.32 | 20d | 1 | 0.51mi |
| 9304 Saint Regis Ln Port Richey, FL | 2.0 | 2.0 | 1356 | $1,550 | $1.14 | 22d | 1 | 0.52mi |
| 7501 San Moritz Dr Port Richey, FL | 3.0 | 2.0 | 1412 | $1,600 | $1.13 | 24d | 1 | 0.57mi |
| 6412 Pawling Ave Port Richey, FL | 2.0 | 1.0 | 806 | $1,750 | $2.17 | 24d | 1 | 0.58mi |
| 9130 Chatam Ln Port Richey, FL | 2.0 | 2.0 | 1212 | $1,623 | $1.34 | 22d | 1 | 0.64mi |
| 6431 Citation Dr Port Richey, FL | 3.0 | 1.0 | 1009 | $1,681 | $1.67 | 5d | 1 | 0.64mi |
| 9211 Chatam Ln Port Richey, FL | 3.0 | 2.0 | 1176 | $2,215 | $1.88 | 20d | 1 | 0.66mi |
| 9425 Saint Regis Ln Port Richey, FL | 2.0 | 2.0 | 1380 | $1,700 | $1.23 | 24d | 1 | 0.67mi |
| 6935 Twilite Dr Port Richey, FL | 2.0 | 1.0 | 1032 | $1,450 | $1.41 | 16d | 1 | 0.68mi |
| 9202 Suffolk Ln Port Richey, FL | 2.0 | 2.0 | 1038 | $1,450 | $1.40 | 14d | 1 | 0.70mi |
| 9202 Suffolk Ln Port Richey, FL | 2.0 | 2.0 | 1038 | $1,450 | $1.40 | 24d | 1 | 0.70mi |
| 9210 Pegasus Ave Port Richey, FL | 2.0 | 1.5 | 768 | $1,400 | $1.82 | 5d | 1 | 0.74mi |
| 7605 Embassy Blvd Port Richey, FL | 3.0 | 2.0 | 1278 | $2,350 | $1.84 | 12d | 1 | 0.74mi |
| 7605 Embassy Blvd Unit 1 Port Richey, FL | 3.0 | 2.0 | 1469 | $2,350 | $1.60 | 24d | 1 | 0.74mi |
| 8910 Elm Leaf Ct Port Richey, FL | 2.0 | 2.0 | 1248 | $1,650 | $1.32 | 5d | 1 | 0.75mi |
| 7301 Moravian Dr Port Richey, FL | 3.0 | 2.0 | 1325 | $1,806 | $1.36 | 5d | 1 | 0.76mi |
| 9105 Hermitage Ln Port Richey, FL | 3.0 | 2.0 | 1442 | $1,900 | $1.32 | 24d | 1 | 0.77mi |
| 7741 Forest Trl #3 Port Richey, FL | 2.0 | 2.0 | 1010 | $1,500 | $1.49 | 24d | 1 | 0.80mi |
| 8228 Chasco Woods Blvd Port Richey, FL | 1.0–3.0 | 1.0–2.0 | 966 | $1,388 | $1.44 | 1d | 22 | 0.82mi |
| 9100 Hunt Club Ln Port Richey, FL | 2.0 | 2.0 | 1365 | $1,850 | $1.36 | 22d | 1 | 0.83mi |
| 7325 Ivanhoe Dr Port Richey, FL | 3.0 | 1.0 | 984 | $1,800 | $1.83 | 11d | 1 | 0.93mi |
| 7224 Potomac Dr Port Richey, FL | 3.0 | 2.0 | 1208 | $1,595 | $1.32 | 24d | 1 | 0.96mi |
| 6920 Tierra Verde St Port Richey, FL | 3.0 | 2.0 | 1478 | $1,850 | $1.25 | 24d | 1 | 0.99mi |
| 7040 Brentwood Dr Unit NA Port Richey, FL | 2.0 | 1.0 | 880 | $1,600 | $1.82 | 20d | 1 | 1.10mi |
| 9741 Scenic Dr Port Richey, FL | 3.0 | 2.0 | 1246 | $1,800 | $1.44 | 4d | 1 | 1.12mi |
| 9103 Westby Ln Port Richey, FL | 2.0 | 1.0 | 840 | $1,995 | $2.38 | 24d | 1 | 1.13mi |
| 6831 Tierra Linda St Port Richey, FL | 3.0 | 2.0 | 1478 | $1,595 | $1.08 | 24d | 1 | 1.14mi |
| 8026 Colrain Dr Port Richey, FL | 3.0 | 1.0 | 1080 | $1,545 | $1.43 | 24d | 1 | 1.16mi |
| 6430 Lomand Ave New Port Richey, FL | 2.0 | 1.5 | 952 | $1,550 | $1.63 | 24d | 1 | 1.21mi |
| 7212 Carlton Arms Dr New Port Richey, FL | 2.0 | 1.0–2.0 | 877 | $1,609 | $1.83 | 24d | 1 | 1.22mi |
| 5848 Siesta Ln Port Richey, FL | 2.0 | 1.0 | 800 | $1,250 | $1.56 | 12d | 1 | 1.24mi |
| 9826 Pocono St Port Richey, FL | 2.0 | 2.0 | 1072 | $1,650 | $1.54 | 24d | 1 | 1.25mi |
| 9300 Whitman Ln Port Richey, FL | 3.0 | 1.0 | 920 | $1,695 | $1.84 | 24d | 1 | 1.26mi |
Listing history 4 events
-
2026-06-03days on market $175,000 Active 5 DOM
-
2026-06-02days on market $175,000 Active 4 DOM
-
2026-06-01days on market $175,000 Active 3 DOM
-
2026-05-31days on market $175,000 Active 2 DOM
ⓘ Source: listings_history table (triggers on properties + properties_extension) + one-shot
backfill from property_details.listing_events for pre-trigger history.
Tax reassessment forecast FL · Resets to sale price
- Current annual tax
- $2,062 · $172/mo
- Projected year-2 tax
- $2,062 · $172/mo
- Expected delta
- $0/yr ($0/mo · 0.0%)
ⓘ Screening estimate from a state-policy table — verify with the county assessor before closing.
Climate risk First Street
- Flood 1/10 Low FEMA zone X (unshaded) · 0% chance over 30 yrs
- Wildfire 4/10 Moderate
- Heat 10/10 Extreme 7 d/yr ≥109°F today · 27 d/yr by 30 yrs out
- Wind 10/10 Extreme 99% chance of damaging wind over 30 yrs
- Air quality 2/10 Low 1 unhealthy d/yr today · 3 by 30 yrs out
Nearby sold comps map
Loading sold comps map…
Walkable amenities ~0.75 mi
Loading nearby amenities…
Taxation est. · year 1
- Rental income
- $20,234
- − Mortgage interest
- −$9,803
- − Property taxes
- −$2,062
- − Insurance
- −$875
- − Repairs & maintenance
- −$1,619
- − Management
- −$1,619
- − Depreciation
- −$5,091
- Taxable loss
- −$833
- Est. tax savings @ 24.0%
- +$200
- After-tax cash flow
- $2,236/yr
For passive investors: Depreciation is non-cash, so a rental often shows a tax loss while cash-flowing — sheltering income. Rental losses are passive: they offset passive income freely, and up to $25,000/yr can offset ordinary (W-2) income if you actively participate and your MAGI is under $100k (phasing out to $0 by $150k); unused losses carry forward. On sale, claimed depreciation is recaptured at up to 25%, and gains may owe capital-gains tax (a 1031 exchange can defer both). Figures are a year-1 estimate at your 24.0% rate — not tax advice; consult a CPA.
Schools (NCES district)
- District
- Pasco
- NCES district ID
- 1201530
- Math proficiency
- 50% ▼ -10.00%
- Reading proficiency
- 52% ▼ -5.00%
- Median HH income
- $45,039
- Composite
- 43.14/100
- National rank
- #3074
- State rank
- #32 of 73 in FL
Livability — Jasmine Estates
- Score
- 67/100
- State rank
- #555
- US rank
- #10561
Category grades
Schools grade is shown separately in the Schools card above.
Census & demographics
- Census place
- Jasmine Estates, FL
- County
- Pasco County · 524,098 people
- Metro
- Tampa-St. Petersburg-Clearwater, FL
- Population (ZIP)
- 49,442
- Household income
- $47,401
- Rent vs Own
- Severe rent burden
- 2699.0
Population outlook (Pasco County) Hauer SSP2
- Today (2025)
- 570,045 people
- By 2030
- 605,844 · +6.3%
- By 2040
- 674,806 · +18.4%
- By 2050
- 736,022 · +29.1%
- By 2075
- 862,900 · +51.4%
- By 2100
- 906,364 · +59.0%
Race, ethnicity, and origin ACS 2023
- Neighborhood character
- Predominantly White (70%)
- Race & ethnicity
- White 70% Hispanic / Latino 23% Two or more races 14% Black 4%
- Hispanic origin (detail)
- Mexican 3% Puerto Rican 10% Cuban 5% Dominican 1%
- Common ancestry
- Romanian 3% Lithuanian 3% Slovak 2%
- Foreign-born
- 11% · Canada, Jamaica
- Languages at home
- 82% English-only · Spanish 14% Other Indo-European 1% French/Haitian/Cajun 1%
Political lean MEDSL · Pasco
- 2024 margin
- Strong R (+25.2) · D 36.9% · R 62.1% · Other 1.0%
- 2008→2024 swing
- -21.6pp toward R · 2008: -3.6pp · 2024: -25.2pp
- All cycles
- 2024: R+25.2 2020: R+20.1 2016: R+21.6 2012: R+6.7 2008: R+3.6
Not yet ingested
- Civics
- —
Market trends
- HPI YoY
- ▼ -75.64%
- Current HPI
- 359.7163
- Rent YoY
- ▲ 1.28%
- Metro
- Tampa-St. Petersburg-Clearwater, FL
- State GDP YoY
- ▲ 3.28%
- F500 in state
- 36
Industry mix (Fortune 500 HQ in FL)
| Industry | F500 HQs | Revenue |
|---|---|---|
| Industrial Technology | 2 | $29B |
|
||
| Insurance | 2 | $17B |
|
||
| Retail | 1 | $60B |
|
||
| Technology Distribution | 1 | $58B |
|
||
| Homebuilding | 1 | $35B |
|
||
| Technology Manufacturing | 1 | $35B |
|
||
Price history
+216.5% since first listed11 events — show timeline
- 2026-05-29 Listed $175,000 Stellar MLS as Distributed by MLS Grid
- 2008-05-23 Listed $119,999 Stellar MLS as Distributed by MLS Grid
- 2007-09-12 Sold (MLS) $65,000 HCAR
- 2007-04-11 Listed $72,000 HCAR
- 2006-11-17 Listing Removed — Stellar MLS as Distributed by MLS Grid
- 2006-09-02 Listed $144,900 Stellar MLS as Distributed by MLS Grid
- 2005-08-03 Sold (Public Records) $116,500 Public Records
- 2005-07-22 Sold (MLS) $116,500 Stellar MLS as Distributed by MLS Grid
- 2005-06-03 Listed $116,500 Stellar MLS as Distributed by MLS Grid
- 1999-01-04 Sold (Public Records) $37,000 Public Records
- 1995-12-27 Sold (Public Records) $55,300 Public Records
Property tax history
+8.8%/yrLatest (2025): $2,062 · +2.2% YoY. Source: county tax records.
Cash-flow waterfall
monthlySold comps — $/sqft
last 12 mo · ≤1 miLoading sold comps…