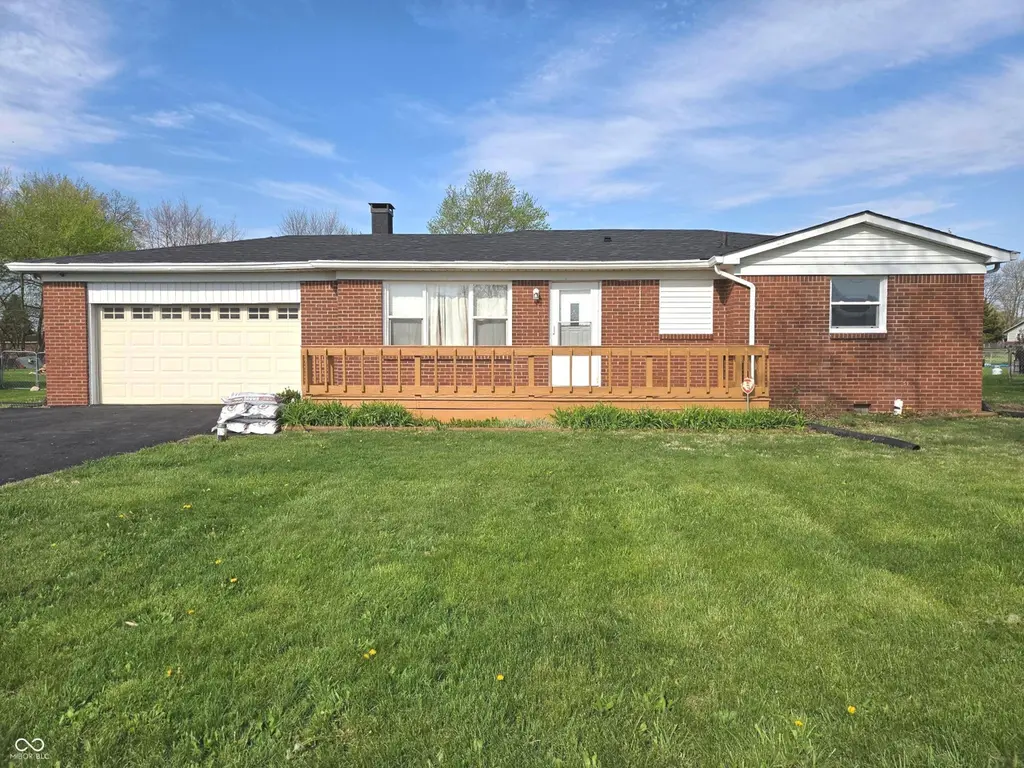
3528 Horner Dr · Indianapolis city (balance), IN
Flood risk 1/10 · Minimal
- FEMA flood zone
- X (unshaded)
- Chance of flooding over 30 yrs
- 0.0%
- Est. flood insurance / yr
- $507 – $1,088
Fire risk 1/10 · Minimal
- Est. fire insurance / yr
- $717 – $1,331
Heat risk 3/10 · Minor
- Hot days now (above 102°F)
- 7 days/yr
- Hot days in 30 yrs
- 19 days/yr
Wind risk 2/10 · Minimal
- Chance of severe wind over 30 yrs
- 1.0%
Air-quality risk 2/10 · Minimal
- Unhealthy air days now
- 1 days/yr
- Unhealthy air days in 30 yrs
- 2 days/yr
Risk factors via First Street. Map © Google.
Why this score? — see what drove the D- grade
The composite is a weighted blend of 9 inputs, each scored 0–100. Each bar is that input's sub-score; the figure is the points it added to the 100-point composite (weight × sub-score).
- Cash flow +14.1/30.0
- DSCR +4.3/10.0
- Rent growth +4.0/5.0
- Schools +4.0/10.0
- 1% rule +3.3/10.0
- Livability +2.5/5.0
- Condition / age +2.5/5.0
- ARV discount +2.0/15.0
- Appreciation +0.0/10.0
$224,900
🖨 Deal sheet (PDF) 📄 Offer letter ✓ Due diligence
Listing remarks MLS
HUD HOME - PROPERTY SOLD IN "AS-IS" CONDITION. FOR MORE INFORMATION AND AVAILABILITY, PLEASE SEE THE WEB ADDRESS LISTED IN AGENT REMARKS OR SPEAK WITH YOUR REAL ESTATE AGENT. ALL INFORMATION DEEMED RELIABLE BUT NOT GUARANTEED. CASE NUMBER 151-616867
Key facts
- All brick ranch
- Easy access to i-465
- Fenced backyard
Tags
Property features AI
Exterior
- Parking: Attached garage with 2 spaces
- Utilities: Municipal sewer (connected); Private water source; Solid waste service available
- Home design: Single-family residence; One story
- Construction: Brick construction; Crawl space foundation
- Exterior features: Approximately 0.39-acre lot (1/4–1/2 acre)
Interior
- Kitchen: Electric oven; Range hood; Refrigerator; Eat-in kitchen layout
- Bedrooms: Three bedrooms on the main level
- Bathrooms: One full bathroom; One half bathroom (main level)
- Heating & cooling: Forced air heating (natural gas); Central air conditioning
- Interior features: Attic access; Eat-in kitchen; Water softener (owned); ENERGY STAR qualified appliances; ENERGY STAR qualified water heater; Electric water heater
- Laundry & utility: Main-level laundry room; Water softener (owned)
Neighborhood map
What this means for you Summary
Snapshot
- This is a 3-bed/1.5-bath single-family listed at $225k.
Deal economics
- At list price, monthly cash flow is $34 ($405/yr) — positive.
- The deal already cash-flows at list — no discount required.
- To meet the 1% rule (rent ≥ 1% of price), the offer needs to be $187k (16.8% below list).
- Recommended offer: $187k (16.8% below list) — sets the bar for 1% rule.
- Cap rate 6.5% vs local median 4.4% in Indianapolis city (balance) — top-decile yield for the area; either an underpriced asset or a hidden risk that comps aren't pricing in. Stress-test before assuming the spread holds.
Location & tenants
- Location reads: area grade D — affects rentability + tenant quality, not the cash-flow math above.
- Franklin Township Community School Corporation (urban): math 42% / reading 47% proficiency, ranked #87 of 301 in IN (top 29%) — families likely to look elsewhere, expect single-tenant / working-renter base with shorter leases.
- Zoned schools: Franklin Central Junior High (math 31% / reading 40%, grade F, #162 of 330 statewide, top 49%, 1,711 students, 51% FRL); Franklin Central High School (math 41% / reading 69%, grade C, #77 of 369 statewide, top 21%, 3,319 students, 46% FRL) — zoned schools average 48% FRL vs 29% district-wide (20 pts higher); higher-poverty schools than district average — tighter screening recommended.
- Market conditions: Rents rising fast (+6.1%/yr); 337 active listings in the ZIP; 12 comparable units currently listed for rent nearby; rentals leasing fast (median 6d on market — plan ~1-2 weeks tenant-placement turnaround); solid renter incomes; 1,906 units permitted in Marion County in 2024 (621 in 5+ unit buildings).
Forward outlook
- Local home prices are declining (-3.0%/yr); year-one equity from $2k of loan paydown is wiped out by about $7k of value loss. Plan a longer hold.
- Marion County population projected at +18% by 2050 — long-run rental-demand tailwind backs the buy-and-hold thesis.
Negotiation context
- It's been on market 21 days — a 2% lower offer ($222k) is reasonable based on typical stale-listing flexibility.
- 2 sale attempts since 16y ago with the ask held roughly flat each time — persistent listings suggest the price (not the market) is what's stuck; bring a comps-based counter.
- Current owner paid $31k; list at $225k implies a 634% gain — meaningful room to come down on a strong offer.
Risks & watch-outs
- Watch-outs: built in 1958 — expect roof / HVAC / electrical / plumbing capex.
Questions for the listing agent
- Built in 1958 — when were the roof, HVAC, electrical panel, plumbing, and water heater last replaced?
- Is there a deadline driving the sale (1031 exchange, divorce, estate, relocation)? That informs how much negotiation room exists.
- The area grade is low — what's the realistic commute time and amenity access for the typical tenant pool here? Any planned neighborhood developments (good or bad) we should know about?
- What's the average days-on-market for RENTAL listings here right now (not sales)? A rising rental-DOM trend means longer vacancies and softer asking-rent achievability than the comps imply.
- What's the recent tenant-quality profile in this submarket — average credit score on applications, eviction rate, late-payment / NSF rate, and stable-employment percentage? A property-management company in the area should have these aggregated.
- How much new for-sale + rental construction is in the pipeline within 1–3 miles? Heavy new supply typically softens prices + rents 12–24 months out; constrained supply supports both.
Investment metrics
- 1% rule
- 0.83% ✗
- Cap rate
- 6.47%
- Cash-on-cash
- 0.64%
- DSCR
- 1.03
- GRM
- 10.0
CMA / ARV
- ARV (on-the-fly)
- $200,600
- Comps found
- 10
Show comp detail 10 sales within ~0.75 mi
| Address | Dist | Beds/Ba | Sqft | Sold | Price | $/sf | Match |
|---|---|---|---|---|---|---|---|
| 3528 Horner Dr | 0.00mi | 3/1.5 | 1,003 (0%) | 0mo | $224,900 | $224 | 100 |
| 3112 S Kercheval Dr | 0.52mi | 3/1.0 | 975 (-3%) | 3mo | $196,000 | $201 | 67 |
| 3901 Horner Dr | 0.30mi | 2/1.0 (-1) | 1,053 (+5%) | 9mo | $219,900 | $209 | 63 |
| 3809 Wildwood Dr | 0.38mi | 3/1.0 | 1,086 (+8%) | 10mo | $203,500 | $187 | 58 |
| 7326 Southeastern Ave | 0.30mi | 3/1.0 | 1,089 (+9%) | 15mo | $219,900 | $202 | 57 |
| 3020 S Kercheval Dr | 0.62mi | 3/1.0 | 960 (-4%) | 10mo | $170,000 | $177 | 54 |
| 3124 S Richardt Ave | 0.47mi | 3/1.0 | 1,123 (+12%) | 4mo | $222,000 | $198 | 53 |
| 7231 E Troy Ave | 0.68mi | 2/1.0 (-1) | 952 (-5%) | 2mo | $164,000 | $172 | 52 |
| 3038 S Richardt Ave | 0.55mi | 3/1.0 | 1,096 (+9%) | 10mo | $215,000 | $196 | 49 |
| 7155 E Hanna Ave | 0.57mi | 3/1.0 | 1,100 (+10%) | 22mo | $220,000 | $200 | 37 |
Match score weights: distance 35% · size 25% · config 20% · recency 20%. Top-matched comps best support the ARV.
Projected returns pro-forma
-3.0% appreciation · 6.11% rent growth · sell at horizon
- IRR
- -12.1%
- Equity multiple
- 0.55×
- Total profit
- $-28,297
- Equity at exit
- $33,533
- IRR
- 0.9%
- Equity multiple
- 1.07×
- Total profit
- $4,368
- Equity at exit
- $19,445
Cash invested: $62,972 (down + closing). Projections, not guarantees.
Landlord ↔ Tenant lean methodology
- Overall (STATE)
- 90 Strongly Landlord-Friendly
- State Indiana
- 90 Strongly Landlord-Friendly · R+11
- County
- — inherits STATE
- City
- — inherits STATE
ZIP-level market 46239
- Home prices YoY
- -29.2%
- Rents YoY
- 6.1%
- Active inventory
- 337
- Price-to-rent
- 10.0×
Monthly cashflow live
- Estimated rent
- $1,870 high interval (Pro) →
- Mortgage (P&I)
- −$1,179
- Tax from tax record
- −$171 /mo · $2,049/yr
- Insurance
- −$94
- HOA
- −$0
- Vacancy / Maint / Mgmt
- −$393
- Net cashflow
- $34
Break-even live
Sensitivity live
| Price | -10% $161 | -5% $97 | +0% $34 | +5% $-30 | +10% $-94 |
|---|---|---|---|---|---|
| Rent | -10% $-114 | -5% $-40 | +0% $34 | +5% $108 | +10% $182 |
| Rate | -1.0pp $147 | -0.5pp $91 | base $34 | +0.5pp $-25 | +1.0pp $-84 |
UW: 25.0% down · 7.5% · 30yr · 1.5% tax · 5.0% vac · 8.0% maint · 8.0% mgmt
Financing live
Cash to close
- Down payment
- $56,225
- Closing costs
- $6,747
- Reserves months
- —
- Total cash needed
- —
Loan-product check · same deal, 3 products live
Conventional
25% down · 7.5% · 30yr
- Down + closing
- —
- Monthly P&I
- —
- Monthly cashflow
- —
- DSCR
- —
- Eligible?
- —
Personal DTI + credit; lowest rate.
DSCR
20% down · 8.5% · 30yr
- Down + closing
- —
- Monthly P&I
- —
- Monthly cashflow
- —
- DSCR
- —
- Eligible?
- —
No personal income docs; deal must DSCR.
Hard money
10% down · 12.0% · 12mo
- Down + closing
- —
- Monthly P&I
- —
- Monthly cashflow
- —
- DSCR
- —
- Eligible?
- —
Short-term bridge; refi at stabilization.
Rent comps 12 comps
| Address | Beds | Baths | Sqft | Rent | $/sqft | DOM | Units | Dist |
|---|---|---|---|---|---|---|---|---|
| 3203 Brandenburg Dr Indianapolis, IN | 4.0 | 2.5 | 1486 | $1,869 | $1.26 | 5d | 1 | 0.46mi |
| 3146 Brandenburg Dr Indianapolis, IN | 3.0 | 2.0 | 1200 | $1,689 | $1.41 | 5d | 1 | 0.46mi |
| 3149 Brandenburg Dr Indianapolis, IN | 4.0 | 2.5 | 1486 | $1,885 | $1.27 | 6d | 1 | 0.47mi |
| 3718 Laurel Cherry Ln Indianapolis, IN | 3.0 | 2.0 | 1368 | $1,695 | $1.24 | 25d | 1 | 0.57mi |
| 2825 Ludwig Dr Indianapolis, IN | 4.0 | 2.0 | 1500 | $2,056 | $1.37 | 25d | 1 | 0.87mi |
| 8520 Sierra Ridge Dr Indianapolis, IN | 2.0–3.0 | 2.0 | 1091 | $1,775 | $1.63 | 0d | 17 | 0.94mi |
| 8544 Sweet Birch Dr Indianapolis, IN | 3.0 | 2.0 | 1209 | $1,670 | $1.38 | 0d | 1 | 1.03mi |
| 6543 E Hanna Ave Indianapolis, IN | 2.0–4.0 | 2.0 | 1312 | $1,479 | $1.13 | 0d | 1 | 1.13mi |
| 4127 S Post Rd Indianapolis, IN | 3.0 | 2.0 | 1460 | $1,585 | $1.09 | 25d | 1 | 1.49mi |
| 6050 Castleford Dr Indianapolis, IN | 2.0–4.0 | 1.0–2.0 | 1147 | $1,525 | $1.33 | 4d | 3 | 1.49mi |
| 6012 Castleford Dr Indianapolis, IN | 2.0 | 1.0 | 945 | $1,325 | $1.40 | 25d | 1 | 1.49mi |
| 6014 Castleford Dr Indianapolis, IN | 3.0 | 2.0 | 1242 | $1,525 | $1.23 | 25d | 1 | 1.50mi |
Listing history 6 events
-
2026-05-10status Pending
-
2026-04-19$224,900 Active
-
2011-01-06historical 261-char remark
Show marketing remark (261 chars)
HUD HOME - PROPERTY SOLD IN "AS-IS" CONDITION. FOR MORE INFORMATION AND AVAILABILITY, PLEASE SEE THE WEB ADDRESS LISTED IN AGENT REMARKS OR SPEAK WITH YOUR REAL ESTATE AGENT. ALL INFORMATION DEEMED RELIABLE BUT NOT GUARANTEED. CASE NUMBER 151-616867
-
2010-12-17soldstatus $30,660 261-char remark
Show marketing remark (261 chars)
HUD HOME - PROPERTY SOLD IN "AS-IS" CONDITION. FOR MORE INFORMATION AND AVAILABILITY, PLEASE SEE THE WEB ADDRESS LISTED IN AGENT REMARKS OR SPEAK WITH YOUR REAL ESTATE AGENT. ALL INFORMATION DEEMED RELIABLE BUT NOT GUARANTEED. CASE NUMBER 151-616867
-
2010-10-14$34,000 261-char remark
Show marketing remark (261 chars)
HUD HOME - PROPERTY SOLD IN "AS-IS" CONDITION. FOR MORE INFORMATION AND AVAILABILITY, PLEASE SEE THE WEB ADDRESS LISTED IN AGENT REMARKS OR SPEAK WITH YOUR REAL ESTATE AGENT. ALL INFORMATION DEEMED RELIABLE BUT NOT GUARANTEED. CASE NUMBER 151-616867
-
2000-12-12soldstatus $85,698
ⓘ Source: listings_history table (triggers on properties + properties_extension) + one-shot
backfill from property_details.listing_events for pre-trigger history.
Tax reassessment forecast IN · Partial reset (capped growth)
- Current annual tax
- $2,049 · $171/mo
- Projected year-2 tax
- $2,049 · $171/mo
- Expected delta
- $0/yr ($0/mo · 0.0%)
ⓘ Screening estimate from a state-policy table — verify with the county assessor before closing.
Climate risk First Street
- Flood 1/10 Low FEMA zone X (unshaded) · 0% chance over 30 yrs
- Wildfire 1/10 Low
- Heat 3/10 Moderate 7 d/yr ≥102°F today · 19 d/yr by 30 yrs out
- Wind 2/10 Low 100% chance of damaging wind over 30 yrs
- Air quality 2/10 Low 1 unhealthy d/yr today · 2 by 30 yrs out
Nearby sold comps map
Loading sold comps map…
Walkable amenities ~0.75 mi
Loading nearby amenities…
Taxation est. · year 1
- Rental income
- $22,445
- − Mortgage interest
- −$12,598
- − Property taxes
- −$2,049
- − Insurance
- −$1,124
- − Repairs & maintenance
- −$1,796
- − Management
- −$1,796
- − Depreciation
- −$6,543
- Taxable loss
- −$3,460
- Est. tax savings @ 24.0%
- +$830
- After-tax cash flow
- $1,236/yr
For passive investors: Depreciation is non-cash, so a rental often shows a tax loss while cash-flowing — sheltering income. Rental losses are passive: they offset passive income freely, and up to $25,000/yr can offset ordinary (W-2) income if you actively participate and your MAGI is under $100k (phasing out to $0 by $150k); unused losses carry forward. On sale, claimed depreciation is recaptured at up to 25%, and gains may owe capital-gains tax (a 1031 exchange can defer both). Figures are a year-1 estimate at your 24.0% rate — not tax advice; consult a CPA.
Schools (NCES district)
- District
- Franklin Township Community School Corporation
- NCES district ID
- 1803750
- Math proficiency
- 42% ▼ -12.00%
- Reading proficiency
- 47% ▼ -6.00%
- Median HH income
- $67,825
- Composite
- 39.91/100
- National rank
- #3852
- State rank
- #87 of 301 in IN
Livability — Indianapolis city (balance)
No livability data for this city. (Only ~50 U.S. cities are tracked.)
Census & demographics
- Census place
- Indianapolis city (balance), IN
- County
- Marion County · 998,460 people
- City population
- 881,119
- Metro
- Indianapolis-Carmel-Anderson, IN
- Population (ZIP)
- 33,931
- Household income
- $100,331
- Rent vs Own
- Severe rent burden
- 567.0
Population outlook (Marion County) Hauer SSP2
- Today (2025)
- 1,025,572 people
- By 2030
- 1,065,727 · +3.9%
- By 2040
- 1,141,577 · +11.3%
- By 2050
- 1,208,920 · +17.9%
- By 2075
- 1,367,288 · +33.3%
- By 2100
- 1,438,201 · +40.2%
Race, ethnicity, and origin ACS 2023
- Neighborhood character
- Diverse neighborhood (Simpson 0.61)
- Race & ethnicity
- White 57% Black 24% Hispanic / Latino 9% Two or more races 9% Asian 4%
- Hispanic origin (detail)
- Mexican 6%
- Common ancestry
- Lithuanian 2% Slovak 2% Romanian 1%
- Foreign-born
- 7% · Canada, Philippines, China
- Languages at home
- 89% English-only · Spanish 6% Other Indo-European 2% Chinese 1%
Political lean MEDSL · Marion
- 2024 margin
- Strong D (+27.7) · D 63.0% · R 35.3% · Other 1.7%
- 2008→2024 swing
- -0.7pp no change · 2008: 28.4pp · 2024: 27.7pp
- All cycles
- 2024: D+27.7 2020: D+29.1 2016: D+22.8 2012: D+22.2 2008: D+28.4
Not yet ingested
- Civics
- —
Market trends
- HPI YoY
- ▼ -93.15%
- Current HPI
- 226.1965
- Rent YoY
- ▲ 6.11%
- Metro
- Indianapolis-Carmel-Anderson, IN
- State GDP YoY
- ▲ 2.90%
- F500 in state
- 18
Industry mix (Fortune 500 HQ in IN)
| Industry | F500 HQs | Revenue |
|---|---|---|
| Industrial Machinery | 2 | $37B |
|
||
| Healthcare | 1 | $177B |
|
||
| Pharmaceuticals | 1 | $45B |
|
||
| Metals / Steel | 1 | $18B |
|
||
| Agriculture | 1 | $17B |
|
||
| Packaging | 1 | $12B |
|
||
Price history
+162.4% since first listed6 events — show timeline
- 2026-05-10 Pending — MIBOR as Distributed by MLS Grid
- 2026-04-19 Listed $224,900 MIBOR as Distributed by MLS Grid
- 2011-01-06 Listing Removed — MIBOR as Distributed by MLS Grid
- 2010-12-17 Sold (MLS) $30,660 MIBOR as Distributed by MLS Grid
- 2010-10-14 Listed $34,000 MIBOR as Distributed by MLS Grid
- 2000-12-12 Sold (Public Records) $85,698 Public Records
Property tax history
+1.5%/yrLatest (2025): $2,049 · -1.2% YoY. Source: county tax records.
Cash-flow waterfall
monthlySold comps — $/sqft
last 12 mo · ≤1 miLoading sold comps…