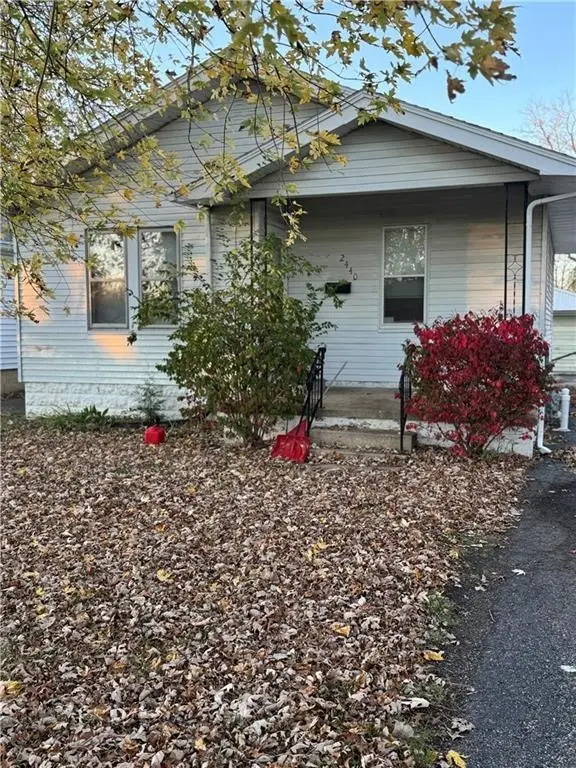
2440 E Wood St · Decatur, IL
Flood risk 1/10 · Minimal
- FEMA flood zone
- X (unshaded)
- Chance of flooding over 30 yrs
- 0.0%
- Est. flood insurance / yr
- $473 – $860
Fire risk 1/10 · Minimal
- Est. fire insurance / yr
- $804 – $1,492
Heat risk 3/10 · Minor
- Hot days now (above 106°F)
- 7 days/yr
- Hot days in 30 yrs
- 18 days/yr
Wind risk 2/10 · Minimal
- Chance of severe wind over 30 yrs
- 1.0%
Air-quality risk 2/10 · Minimal
- Unhealthy air days now
- 1 days/yr
- Unhealthy air days in 30 yrs
- 1 days/yr
Risk factors via First Street. Map © Google.
Why this score? — see what drove the C grade
The composite is a weighted blend of 9 inputs, each scored 0–100. Each bar is that input's sub-score; the figure is the points it added to the 100-point composite (weight × sub-score).
- Cash flow +30.0/30.0
- 1% rule +10.0/10.0
- DSCR +10.0/10.0
- Livability +3.0/5.0
- Rent growth +2.5/5.0
- Condition / age +2.5/5.0
- Schools +0.4/10.0
- ARV discount +0.0/15.0
- Appreciation +0.0/10.0
$55,000
🖨 Deal sheet 📄 Offer letter ✓ Due diligence
Listing remarks MLS
This property presents a great opportunity with a long-term tenant currently in place on a month-to-month lease. Significant updates were completed in 2014, including a new roof, windows, furnace, air conditioning system, and hot water heater, offering added peace of mind and improved efficiency. Whether you’re looking to expand your investment portfolio or plan to make this your own home, the seller is open to both possibilities, providing flexibility to fit your goals.
Key facts
- New furnace
- New hot water heater
- New roof
Tags
Neighborhood map
What this means for you Summary
Snapshot
- This is a 2-bed/1.0-bath other listed at $55k.
Deal economics
- At list price, monthly cash flow is $342 ($4k/yr) — positive.
- The deal already cash-flows at list — no discount required.
- Meets the 1% rule at list price ($947 rent vs $55k).
- Recommended offer: $48k (12.0% below list) — sets the bar for market timing.
- Cap rate 13.8% vs local median 7.0% in Decatur — top-decile yield for the area; either an underpriced asset or a hidden risk that comps aren't pricing in. Stress-test before assuming the spread holds.
Location & tenants
- Location reads 59/100 on livability (#1,076 in IL) — a working-class tenant base; expect higher turnover. Strengths: cost of living A+, housing A+; Watch: schools F, crime F, amenities F.
- Decatur SD 61 (urban): math 3% / reading 6% proficiency, ranked #605 of 620 in IL (top 98%) — low school quality limits family demand, transient renter base, plan for 1-2y turnover; 73% free/reduced lunch — lower-income household profile, screen leases tightly.
- Market conditions: 193 active listings in the ZIP; 11 comparable units currently listed for rent nearby; rentals lingering (median 44d on market — plan ~5-8 weeks vacancy on turnover, expect pricing pressure); 91% of comp listings sitting > 30 days — soft ceiling on asking rent; 63 units permitted in Macon County in 2024 (0 in 5+ unit buildings).
- This rent is only 17% of the median local income ($66k/yr) — well below the 30% rent-burden line; pricing power to push rent on renewal without tenant pushback.
Forward outlook
- Local home prices are declining (-3.0%/yr); year-one equity from $380 of loan paydown is wiped out by about $2k of value loss. Plan a longer hold.
- Macon County population projected at -24% by 2050 — secular population decline; favor cash flow + early exit over multi-decade hold.
- At projected returns (-3.0% appreciation + 3.0% rent growth), your $15k cash investment doubles in ~5 years — after that, you're playing with house money.
Negotiation context
- It's been on market 143 days — a 12% lower offer ($48k) is reasonable based on typical stale-listing flexibility.
- 3 sale attempts since 11y ago with the ask held roughly flat each time — persistent listings suggest the price (not the market) is what's stuck; bring a comps-based counter.
- Current owner paid $11k; list at $55k implies a 405% gain — meaningful room to come down on a strong offer.
Risks & watch-outs
- Watch-outs: built in 1925 — expect roof / HVAC / electrical / plumbing capex.
Questions for the listing agent
- It's been on market 143 days. Have you received any prior offers? Is the seller open to a 12% concession, seller financing, or rate buy-down credit?
- Built in 1925 — when were the roof, HVAC, electrical panel, plumbing, and water heater last replaced?
- Why hasn't it sold? Are there any deal-killer items the seller is aware of (foundation, flood, title, zoning, code violations)?
- Is there a deadline driving the sale (1031 exchange, divorce, estate, relocation)? That informs how much negotiation room exists.
- Schools are F-rated, which usually means shorter tenancies and higher turnover. Who's the typical renter profile here, and what's been the actual vacancy rate?
- Crime grade is F in this area — have there been break-ins, vandalism, or insurance claims at this property in the last 3 years? What carrier currently insures it and at what premium?
- What's the average days-on-market for RENTAL listings here right now (not sales)? A rising rental-DOM trend means longer vacancies and softer asking-rent achievability than the comps imply.
- What's the recent tenant-quality profile in this submarket — average credit score on applications, eviction rate, late-payment / NSF rate, and stable-employment percentage? A property-management company in the area should have these aggregated.
- How much new for-sale + rental construction is in the pipeline within 1–3 miles? Heavy new supply typically softens prices + rents 12–24 months out; constrained supply supports both.
Investment metrics
- 1% rule
- 1.72% ✓
- Cap rate
- 13.76%
- Cash-on-cash
- 26.66%
- DSCR
- 2.19
- GRM
- 4.8
CMA / ARV
- ARV (median comp)
- $40,694
- List price
- $55,000
- Delta
- 35.16%
- Verdict
- OVERPRICED
- Comps
- 20 within 1.0 mi
Projected returns pro-forma
-3.0% appreciation · 3.0% rent growth · sell at horizon
- IRR
- 20.5%
- Equity multiple
- 1.84×
- Total profit
- $12,907
- Equity at exit
- $8,201
- IRR
- 28.8%
- Equity multiple
- 3.56×
- Total profit
- $39,420
- Equity at exit
- $4,755
Cash invested: $15,400 (down + closing). Projections, not guarantees.
Landlord ↔ Tenant lean methodology
- Overall (STATE)
- 43 Moderately Tenant-Leaning
- State Illinois
- 43 Moderately Tenant-Leaning · D+7
- County
- — inherits STATE
- City
- — inherits STATE
ZIP-level market 62521
- Home prices YoY
- -9.0%
- Active inventory
- 193
- Price-to-rent
- 4.8×
Monthly cashflow live
- Estimated rent
- $947 high interval (Pro) →
- Mortgage (P&I)
- −$288
- Tax from tax record
- −$95 /mo · $1,140/yr
- Insurance
- −$23
- HOA
- −$0
- Vacancy / Maint / Mgmt
- −$199
- Net cashflow
- $342
Break-even live
UW: 25.0% down · 7.5% · 30yr · 1.5% tax · 5.0% vac · 8.0% maint · 8.0% mgmt
Financing live
Cash to close
- Down payment
- $13,750
- Closing costs
- $1,650
- Reserves months
- —
- Total cash needed
- —
Loan-product check · same deal, 3 products live
Conventional
25% down · 7.5% · 30yr
- Down + closing
- —
- Monthly P&I
- —
- Monthly cashflow
- —
- DSCR
- —
- Eligible?
- —
Personal DTI + credit; lowest rate.
DSCR
20% down · 8.5% · 30yr
- Down + closing
- —
- Monthly P&I
- —
- Monthly cashflow
- —
- DSCR
- —
- Eligible?
- —
No personal income docs; deal must DSCR.
Hard money
10% down · 12.0% · 12mo
- Down + closing
- —
- Monthly P&I
- —
- Monthly cashflow
- —
- DSCR
- —
- Eligible?
- —
Short-term bridge; refi at stabilization.
Rent comps 11 comps
| Address | Beds | Baths | Sqft | Rent | $/sqft | DOM | Units | Dist |
|---|---|---|---|---|---|---|---|---|
| 2448 E Wood St Decatur, IL | 3.0 | 1.0 | 800 | $995 | $1.24 | 13d | 1 | 0.01mi |
| 2032 E North St Decatur, IL | 2.0 | 1.0 | 754 | $900 | $1.19 | 43d | 1 | 0.58mi |
| 249 N 17th St Decatur, IL | 3.0 | 2.0 | 700 | $995 | $1.42 | 43d | 1 | 0.81mi |
| 165 S East Ave Unit NA Decatur, IL | 2.0 | 1.0 | 850 | $800 | $0.94 | 43d | 1 | 0.94mi |
| 1718 E Cantrell St Decatur, IL | 3.0 | 2.0 | 900 | $1,000 | $1.11 | 43d | 1 | 0.95mi |
| 347 N Stone St Decatur, IL | 2.0 | 1.0 | 850 | $875 | $1.03 | 43d | 1 | 1.03mi |
| 1455 E Whitmer St Decatur, IL | 2.0 | 1.0 | 1050 | $915 | $0.87 | 43d | 1 | 1.06mi |
| 698 S Stone St Decatur, IL | 2.0 | 1.0 | 900 | $795 | $0.88 | 43d | 1 | 1.09mi |
| 1237 E Johns Ave Decatur, IL | 2.0 | 1.0 | 1000 | $895 | $0.90 | 43d | 1 | 1.12mi |
| 1245 Sedgwick St Decatur, IL | 2.0 | 1.0 | 1055 | $895 | $0.85 | 43d | 1 | 1.12mi |
| 1304 E Lawrence St Decatur, IL | 2.0 | 1.0 | 850 | $850 | $1.00 | 43d | 1 | 1.14mi |
Listing history 23 events
-
2026-06-19days on market $55,000 Active 143 DOM
-
2026-06-18days on market $55,000 Active 142 DOM
-
2026-06-17days on market $55,000 Active 141 DOM
-
2026-06-16days on market $55,000 Active 140 DOM
-
2026-06-15days on market $55,000 Active 139 DOM
-
2026-06-14days on market $55,000 Active 137 DOM
-
2026-06-13days on market $55,000 Active 136 DOM
-
2026-06-10days on market $55,000 Active 134 DOM
-
2026-06-09days on market $55,000 Active 133 DOM
-
2026-06-08days on market $55,000 Active 132 DOM
-
2026-06-07days on market $55,000 Active 131 DOM
-
2026-06-05days on market $55,000 Active 128 DOM
-
2026-06-02days on market $55,000 Active 126 DOM
-
2026-06-01days on market $55,000 Active 125 DOM
-
2026-05-31days on market $55,000 Active 124 DOM
-
2026-05-30days on market $55,000 Active 123 DOM
-
2026-01-27$55,000 Active 481-char remark
Show marketing remark (481 chars)
This property presents a great opportunity with a long-term tenant currently in place on a month-to-month lease. Significant updates were completed in 2014, including a new roof, windows, furnace, air conditioning system, and hot water heater, offering added peace of mind and improved efficiency. Whether you’re looking to expand your investment portfolio or plan to make this your own home, the seller is open to both possibilities, providing flexibility to fit your goals.
-
2024-11-13$45,900 Active
-
2015-08-21soldstatus $10,900
-
2015-02-27$14,000
-
2014-03-11historical
-
2011-08-19soldstatus $47,000
-
2005-08-03soldstatus $34,000
ⓘ Source: listings_history table (triggers on properties + properties_extension) + one-shot
backfill from property_details.listing_events for pre-trigger history.
Tax reassessment forecast IL · Partial reset (capped growth)
- Current annual tax
- $1,140 · $95/mo
- Projected year-2 tax
- $1,194 · $100/mo
- Expected delta
- +$54/yr (+$5/mo · 4.7%)
ⓘ Screening estimate from a state-policy table — verify with the county assessor before closing.
Climate risk First Street
- Flood 1/10 Low FEMA zone X (unshaded) · 0% chance over 30 yrs
- Wildfire 1/10 Low
- Heat 3/10 Moderate 7 d/yr ≥106°F today · 18 d/yr by 30 yrs out
- Wind 2/10 Low 100% chance of damaging wind over 30 yrs
- Air quality 2/10 Low 1 unhealthy d/yr today · 1 by 30 yrs out
Nearby sold comps map
Loading sold comps map…
Walkable amenities ~0.75 mi
Loading nearby amenities…
Taxation est. · year 1
- Rental income
- $11,369
- − Mortgage interest
- −$3,081
- − Property taxes
- −$1,140
- − Insurance
- −$275
- − Repairs & maintenance
- −$910
- − Management
- −$910
- − Depreciation
- −$1,600
- Taxable income
- $3,454
- Est. tax owed @ 24.0%
- −$829
- After-tax cash flow
- $3,276/yr
For passive investors: Depreciation is non-cash, so a rental often shows a tax loss while cash-flowing — sheltering income. Rental losses are passive: they offset passive income freely, and up to $25,000/yr can offset ordinary (W-2) income if you actively participate and your MAGI is under $100k (phasing out to $0 by $150k); unused losses carry forward. On sale, claimed depreciation is recaptured at up to 25%, and gains may owe capital-gains tax (a 1031 exchange can defer both). Figures are a year-1 estimate at your 24.0% rate — not tax advice; consult a CPA.
Schools (NCES district)
- District
- Decatur SD 61
- NCES district ID
- 1711850
- Math proficiency
- 3% ▼ -4.00%
- Reading proficiency
- 6% ▼ -6.00%
- Median HH income
- $38,864
- Composite
- 3.99/100
- National rank
- #10059
- State rank
- #605 of 620 in IL
Livability — Decatur
- Score
- 59/100
- State rank
- #1076
- US rank
- #20533
Category grades
Schools grade is shown separately in the Schools card above.
Census & demographics
- Census place
- Decatur, IL
- County
- Macon County · 78,333 people
- City population
- 78,333
- Metro
- Decatur, IL
- Population (ZIP)
- 32,665
- Household income
- $66,337
- Rent vs Own
- Severe rent burden
- 640.0
Population outlook (Macon County) Hauer SSP2
- Today (2025)
- 99,568 people
- By 2030
- 94,973 · -4.6%
- By 2040
- 85,250 · -14.4%
- By 2050
- 75,920 · -23.8%
- By 2075
- 55,962 · -43.8%
- By 2100
- 36,468 · -63.4%
Race, ethnicity, and origin ACS 2023
- Neighborhood character
- Predominantly White (75%)
- Race & ethnicity
- White 75% Black 17% Two or more races 5% Hispanic / Latino 3%
- Common ancestry
- Slovak 3% Romanian 2% Lithuanian 2%
- Foreign-born
- 3% · Canada
- Languages at home
- 96% English-only · Spanish 2% Russian/Polish/Slavic 1% Other Indo-European 0%
Political lean MEDSL · Macon
- 2024 margin
- R (+18.9) · D 39.8% · R 58.7% · Other 1.4%
- 2008→2024 swing
- -20.0pp toward R · 2008: 1.1pp · 2024: -18.9pp
- All cycles
- 2024: R+18.9 2020: R+17.7 2016: R+18.1 2012: R+5.2 2008: D+1.1
Not yet ingested
- Civics
- —
Market trends
- HPI YoY
- ▼ -17.96%
- Current HPI
- 180.9274
- Rent YoY
- —
- Metro
- Decatur, IL
- State GDP YoY
- ▲ 1.59%
- F500 in state
- 60
Industry mix (Fortune 500 HQ in IL)
| Industry | F500 HQs | Revenue |
|---|---|---|
| Insurance | 4 | $201B |
|
||
| Consumer Goods | 4 | $87B |
|
||
| Industrial Machinery | 3 | $64B |
|
||
| Healthcare | 2 | $55B |
|
||
| Retail / Pharmacy | 1 | $148B |
|
||
| Agriculture / Food | 1 | $86B |
|
||
Price history
+61.8% since first listed7 events — show timeline
- 2026-01-27 Listed $55,000 CIBR
- 2024-11-13 Listed $45,900 CIBR
- 2015-08-21 Sold (MLS) $10,900 RMLSA as Distributed by MLS Grid
- 2015-02-27 Listed $14,000 RMLSA as Distributed by MLS Grid
- 2014-03-11 Listing Removed — MRED as Distributed by MLS Grid
- 2011-08-19 Sold (Public Records) $47,000 Public Records
- 2005-08-03 Sold (Public Records) $34,000 Public Records
Property tax history
+9.3%/yrLatest (2024): $1,140 · +0.8% YoY. Source: county tax records.
Cash-flow waterfall
monthlySold comps — $/sqft
last 12 mo · ≤1 miLoading sold comps…