 🏷️ Likely Rental
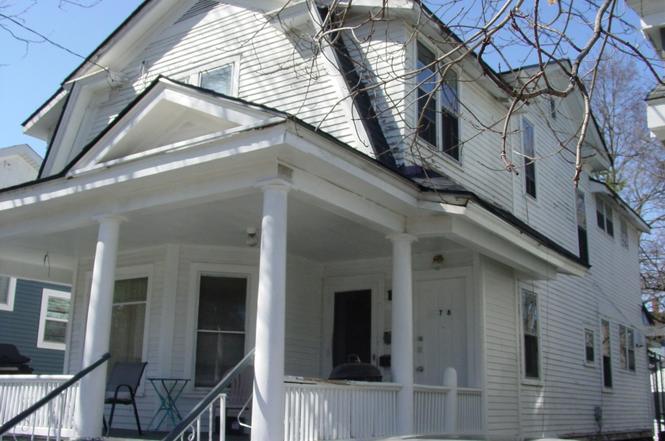
718 W Cedar St · Kalamazoo, MI
Flood risk 1/10 · Minimal
- FEMA flood zone
- X (unshaded)
- Chance of flooding over 30 yrs
- 0.0%
- Est. flood insurance / yr
- $507 – $1,088
Fire risk 1/10 · Minimal
- Est. fire insurance / yr
- $784 – $1,456
Heat risk 3/10 · Minor
- Hot days now (above 100°F)
- 7 days/yr
- Hot days in 30 yrs
- 16 days/yr
Wind risk 2/10 · Minimal
- Chance of severe wind over 30 yrs
- —
Air-quality risk 2/10 · Minimal
- Unhealthy air days now
- 1 days/yr
- Unhealthy air days in 30 yrs
- 2 days/yr
Risk factors via First Street. Map © Google.
Why this score? — see what drove the C+ grade
The composite is a weighted blend of 9 inputs, each scored 0–100. Each bar is that input's sub-score; the figure is the points it added to the 100-point composite (weight × sub-score).
- Cash flow +22.3/30.0
- ARV discount +15.0/15.0
- DSCR +7.1/10.0
- 1% rule +6.6/10.0
- Schools +4.7/10.0
- Livability +3.8/5.0
- Condition / age +2.5/5.0
- Rent growth +2.3/5.0
- Appreciation +0.0/10.0
$139,900
🖨 Deal sheet (PDF) 📄 Offer letter ✓ Due diligence
Listing remarks MLS
Both units are 2 BR, 1 bath, kitchen and living room. Both rent for $750/mo. Landlord pays all utilities and trash. Brand new shingles on hone 2 weeks ago.
Key facts
- Brand new shingles
- 3,920 sq ft lot
- 2 parking spots
Tags
Neighborhood map
What this means for you Summary
Snapshot
- This is a 3-bed/2.0-bath single-family listed at $140k.
Deal economics
- At list price, monthly cash flow is $230 ($3k/yr) — positive.
- The deal already cash-flows at list — no discount required.
- Meets the 1% rule at list price ($2k rent vs $140k).
- Recommended offer: $127k (9.0% below list) — sets the bar for market timing.
- Cap rate 8.3% vs local median 3.4% in Kalamazoo — top-decile yield for the area; either an underpriced asset or a hidden risk that comps aren't pricing in. Stress-test before assuming the spread holds.
Location & tenants
- Location reads 76/100 on livability (#141 in MI, #3,492 nationally) — a middle-class / working-renter tenant base. Strengths: commute A+, cost of living A+, housing A+; Watch: crime F, employment D-.
- Kalamazoo Public Schools (urban): math 43% / reading 72% proficiency, ranked #71 of 540 in MI (top 13%) — acceptable for families but not a draw, mixed tenant base, ~2y average lease; 66% free/reduced lunch — lower-income household profile, screen leases tightly.
- Zoned schools: Woods Lake Elementarya Magnet Center For The Arts (566 students, 86% FRL); Maple Street Magnet School For The Arts (math 75% / reading 75%, grade A, #8 of 493 statewide, top 3%, 860 students, 59% FRL); Loy Norrix High School (math 47% / reading 82%, grade B-, #46 of 713 statewide, top 7%, 1,771 students, 68% FRL).
- Zoned-school proficiency averages 70% at this address vs 58% district-wide (+12 pts) — the actual schools serving this property are materially stronger than the Kalamazoo Public Schools average implies; a family-tenant draw the district grade alone would hide.
- Market conditions: Rents soft (-0.8%/yr); 77 active listings in the ZIP; 7 comparable units currently listed for rent nearby; rentals at typical pace (median 15d on market — plan ~3-4 weeks tenant-placement turnaround); lower-income renter base — watch delinquency; 339 units permitted in Kalamazoo County in 2024 (22 in 5+ unit buildings).
- At $1,619/mo this rent would consume 49% of the median local household income ($39k/yr) (locally 816% of renters already pay >50% of income on rent) — very limited rent-growth headroom before tenants either downsize or default.
Forward outlook
- Local home prices are declining (-3.0%/yr); year-one equity from $967 of loan paydown is wiped out by about $4k of value loss. Plan a longer hold.
- Kalamazoo County population projected at +18% by 2050 — long-run rental-demand tailwind backs the buy-and-hold thesis.
Negotiation context
- It's been on market 99 days — a 9% lower offer ($127k) is reasonable based on typical stale-listing flexibility.
- 22 sale attempts since 18y ago; this cycle's ask has dropped $20k (13%) from the opening price — seller is motivated, your offer sets the floor, not the list.
- Current owner paid $74k; list at $140k implies a 88% gain — meaningful room to come down on a strong offer.
Risks & watch-outs
- Watch-outs: built in 1901 — expect roof / HVAC / electrical / plumbing capex.
Questions for the listing agent
- It's been on market 99 days. Have you received any prior offers? Is the seller open to a 9% concession, seller financing, or rate buy-down credit?
- Built in 1901 — when were the roof, HVAC, electrical panel, plumbing, and water heater last replaced?
- Why hasn't it sold? Are there any deal-killer items the seller is aware of (foundation, flood, title, zoning, code violations)?
- Is there a deadline driving the sale (1031 exchange, divorce, estate, relocation)? That informs how much negotiation room exists.
- Crime grade is F in this area — have there been break-ins, vandalism, or insurance claims at this property in the last 3 years? What carrier currently insures it and at what premium?
- What's the average days-on-market for RENTAL listings here right now (not sales)? A rising rental-DOM trend means longer vacancies and softer asking-rent achievability than the comps imply.
- What's the recent tenant-quality profile in this submarket — average credit score on applications, eviction rate, late-payment / NSF rate, and stable-employment percentage? A property-management company in the area should have these aggregated.
- How much new for-sale + rental construction is in the pipeline within 1–3 miles? Heavy new supply typically softens prices + rents 12–24 months out; constrained supply supports both.
Investment metrics
- 1% rule
- 1.16% ✓
- Cap rate
- 8.27%
- Cash-on-cash
- 7.05%
- DSCR
- 1.31
- GRM
- 7.2
CMA / ARV
- ARV (on-the-fly)
- $234,132
- Comps found
- 12
Show comp detail 12 sales within ~0.75 mi
| Address | Dist | Beds/Ba | Sqft | Sold | Price | $/sf | Match |
|---|---|---|---|---|---|---|---|
| 442 W Dutton St | 0.27mi | 4/2.0 (+1) | 1,928 (-10%) | 2mo | $249,900 | $130 | 64 |
| 435 Skirrow Pl | 0.57mi | 3/1.0 | 2,088 (-3%) | 8mo | $149,900 | $72 | 59 |
| 1209 Grand Ave | 0.52mi | 4/2.5 (+1) | 2,086 (-3%) | 8mo | $324,000 | $155 | 57 |
| 306 W Dutton St | 0.39mi | 3/2.0 | 1,864 (-13%) | 4mo | $105,000 | $56 | 57 |
| 955 Austin St | 0.38mi | 3/1.0 | 1,967 (-8%) | 14mo | $144,000 | $73 | 52 |
| 1509 Academy St | 0.68mi | 4/1.5 (+1) | 2,128 (-1%) | 9mo | $377,500 | $177 | 52 |
| 512 Douglas Ave | 0.65mi | 4/3.0 (+1) | 2,166 (+1%) | 12mo | $65,000 | $30 | 49 |
| 511 Woodward Ave | 0.59mi | 4/2.0 (+1) | 2,352 (+10%) | 7mo | $265,000 | $113 | 46 |
| 436 W Ransom St | 0.66mi | 3/2.0 | 1,884 (-12%) | 7mo | $206,000 | $109 | 43 |
| 431 Park Pl | 0.56mi | 4/2.0 (+1) | 1,930 (-10%) | 14mo | $240,000 | $124 | 41 |
| 440 W Ransom St | 0.67mi | 3/2.0 | 1,884 (-12%) | 10mo | $200,000 | $106 | 40 |
| 434 W Ransom St | 0.67mi | 3/2.0 | 1,884 (-12%) | 11mo | $200,000 | $106 | 39 |
Match score weights: distance 35% · size 25% · config 20% · recency 20%. Top-matched comps best support the ARV.
Projected returns pro-forma
-3.0% appreciation · 0.0% rent growth · sell at horizon
- IRR
- -9.1%
- Equity multiple
- 0.68×
- Total profit
- $-12,683
- Equity at exit
- $20,860
- IRR
- -4.6%
- Equity multiple
- 0.74×
- Total profit
- $-10,204
- Equity at exit
- $12,096
Cash invested: $39,172 (down + closing). Projections, not guarantees.
Landlord ↔ Tenant lean methodology
- Overall (STATE)
- 62 Landlord-Friendly
- State Michigan
- 62 Landlord-Friendly · EVEN
- County
- — inherits STATE
- City
- — inherits STATE
ZIP-level market 49007
- Rents YoY
- -0.8%
- Active inventory
- 77
- Price-to-rent
- 7.2×
Monthly cashflow live
- Estimated rent
- $1,619 high interval (Pro) →
- Mortgage (P&I)
- −$734
- Tax from tax record
- −$257 /mo · $3,083/yr
- Insurance
- −$58
- HOA
- −$0
- Vacancy / Maint / Mgmt
- −$340
- Net cashflow
- $230
Break-even live
Sensitivity live
| Price | -10% $309 | -5% $270 | +0% $230 | +5% $191 | +10% $151 |
|---|---|---|---|---|---|
| Rent | -10% $102 | -5% $166 | +0% $230 | +5% $294 | +10% $358 |
| Rate | -1.0pp $301 | -0.5pp $266 | base $230 | +0.5pp $194 | +1.0pp $157 |
UW: 25.0% down · 7.5% · 30yr · 1.5% tax · 5.0% vac · 8.0% maint · 8.0% mgmt
Financing live
Cash to close
- Down payment
- $34,975
- Closing costs
- $4,197
- Reserves months
- —
- Total cash needed
- —
Loan-product check · same deal, 3 products live
Conventional
25% down · 7.5% · 30yr
- Down + closing
- —
- Monthly P&I
- —
- Monthly cashflow
- —
- DSCR
- —
- Eligible?
- —
Personal DTI + credit; lowest rate.
DSCR
20% down · 8.5% · 30yr
- Down + closing
- —
- Monthly P&I
- —
- Monthly cashflow
- —
- DSCR
- —
- Eligible?
- —
No personal income docs; deal must DSCR.
Hard money
10% down · 12.0% · 12mo
- Down + closing
- —
- Monthly P&I
- —
- Monthly cashflow
- —
- DSCR
- —
- Eligible?
- —
Short-term bridge; refi at stabilization.
Rent comps 7 comps
| Address | Beds | Baths | Sqft | Rent | $/sqft | DOM | Units | Dist |
|---|---|---|---|---|---|---|---|---|
| 807 Central Park Cir Kalamazoo, MI | 1.0–3.0 | 1.0–2.0 | 1089 | $2,345 | $2.15 | 15d | 12 | 0.30mi |
| 838 W Main St Kalamazoo, MI | 4.0 | 1.0 | 1470 | $1,300 | $0.88 | 22d | 1 | 0.31mi |
| 232 Woodward Ave Unit 5 Kalamazoo, MI | 2.0 | 1.0 | 1400 | $999 | $0.71 | 15d | 1 | 0.39mi |
| 722 W Kalamazoo Ave Unit 2 Kalamazoo, MI | 3.0 | 1.0 | 1800 | $1,600 | $0.89 | 22d | 1 | 0.46mi |
| 211 Rose Pl Kalamazoo, MI | 2.0 | 2.0 | 1695 | $1,200 | $0.71 | 22d | 1 | 0.53mi |
| 525 S Burdick St Kalamazoo, MI | 2.0 | 2.0 | 1555 | $2,928 | $1.88 | 15d | 2 | 0.55mi |
| 125 S Kalamazoo Mall Kalamazoo, MI | 2.0 | 2.0 | 1833 | $3,088 | $1.68 | 15d | 1 | 0.56mi |
Listing history 48 events
-
2026-04-14status Pending
Show marketing remark (155 chars)
Both units are 2 BR, 1 bath, kitchen and living room. Both rent for $750/mo. Landlord pays all utilities and trash. Brand new shingles on hone 2 weeks ago.
-
2026-04-14status Pending 155-char remark
Show marketing remark (155 chars)
Both units are 2 BR, 1 bath, kitchen and living room. Both rent for $750/mo. Landlord pays all utilities and trash. Brand new shingles on hone 2 weeks ago.
-
2026-03-18price $139,900 155-char remark
Show marketing remark (155 chars)
Both units are 2 BR, 1 bath, kitchen and living room. Both rent for $750/mo. Landlord pays all utilities and trash. Brand new shingles on hone 2 weeks ago.
-
2026-03-17price $139,900
-
2026-01-20status Active
Show marketing remark (155 chars)
Both units are 2 BR, 1 bath, kitchen and living room. Both rent for $750/mo. Landlord pays all utilities and trash. Brand new shingles on hone 2 weeks ago.
-
2026-01-20status Active 155-char remark
Show marketing remark (155 chars)
Both units are 2 BR, 1 bath, kitchen and living room. Both rent for $750/mo. Landlord pays all utilities and trash. Brand new shingles on hone 2 weeks ago.
-
2025-12-10status Pending
Show marketing remark (155 chars)
Both units are 2 BR, 1 bath, kitchen and living room. Both rent for $750/mo. Landlord pays all utilities and trash. Brand new shingles on hone 2 weeks ago.
-
2025-12-10status Pending 155-char remark
Show marketing remark (155 chars)
Both units are 2 BR, 1 bath, kitchen and living room. Both rent for $750/mo. Landlord pays all utilities and trash. Brand new shingles on hone 2 weeks ago.
-
2025-11-25$159,900 Active
-
2025-11-24$159,900 Active 155-char remark
Show marketing remark (155 chars)
Both units are 2 BR, 1 bath, kitchen and living room. Both rent for $750/mo. Landlord pays all utilities and trash. Brand new shingles on hone 2 weeks ago.
-
2025-10-31historical
-
2025-10-31historical
-
2025-04-11$174,900 Active
-
2025-04-11$174,900 Active
-
2017-12-08soldstatus $74,500
-
2017-12-08soldstatus $74,500 Sold
-
2017-10-24status Pending
-
2017-09-11$85,000 Active
-
2017-09-11$85,000
-
2017-09-11historical
-
2017-08-04historical
-
2017-08-04status Pending
-
2017-07-28status Active
-
2017-07-19status Pending
-
2017-02-09$85,000 Active
-
2017-02-09$85,000
-
2017-01-22historical
-
2017-01-21historical
-
2016-07-29$78,000 Active
-
2016-07-28$78,000
-
2016-06-29historical
-
2016-06-28historical
-
2016-06-06status Active
-
2016-06-02historical
-
2015-12-01$77,000 Active
-
2015-12-01$77,000
-
2015-11-02historical
-
2015-11-01historical
-
2015-09-05$99,900 Active
-
2015-04-28$99,900
-
2014-12-10historical
-
2014-12-10historical
-
2014-10-30$99,900
-
2014-10-30$99,900
-
2014-10-17historical
-
2014-10-17historical
-
2008-09-22$159,000
-
2008-05-19$173,900
ⓘ Source: listings_history table (triggers on properties + properties_extension) + one-shot
backfill from property_details.listing_events for pre-trigger history.
Tax reassessment forecast MI · Partial reset (capped growth)
- Current annual tax
- $3,083 · $257/mo
- Projected year-2 tax
- $3,083 · $257/mo
- Expected delta
- $0/yr ($0/mo · 0.0%)
ⓘ Screening estimate from a state-policy table — verify with the county assessor before closing.
Climate risk First Street
- Flood 1/10 Low FEMA zone X (unshaded) · 0% chance over 30 yrs
- Wildfire 1/10 Low
- Heat 3/10 Moderate 7 d/yr ≥100°F today · 16 d/yr by 30 yrs out
- Wind 2/10 Low
- Air quality 2/10 Low 1 unhealthy d/yr today · 2 by 30 yrs out
Nearby sold comps map
Loading sold comps map…
Walkable amenities ~0.75 mi
Loading nearby amenities…
Taxation est. · year 1
- Rental income
- $19,427
- − Mortgage interest
- −$7,837
- − Property taxes
- −$3,083
- − Insurance
- −$700
- − Repairs & maintenance
- −$1,554
- − Management
- −$1,554
- − Depreciation
- −$4,070
- Taxable income
- $630
- Est. tax owed @ 24.0%
- −$151
- After-tax cash flow
- $2,610/yr
For passive investors: Depreciation is non-cash, so a rental often shows a tax loss while cash-flowing — sheltering income. Rental losses are passive: they offset passive income freely, and up to $25,000/yr can offset ordinary (W-2) income if you actively participate and your MAGI is under $100k (phasing out to $0 by $150k); unused losses carry forward. On sale, claimed depreciation is recaptured at up to 25%, and gains may owe capital-gains tax (a 1031 exchange can defer both). Figures are a year-1 estimate at your 24.0% rate — not tax advice; consult a CPA.
Schools (NCES district)
- District
- Kalamazoo Public Schools
- NCES district ID
- 2619950
- Math proficiency
- 43% ▲ 13.00%
- Reading proficiency
- 72% ▲ 33.00%
- Median HH income
- $35,291
- Composite
- 47.48/100
- National rank
- #2275
- State rank
- #71 of 540 in MI
Livability — Kalamazoo
- Score
- 76/100
- State rank
- #141
- US rank
- #3492
Category grades
Schools grade is shown separately in the Schools card above.
Census & demographics
- Census place
- Kalamazoo, MI
- County
- Kalamazoo County · 224,317 people
- City population
- 121,397
- Metro
- Kalamazoo-Portage, MI
- Population (ZIP)
- 9,836
- Household income
- $39,344
- Rent vs Own
- Severe rent burden
- 816.0
Population outlook (Kalamazoo County) Hauer SSP2
- Today (2025)
- 280,982 people
- By 2030
- 292,068 · +3.9%
- By 2040
- 312,191 · +11.1%
- By 2050
- 331,196 · +17.9%
- By 2075
- 379,021 · +34.9%
- By 2100
- 396,579 · +41.1%
Race, ethnicity, and origin ACS 2023
- Neighborhood character
- Diverse neighborhood (Simpson 0.61)
- Race & ethnicity
- White 44% Black 44% Two or more races 7% Hispanic / Latino 3%
- Common ancestry
- Iranian 3% Romanian 2% Lithuanian 1%
- Foreign-born
- 3% · Canada
- Languages at home
- 94% English-only · Spanish 4% French/Haitian/Cajun 1% Arabic 1%
Political lean MEDSL · Kalamazoo
- 2024 margin
- D (+17.7) · D 58.0% · R 40.3% · Other 1.7%
- 2008→2024 swing
- -1.8pp toward R · 2008: 19.5pp · 2024: 17.7pp
- All cycles
- 2024: D+17.7 2020: D+18.7 2016: D+12.8 2012: D+13.3 2008: D+19.5
Not yet ingested
- Civics
- —
Market trends
- HPI YoY
- ▼ -68.80%
- Current HPI
- 112.4973
- Rent YoY
- ▼ -0.85%
- Metro
- Kalamazoo-Portage, MI
- State GDP YoY
- ▲ 1.37%
- F500 in state
- 28
Industry mix (Fortune 500 HQ in MI)
| Industry | F500 HQs | Revenue |
|---|---|---|
| Automotive Parts | 3 | $48B |
|
||
| Automotive | 2 | $372B |
|
||
| Chemicals | 1 | $45B |
|
||
| Automotive Retail | 1 | $29B |
|
||
| Healthcare / Medical Devices | 1 | $23B |
|
||
| Automotive Technology | 1 | $20B |
|
||
Price history
-19.6% since first listed48 events — show timeline
- 2026-04-14 Pending — REALCOMP
- 2026-04-14 Pending — MiRealSource-MiMLS
- 2026-03-18 Price Changed $139,900 MiRealSource-MiMLS
- 2026-03-17 Price Changed $139,900 REALCOMP
- 2026-01-20 Relisted — REALCOMP
- 2026-01-20 Relisted — MiRealSource-MiMLS
- 2025-12-10 Pending — REALCOMP
- 2025-12-10 Pending — MiRealSource-MiMLS
- 2025-11-25 Listed $159,900 REALCOMP
- 2025-11-24 Listed $159,900 MiRealSource-MiMLS
- 2025-10-31 Listing Removed — REALCOMP
- 2025-10-31 Listing Removed — MiRealSource-MiMLS
- 2025-04-11 Listed $174,900 REALCOMP
- 2025-04-11 Listed $174,900 MiRealSource-MiMLS
- 2017-12-08 Sold (MLS) $74,500 SW Michigan MLS
- 2017-12-08 Sold (MLS) $74,500 REALCOMP
- 2017-10-24 Pending — SW Michigan MLS
- 2017-09-11 Listed $85,000 SW Michigan MLS
- 2017-09-11 Listing Removed — REALCOMP
- 2017-09-11 Listed $85,000 REALCOMP
- 2017-08-04 Listing Removed — SW Michigan MLS
- 2017-08-04 Pending — SW Michigan MLS
- 2017-07-28 Relisted — SW Michigan MLS
- 2017-07-19 Pending — SW Michigan MLS
- 2017-02-09 Listed $85,000 SW Michigan MLS
- 2017-02-09 Listed $85,000 REALCOMP
- 2017-01-22 Listing Removed — SW Michigan MLS
- 2017-01-21 Listing Removed — REALCOMP
- 2016-07-29 Listed $78,000 SW Michigan MLS
- 2016-07-28 Listed $78,000 REALCOMP
- 2016-06-29 Listing Removed — SW Michigan MLS
- 2016-06-28 Listing Removed — REALCOMP
- 2016-06-06 Relisted — SW Michigan MLS
- 2016-06-02 Listing Removed — SW Michigan MLS
- 2015-12-01 Listed $77,000 SW Michigan MLS
- 2015-12-01 Listed $77,000 REALCOMP
- 2015-11-02 Listing Removed — SW Michigan MLS
- 2015-11-01 Listing Removed — REALCOMP
- 2015-09-05 Listed $99,900 SW Michigan MLS
- 2015-04-28 Listed $99,900 REALCOMP
- 2014-12-10 Listing Removed — SW Michigan MLS
- 2014-12-10 Listing Removed — REALCOMP
- 2014-10-30 Listed $99,900 SW Michigan MLS
- 2014-10-30 Listed $99,900 REALCOMP
- 2014-10-17 Listing Removed — SW Michigan MLS
- 2014-10-17 Listing Removed — SW Michigan MLS
- 2008-09-22 Listed $159,000 SW Michigan MLS
- 2008-05-19 Listed $173,900 SW Michigan MLS
Property tax history
+3.7%/yrLatest (2025): $3,083 · -13.0% YoY. Source: county tax records.
Cash-flow waterfall
monthlySold comps — $/sqft
last 12 mo · ≤1 miLoading sold comps…